 Mini Review
Measurements of Foot Impact Versus Ground in Natural Environment Outside the Laboratory
Ewa Klimiec1*, Piotr Guzdek1, Grzegorz Kolaszczyński1, Barbara Jasiewicz2, Jacek Piekarski1 and Krzysztof Zaraska1
1Institute of Electron Technology Cracow Division, Poland
2Department of Orthopedics and Rehabilitation, Poland
Ewa Klimiec, Institute of Electron Technology Cracow Division, Siec Lukasiewicz, Cracow, Poland.ive Care Medicine, Anichstrasse 35, 6020 Innsbruck, Austria.
Received Date: January 21, 2020; Published Date: February 03, 2020
Abstract
This paper presents system for measuring the foot forces against ground in natural environmental conditions. Abilities of walk biomechanics based on measurement data analysis is shown. Approximately 4mm thick measurement insole can be placed in sport shoe. It is durable and does not require calibration during its lifecycle. Entire system is ease of use and operation.
Keywords: Foot force; Walk biomechanics; Gait phases
Introduction
There are many methods of dynamic analysis of foot loading, however, we still need a simple, easily applicable system for foot plantar pressure analysis [1,2]. Presented measurement system developed by the authors is useful for diagnosis of feet and postural deficiencies [3,4]. Examination is performed under dynamic conditions such as during walking, running or jumping. This kind of foot-ground force measurements in natural environment outside the laboratory allow for reliable examination of foot and overall human posture biomechanics.
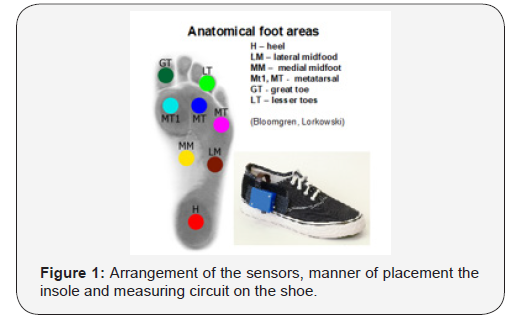
Measurement element is in form of shoe insole consist of 8 piezopolymer sensors. Proper placement of the transducers in anatomical foot areas and its adequate selected surface provide correct foot versus ground force measurement in accordance with its biomechanics.
Signals from individual sensors are processed simultaneously. Electric signal is linearly dependent from compression force. Piezoelectric sensors do not need external power supply and their calibration is performed during construction and assembly. Afterward calibration is not required because PVDF film which is used as transducer is durable and characterized by high mechanical and electrical stability. Measuring insole can by fitted in any sport shoe. Electronic circuit attached to the shoe is amplifying and transmitting wirelessly sensor signals. Appropriate housing protects it from solid and liquid contamination. All of it weighs approximately 50 grams.
Plantar foot force measuring system can be used in following areas:
• Orthopedics: foot defects, especially for children, e.g. talipes equinovalgus difficult for clinical/radiological assessment, flat feet, diabetics foot,
• Neurology: gait dynamics, foot placement, foot drop,
• Cardiovascular diseases: ability of maintain even gait rhythm, influence of land surface to gait period and walk manner,
• Rehabilitation: walk manner during convalescence, influence of prosthesis to biomechanics
• Wireless data transmission allows for using this kind of device in telemedicine.
System presentation
Measurement system consist of following parts: data collection, wireless data transmission, data visualization and analysis. Measurement results can be transmitted wirelessly or saved on removable memory card. Two hours continues acquisition is possible. Placement of the sensors, manner of placement the insole and measuring circuit on the shoe is presented on (Figure 1).

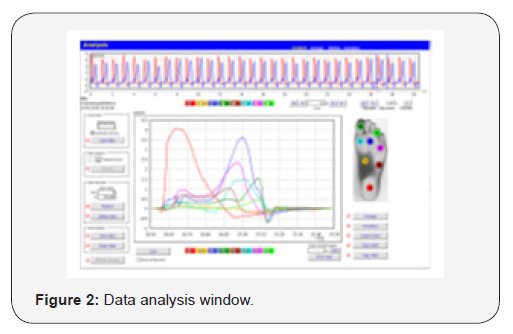
The insole measuring uses 8 piezoelectric sensors, distributed in foot regions as defined by Blomgren and Lorkowski [5-8]. The data analysis window is shown on (Figure 2).

Top waveform presents forces recorded for sensors located under the heel and metatarsal. The developed software for visualization and data analysis is user friendly. Top chart (RECORD) shows data set chosen by user to analyze. It is including the movable frame used for selecting certain part of graph which is zoomed in the main frame. Software interface can display and compare all 8 waveforms with possibility of enabling or disabling some of them.
The following data can be red:
• gait rhythm at selected measurement period,
• electric signal value for each individual transducer or for all sensors simultaneously at any moment of the foot to substrate interaction,
• foot to ground contact time,
• individual anatomical areas of foot to substrate contact time,
• average electric signal value calculated from loaded sequence,
• maximum and minimum electric signal value on the chosen sensor during examination related to an average value.
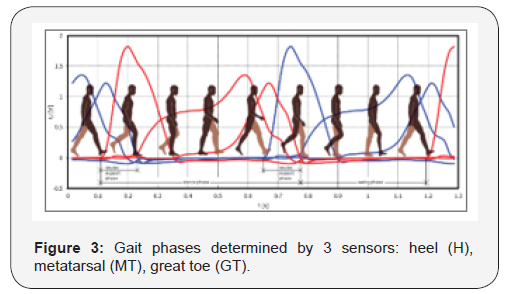
Additionally, we can determine following gait parts: double support, stance and swing phase illustrated on the Figure 3 where foot force pressure waveforms recorded by presented system are combined with human figure (Figure 3).

Basing on two feet pressure forces versus substrate (3 sensors of each foot registered: heel, metatarsal, big toe) gait percentile distribution was calculated:
• Stance phase (contact with the substrate) – 61% time of step
• Swing phase (no contact with the substrate) – 39% time of step
• Double support phase (two feet contact with the substrate) – 11% time of step

Figure 4 presents sample measurements of foot forces for healthy and flat foot. In case of the flat foot compared to the healthy foot it is clearly visible that the force pressure occurs at the point of MM (yellow signal) an increase at the point LM (maroon signal) (Figure 4).
Conclusion
Presented system for measuring foot forces versus ground is easily applicable and inexpensive. Force value on the individual sensor or group of sensors can be evaluated in percent against overall foot force [9] or energy generated on the individual sensor or group of sensors against overall generated energy during step can be given.
Acknowledgement
Many thanks to Andrzej Cichocki for help in performing laboratory tests. Project financed by “The National Centre of Research and Development”.
Conflicts of Interest
No conflicts of interest
References
- Mayich DJ, Novak A, Vena D, Daniels TR, Brodsky JW (2014) Gait analysis in orthopedic foot and ankle surgery-topical review, part 1, Principles and uses of gait analysis. Foot Ankle Int 35(1): 80–90.
- Novak AC, Mayich DJ, Perry SD, Daniels TR, Brodsky JW (2014) Gait analysis for foot and ankle surgeons-topical review, part 2: Approaches to multisegmented modeling of the foot. Foot Ankle Int 35(2): 178–19.
- Klimiec E, Piekarski J, Zaraska W, Jasiewicz B (2014) Electronic measurement system of foot plantar pressure. Microelectronics International 31(3): 229-34.
- Klimiec E, Zaraska W, Piekarski J, Jasiewicz B (2013) PVDF sensors – research on foot pressure distribution in dynamic conditions. Advances in Science and Technology 79: 94–99
- Laskowski J (2006) Methodology of pedobarographic examination – own experiences and review of literature. Przegl Lek 63(Suppl 5): 23–27.
- Lorkowski J, Zarzycki D (2006) Clinical use of pedobarographic examination – own experience and review of literature. Przegl Lek 63(Suppl. 5): 28–32.
- Blomgren M, Turan I, Agadir M, (1991) Gait analysis in hallux valgus. J Foot Surg 30(1): 70–71.
- Jasiewicz B, Klimiec E, Młotek M, Guzdek P, Duda S, et al. 2019) Quantitative Analysis of Foot Plantar Pressure During Walking. Med Sci Monit 25: 4916-4922.
-
Ewa Klimiec, Piotr Guzdek, Grzegorz Kolaszczyński, Barbara Jasiewicz, et al. Measurements of Foot Impact Versus Ground in Natural Environment Outside the Laboratory. Glob J Ortho Res. 2(2): 2020. GJOR.MS.ID.000532.
-
Foot force, Walk biomechanics, Gait phases, Foot Impact Versus, Natural environment, Biomechanics, Diagnosis, Piezoelectric sensors, Electronic circuit, Telemedicine
-

This work is licensed under a Creative Commons Attribution-NonCommercial 4.0 International License.


