

 Research Article
Use of Genetically Modified Canola Oil as a Replacement for Fish Oil in Practical Diets of Whiteleg Shrimp Litopeneaus vannamei Reared in Clear Water Conditions
Received Date: December 22, 2023 Published Date: December 03, 2024
Abstract
Transgenic canola oil has been created to naturally produce essential fatty acids (EFAs) needed for shrimp, namely DHA (Docosahexaenoic acid, C22:6n-3) and EPA (Eicosatetraenoic acid, C20:5n-3). This experiment was designed to evaluate the efficacy of genetically modified Latitude oil in shrimp diets. Treatments were designed with the goal of observing a depression in shrimp growth and FCR, indicating the level at which EFA requirements are not met [1-5]. Ten diets were formulated, including a series of fishmeal (FM) based diets, and a series of poultry meal (PM) based diets. Various levels of modified canola oil (MCO) were then used to replace fish oil (FO) on an is lipidic basis. Juvenile shrimp (average weight 0.22g) were cultured in an indoor recirculating aquaculture system for 7-weeks. A significant increase in FCR and depression in final weight of shrimp was seen after 90% replacement of FO with MCO in the PM-based diets. This suggests that diets above 90% replacement were nutritionally deficient in EFAs. Four diets were used to evaluate diet palatability, one with FM and FO, one with PM and FO, one with FM and MCO, and a final diet with PM and MCO. No significant differences were observed in feed consumption, indicating that all diet ingredients were equally palatable to the shrimp and that any depressions in growth were not due to consumption issues. Based on these results, MCO can be used as a primary replacement for MFO. However, DHA nutritional requirements appear to be considerably higher than previously reported values. Growth and feed conversions were depressed when DHA levels fell below 2.47% in test diets.
Introduction
Aquaculture has been the fastest growing sector for human food production for several decades, growing at an average rate of 8% annually since 1970 (Garlock et al. 2019). As technology and management practices have advanced, the industry has shifted from largely extensive farming to intensive and large-scale culture operations. One of the most expensive feed ingredients is fishmeal (FM) and its derivative, fish oil (FO). The market for FM is not able to expand, as it is produced by capture fisheries which are at near capacity, so alternative feed ingredients must be identified [6-9] FM has been successfully replaced in diets for many fish species, but aquatic feeds continue to rely on FO as a lipid source because of the high concentration of omega-3 long chain highly unsaturated fatty acids (LC-HUFA) like docosahexaenoic acid (DHA, 22:6n-3) and eicosapentaenoic acid (EPA, 20:5n- 3) (Asdari et al. 2011). For many species, terrestrial oil sources do not meet the nutritional requirement of highly unsaturated essential fatty acids (EFA) for shrimp like DHA and EPA. Canola oil is an attractive FO replacement, as it has increased in global production and is projected to continue increasing in the future [10-13]. Traditional canola oil does not produce DHA in high enough quantities to meet nutritional requirements, so it has been genetically manipulated to produce higher concentrations of LC-HUFA (Walsh et al. 2016). This oil (Latitude TM, Cargill) is a promising candidate for FO replacement in aquatic diets, and has been successfully used as a replacement in juvenile salmon research [14-17]. However, salmon are able to desaturate and chain elongate fatty acids, whereas shrimp are not (Perez-Velazquez and Lawrence 2004, Turchini and Francis 2009). The purpose of this study was to evaluate the growth performance of Pacific white shrimp cultured using diets with various replacement levels of FO with MCO, and to observe palatability differences between dietary protein and lipid sources.
Materials and Methods
System Setup
The growth trial was conducted at the E.W. Shell Fisheries Station (Auburn, AL USA) in an indoor recirculating aquaculture system consisting of 40 glass aquaria (50 x 50 x 50 cm) filled with 100 L of water with constant aeration, salinity of 6 ppt and temperature maintained near 28 °C. Shrimp were hand sorted to uniform size (0.22g) and randomly stocked into aquaria at 15 shrimp per tank. Shrimp were fed one of ten experimental diets, with each treatment being replicated four times [18-23].
Diet Preparation
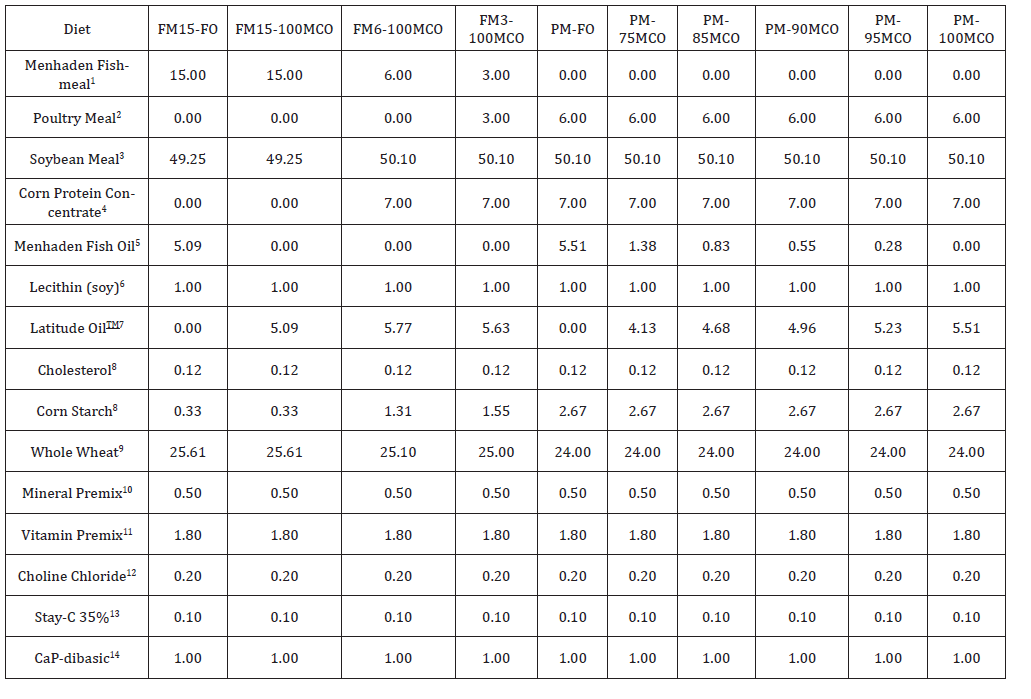
Diet formulations are presented in Table 1 A total of ten experimental diets were made for growth trials, including three FMbased diets and seven PM-based diets. All diets were formulated to contained 36% protein and 8% lipid. Soybean meal and corn protein concentrate were the primary plant-based protein sources, with FM and PM being the primary animal-based protein sources. FO was the primary lipid source, and was replaced at varying levels with Latitudes oil (Table 1). Pre-ground dry [24-27] ingredients and oil were weighed and mixed in a food mixer (Hobart Corporation, Troy, OH, USA) for 15 min. Boiling water (30-40% by weight) was then blended into the mixture to attain a consistency appropriate for pelleting. Finally, all diets were pressure-pelleted using a meat grinder with a 3-mm die, dried in a forced air oven (50°C) to a moisture content of less than 10% and stored at -30°C.
Table 1: Formulation of experimental diets used for clear water growth trial of juvenile shrimp (0.22g initial weight) and grown for 7 weeks. Ingredient sources are shown below the table. Values are reported as percentage of the diet. All diets were formulated to contain 36% protein and 8% lipid on an “as is” basis.
Water Quality and Management
The shrimp rearing system included a circulation pump, submersible heater, bead filter and fluidized bed biological filter for maintaining water quality. Dissolved oxygen, water temperature, pH and salinity were measured twice daily using a YSI multiparameter instrument (YSI, Yellow Springs, OH, USA). Total ammonia nitrogen and nitrite were analyzed twice per week using a YSI 9500 photometer (YSI, Yellow Springs, OH, USA).
Feed and Treatments
Commercial feed (Ziegler 50% protein, 15% fat) was fed to PL shrimp in a nursery system from arrival until system stocking. For the duration of the experiment, shrimp were fed one of ten experimental diets outlined in Table 1. Feeds were formulated using FM, PM, FO, and MCO (LatitudeTM, Cargill) as primary protein and lipid sources, respectively. Experimental diet codes were chosen for ease of identification. The first half of the code, either FM or PM indicates the dietary animal protein source. Because we used multiple levels of FM in our experimental diets, there is a number following FM which indicates the level at which it was included. We only used one level of PM when used as the primary animal protein source, 6, so there is no number following PM. The letters following the hyphen in the diet codes, FO or MCO, indicate the major lipid source. MCO was used in various levels, indicated by the number preceding the abbreviation. For example, 75MCO indicates that MCO was used for 75% of the supplemental lipid source. FO does not have numbers preceding the acronym; if FO is present, there was no other supplemental lipid used. The first four diets included a basal diet with 15% FM and 5.1% FO (FM15-FO) followed by three diets with the FO replaced by MCO but containing 15, 6 and 3% FM (FM15-100MCO, FM6-100MCO; FM3-100MCO). Thus, allowing for the evaluation of the effects of FM, and the oil it contains, in combination with MCO. The second series of diets were PM based, and had various levels of FO replacement with MCO (75-100%) with a goal to determine the acceptable replacement ratio with no other source (except MFO and MCO) of DHA [28, 29]. These diets were intentionally formulated to observe nutritional deficiencies, so we would be able to predict the replacement value of MCO level more closely. Feed inputs were based on a preprogramed standard feeding protocol that assumes shrimp double their weight until reaching 0.8g, then gain 0.8g per week for the remainder of the trial and have an expected FCR of 1.8.
Termination
Shrimp in each tank were captured, counted and group weighed to calculate survival, biomass, mean weight, FCR and weight gain. After weighing and counting, shrimp was frozen t for future lipid profile analysis.
Fatty Acid Analysis
Fatty acids were extracted from feeds and body samples at Auburn University and sent to Cargill for analysis of the fatty acid profile. Shrimp samples were stored at -80°C, and thawed directly before analyzing. Frozen shrimp samples were thawed and three shrimp from each tank were pooled into a representative sample and homogenized. From each sample of shrimp body and diets, two random sub-samples were taken with a weight of 2g/each from shrimp whole body, and an approximate weight of 0.6g per sub-sample of feed. These sub-samples were extracted using the methods of Folch et al. (1957). In short, weighed tissue or feed was homogenized using a Polytron homogenizer in 20 mL of chloroform/ methanol (2:1) for 1.5 minutes. The homogenate was filtered through a sintered glass filter covered with a glass microfiber filter paper into a screw cap test tube. The residue was re-extracted with 14 mL of chloroform/methanol (2:1) with a Polytron homogenizer for 1.5 minutes and again filtered through the sintered glass filter into the screw cap test tube. Then, the screw cap test tube filled with the filtrate was brought to 40 mL volume with chloroform/ methanol (2:1). To this, 8 mL distilled water was added and flushed with nitrogen, then the test tube was capped and inverted to mix. This was stored in a refrigerator (dark) overnight to allow phases to separate. The upper phase was then removed with a pipette and the lower phase washed with fresh upper phase (chloroform: methanol: water 3:48:47) three times by gently allowing it to flow down the side of the test tube. A minimum amount of methanol was added to make one phase. Then, 0.5 g sodium sulfate was added, and the solution decanted to a dried pre-weighed test tube. The chloroform was evaporated using a heated water bath and stream of nitrogen gas, the tubes were then dried and weighed. The percent (%) lipid was then calculated (on a dry weight basis). After the extractions, oils from sub-samples were transferred to 2 mL vials, dried by the nitrogen evaporator, and flushed with nitrogen gas. The samples were stored at -80C in an ultra-freezer and sent to Cargill’s oil division laboratory, Colorado, USA for fatty acid composition analysis. The fatty acid compositions of the samples were analyzed by gas chromatography (GC) method. Total lipid content was expressed as percent of wet tissue or dry diet. First, the extracted oil samples from shrimp or diets were suspended by 500 uL of isooctane with 100 ppm butylated hydroxytoluene (BHT). Second, 100 uL of the suspended sample was added to a 15mL polypropylene conical tube, along with 1mL of isooctane and 100 uL of 1N potassium hydroxide in methanol. Then, samples were vortexed at 3000 rpm for 30 seconds and centrifuged at 3000rpm for 5 mins. Five-hundred microliter of supernatant (isooctane layer) was removed and added to a GC vial and crimp capped. Then, all samples were analyzed using an Agilent 7890B with a Flame Ionization Detector. Retention time confirmation was induced by using Nu-Check GLC566 FAME Standard. BHT peak was removed from chromatograms of samples prior to analysis. Individual fatty acid methyl esters (FAMEs) were calculated as % of total peak area.
Palatability of diets
The system was prepared by hand sorting shrimp to uniform size (mean weight 5.38g) and stocking 15 shrimp per tank into a series of 40 glass aquaria (40 total, n=10). Shrimp were fed one of four experimental diets, FM15-FO, FM15-MCO, PM-FO, and PM-100MCO (Table 1). Shrimp were acclimated to the experimental diets for two days prior to collecting data. To determine diet palatability, each tank was given two grams of experimental feed weighed on a dry weight basis at 8am, and leftover feed was collected after allowing shrimp 30 minutes to consume the feed. Feed was siphoned from the bottom of the tank onto a coffee filter, which was then dried in an oven at 100°C overnight and weighed on a 4-decimal scale. Feed and empty coffee filters were weighed in order to calculate the amount of dry feed leftover after the consumption period. Each treatment was replicated ten times daily, for two days, leading to twenty observations per treatment.
Statistical Analysis
Data was subjected to a two-way analysis of variance (ANOVA) using SAS (V9.4, SAS Institute, Cary, NC, USA) to determine differences in survival (%), mean initial weight, final biomass, biomass gain, final mean weight, weight gain, percent weight gain, weekly gain, feed offered, feed conversion ratio, and feed conversion ratio based on shrimp biomass. Student-Newman-Keuls multiple range test was performed on the data to determine differences in the means between treatments.
Results
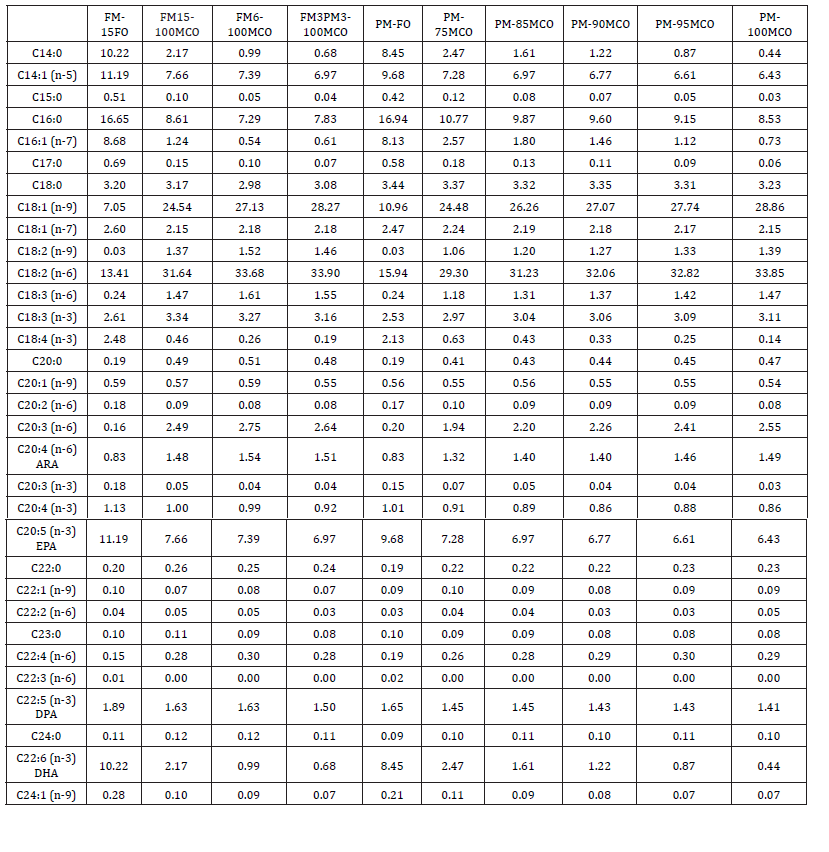
Water quality parameters were acceptable for growth and typical for this type of system (Table 2). Growth performance and survival results are presented in Table 3. There were no significant differences in survival, ranging from 83.3-95% (P=0.641). Growth results indicated that at the end of the culture period, the basal diet (FM15-FO) had significantly higher shrimp biomass (67.03g/ tank) (P<0.0001) than the full replacement diet (36.85 g/tank). Shrimp individual gain was observed to decrease as FO inclusion decreased, with slight increases seen when FM was included in diets FM6-100MCO and FM3-100MCO. Furthermore, there were no significant differences seen in shrimp final weight between the FM15-FO diet and PM-FO. FM15-FO also had the most desirable FCR (1.78) compared to the highest FCR observed in shrimp fed the full replacement diet PM-100MCO (3.26). Palatability results are presented in Table 4. Results indicate that there were no differences in shrimp consumption (p=0.5414) between the four diets that were observed (FM15-FO; FM15-100MCO; PM-FO & PM- 100MCO). Fatty acid profile results from shrimp whole body tissue are presented in Table 5. Percentage of DHA ranged from 2.04-10.83 (p=0.8173), with FM15FO having the highest concentration, and PM100MCO having the lowest. The relationship between DHA % of the oil in experimental diets and shrimp final weight is presented in Figure 1. DPA ranged from 1.55-2.23 (p=0.8832), with the full FO diets (FM100FO, PM100FO) having the lowest amounts, and diet FM3PM3100MCO having the highest levels. EPA ranged from 9.97-13.19 (p=0.4027), with PM75MCO having the lowest, and FM15FO having the highest. There were no significant differences in these oil concentrations between treatments. ARA levels ranged from 1.88-3.34 (p=0.6642), with PM100FO having the lowest, and PM100MCO having the highest. Fatty acid analysis of experimental diets revealed that, generally, n-3 fatty acids decreased, and n-6 fatty acids increased as supplementation of MCO increased (Table 6). As was expected, diet PM100MCO had the lowest n-3 fatty acid concentration and highest n-6 concentration. Particularly, DHA was highest in FM100FO (10.22) and lowest in PM100MCO (0.44). Concentrations of n3, n6, and other fatty acids are modeled in Figure 6. The n3/n6 ratio in whole shrimp samples were also not found to be significant, ranging from 0.31-1.98 (p=0.7285). The highest n3/n6 ratio was seen in the basal diet (FM-FO), with a ratio of 1.98, and the lowest was seen in PM100MCO with a ratio of 0.31. The n3/n6 ratio decreased as FO inclusion decreased, with slight increases evident when FM was included.
Table 2: Water quality parameters throughout the culture period of juvenile shrimp (0.22g initial weight) stocked at 15 shrimp per tank and grown for 7 weeks in a clear-water system.

Table 3:Growth performance results of juvenile shrimp (0.22g initial weight) stocked at 15 shrimp per tank and grown for 7 weeks in a clear-water system. Letters denote statistical differences between pairwise comparisons (P<0.05)
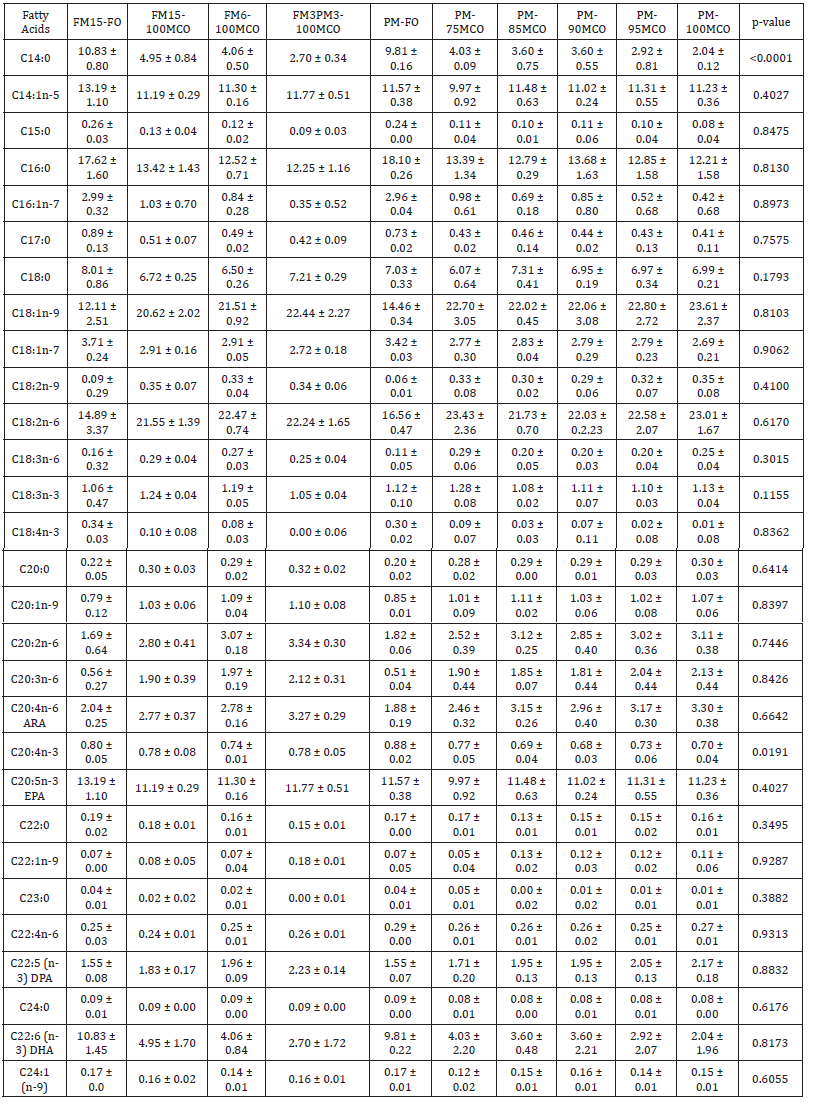
Table 4: Palatability results of juvenile shrimp (5.38g weight) stocked at 15 shrimp per tank and given 30 minutes to consume feed that was offered

Table 5: Fatty acid profile (%) of lipids extracted from whole shrimp after being reared on various test diets containing various levels of MCO and PM as replacements for FO and FM, respectively. Results are presented as mean ± SE.

Table 6: Fatty acid profile (%) of experimental feeds offered to juvenile shrimp (initial weight 0.22g) cultured for 7 weeks in a clear water recirculating aquaculture system with various replacement levels of MFO and MFM with MCO and PM, respectively. Results are presented as mean ± SE.
Discussion
al. 2008). FM accounts for 15-25% of many feed formulations representing about 40% of total feed costs (Borski et al. 2011). This means that one way to make shrimp farming more cost efficient is to find acceptable FM replacements for shrimp diets, including FO replacement options, being that FO is derived from FM. While FM has been successfully replaced in shrimp diets (Cheng et al. 2002), replacing FO has been more problematic due to limited choices. This is because shrimp have a dietary requirement for LCPUFA, and are not able to synthesize these fatty acids from dietary sources (Perez-Velazquez and Lawrence 2004). Presently, FO is the primary source of LC-PUFA in aquaculture diets, making it both a limiting and expensive ingredient [30, 31]. In previous experiments with MCO obtained from research varieties of MCO, growth was significantly depressed when FO was completely removed from shrimp diets and substituted with either standard canola oil or MCO (Gia Vo et al. 2021b). They identified a probable deficiency of DHA but did not identify the maximum level of inclusions of MCO. Presently, commercial lines of MCO have been produced and oil is becoming available on the market. Hence there is a need to evaluate these oils and to identify maximum levels of replacement in feed formulations. For the current work, FO was substituted with Latitude TM MCO at various levels in order to determine how much of the oil is able to be substituted in shrimp diets without sacrificing animal growth.

There are many factors that could be responsible for poor growth and feed conversion seen in the shrimp growth trial. These include the dietary protein source, lipid source, attractability, palatability, and vitamin deficiencies. When final weights of shrimp fed FM diets were compared, a significant decrease in final weights were observed (Figure 2). This suggests that removal of FM and the subsequent shift in nutrients could be responsible for poor growth performance of shrimp. A significant decrease was also seen in shrimp final weights when PM diets were compared corresponding to decreases in the concentration of FO (Figure 3). However, there were no significant differences in the final weight of shrimp offered diets utilizing FM or PM as the protein source with FO as the lipid supplement. This indicates that growth differences were not due to the basal protein source and were instead related to the level and type of lipids. This is supported by other work that used nonmarine protein sources in combination with FO (Amaya et al. 2007) as well as alternative sources of HUFA such as algae meals (Kristy et al. 2019). Cholesterol is a required nutrient for shrimp (Gong et al. 2000) and is naturally found in FO, so as FO was removed from the diet, cholesterol levels would also decrease. Hence, cholesterol was supplemented at 0.12% in order to eliminate cholesterol as a growth limiting factor. FO is also a good source of vitamins which were supplemented equally across diet formulations, eliminating vitamin deficiencies as a factor that could be limiting shrimp growth performance.


Another possibility is that marine oils are considered attractants and could influence feed consumption. Results from the palatability trial indicate that there were no issues in at tractability as there were no significant differences in consumption between dietary treatments (Table 4). Palatability results of our study contrast with Cruz-Suárez et al. (2007), which found significant differences in consumption when shrimp were offered diets with various levels of replacement of FM with a PM blend. The shifts in palatability of the feeds were not apparent and also do not seem to be responsible for the differences in shrimp growth response. Higher feed conversion ratios and lower final weights observed in shrimp that were fed diets with low or no inclusion of FO, specifically diet PM-95MCO and PM-100MCO, indicate that these diets did not meet the dietary requirement of LC-HUFA for shrimp growth. This is similar to previous research with this oil, finding that full replacement led to nutritional deficiencies, while partial replacement (up to 75%) was successful (Gia Vo et al. 2021b). This result was not observed in a tandem green water trial (Weldon et al. 2021), which replaced up to 95% of dietary fish oil. We speculate that this is due to consumption of algae and other native food sources found in green water systems. These native foods may have contained enough DHA to supplement the pelleted feeds offered and avoid nutritional deficiencies and the resulting growth depression. In previous research with plant oils such as soybean oil and rapeseed oil, substitution levels have been limited as the Pacific white shrimp have dietary requirements for DHA and EPA. EPA and DHA are recommended to be at least 0.5% of the lipid (Gonzalez-Felix et al. 2003a). In that experiment, diets had a lower total lipid content (5%) than formulations used for this research (8%). Basal protein sources were also processed to remove trace lipids, meaning that all of the lipids in the diets were supplemental. In contrast, the present work utilized practical ingredients which have background lipid levels and contribute to the total diet lipid content. Some previous research has suggested that ARA is a concern in shrimp diets (Araújo et al. 2020). However, ARA levels increased in diets as MCO inclusion increased, which indicates that ARA is not limiting. The relationship between ARA concentration in experimental feeds and shrimp growth response is modeled in Figure 4. Thus, ARA does not appear to limit growth in this experiment, which agrees with other studies, suggesting that when present in shrimp diets, DHA is limiting rather than ARA (Glencross 2009). EPA is considered a growth limiting EFA for shrimp, but being that inclusion levels in this experiment were well over the nutritional requirement (0.5% of lipid profile) it likely did not limit shrimp performance.
The relationship between EPA and shrimp final weight is modeled in Figure 5 with the lowest concentration of EPA in experimental feeds being 6.43% in PM-100MCO. Furthermore, EPA concentrations in FM15-100MCO and FM6-100MCO were very similar, having 7.66% and 7.39% respectively, but had significantly different growth responses with final weights being 4.08g and 3.23g, respectively. DPA is not considered an essential fatty acid for shrimp growth, but is typically evaluated alongside the essential fatty acids being that it is known to be a precursor in DHA metabolism and play a role in immune function (Simon 2015). The relationship between DPA concentration in experimental feeds and shrimp final weights is graphically presented in Figure 6. Though there does seem to be some relationship between DPA concentration and shrimp weight, DPA is not recognized as an EFA for shrimp growth, and was eliminated as a growth limiting factor. In diets that contained very similar levels of DPA, the growth response was significantly different, meaning that another fatty acid must be responsible. In diets FM15-100MCO and FM6-100MCO, concentrations of DPA were the same at 1.63%, but final weights were different at 4.08g and 3.23g, respectively. DHA is most commonly recognized as the EFA of the most concern when lipid sources are exchanged (Feng et al. 2020). We found a strong relationship between DHA inclusion levels and shrimp growth response, with shrimp fed the highest levels (10.22% and 8.45%) having the highest final weights at 4.78g and 4.67g, respectively. This relationship between DHA concentration in the feed and shrimp final weight is presented graphically in Figure 7. Based on the green water trial, we speculate that these diets were very close to meeting their nutritional needs, as the shrimp in the green water trial did not experience this growth depression. This could be due to consumption of algae and other aquatic organisms present in green water systems that contain DHA. Fatty acid analysis of the experimental diets used for this trial (Table 6) show that PM100MCO was below the recommended DHA level, with a value of 0.44 and would be expected to be marginally deficient, yet diets with higher DHA levels also had poor growth. Figure 8 demonstrates the logarithmic relationship between feed DHA levels and shrimp final weight, showing that there is a relationship between DHA in the feed and shrimp final weights. This analysis was also performed on DPA, ARA, and EPA, but a strong correlation was not observed. This indicates that DHA is the limiting EFA, as expected. Diets PM90MCO and PM95MCO had DHA values of 0.99 and 0.87, respectively, and demonstrated significantly depressed growth values, indicating that the nutritional requirement may be higher than previously predicted. Based on Figure 8 the nutritional requirement may be closer to 2% as that is where the slope appears to change, and higher levels lead to diminishing returns in terms of growth. Attempts were made to statistically model the DHA requirement, but this experiment did not yield a wide enough range to make these models successful. More research with a wider range of DHA levels is necessary in order to effectively model the DHA requirement. Samocha et al. (2010) found that shrimp were able to be fed diets with marine oils completely replaced, as long as fermented products were added to the diet to provide a source of LC-HUFA, specifically ARA and DHA. Similarly, Soller et al. (2017) reported that shrimp could be fed diets with complete replacement of marine ingredients, with use of genetically modified products or fermented products as an EFA source. In general, fatty acid levels in feeds correlated to the level that was found in whole body tissue (Figure 1) with diet PM100MCO having the lowest dietary and tissue levels of DHA. The n3/n6 ratio decrease that was observed in test diets as MCO supplementation increased was also observed in shrimp tissue. This is similar to observations of Gonzalez-Felix et al. (2003a), which found that increases in LC-HUFA in diets led to a corresponding increase in LC-HUFA in shrimp tissues. Though this relationship between feed and tissue levels of fatty acids has been well established, Browdy et al. (2007) concluded that the ratio of n3/n6 fatty acids did not affect shrimp production efficiency. Tissue levels of LC-HUFA like DHA were higher than the levels of the same fatty acids in experimental diets, which agrees with the results from Araujo et al. (2019). Lim et al. (1997) suggests that shrimp fed diets higher in n3 fatty acids resulted in better growth. The lowest n3/ n6 ratio was seen in the PM100MCO diet compared to the basal diet with a ratio of 1.97. Gonzalez-Felix et al. (2009) noted that the n3/n6 ratio plays a role in shrimp growth, but it is unclear how it affects growth and survival, with supplementation of ARA and DHA being more effective at promoting shrimp growth. Because of this, it is unlikely that n3/n6 ratio is responsible for poor growth and performance with high MCO inclusion.
In Gonzalez-Felix et al. (2003b), the dietary requirement for EPA and DHA were determined to be 0.5% of the lipid content of the diet. However, that experiment did not test the requirement using practical protein sources, which contribute to the lipid profile, instead extracting oils from protein sources so all oil in the feeds were supplemental. In our experiment, basal protein sources contributed about 50% of the lipid profile, which had a dilution effect on the fatty acid profile of the MCO which contained 0.61% DHA. This suggests that under experimental conditions, the nutritional requirement may be 0.5% of the lipid profile, but under practical conditions the requirement must be higher to account for dilution of the oil profile by native oil sources in protein ingredients. Our results suggest that the nutritional requirement for DHA under practical conditions is closer to 2% of the lipid profile. After 2% inclusion, shrimp had significantly higher final weights, but growth returns were diminishing. Broken line regression analysis was applied to the combined dataset of this trial and that of (Gia Vo et al. 2021), using DHA level and thermal growth coefficient (TGC) to estimate the DHA nutritional requirement. Results indicated that the breakpoint of the line, and the approximated nutritional requirement of DHA, was around 1.9% of the lipid profile. This is much higher than previous approximations, and explains the poor growth of shrimp at DHA levels below 2%. This is important to consider when evaluating the efficacy of FO replacement strategies, because the efficacy of replacement depends on the matrix of the diet and DHA levels after diet formulation. When formulating a feed, the goal is to deliver a specific level of nutrients. In this case, the level of DHA in the basal ingredients (such as FM) as well as the level of lipids influence substitution strategies. FM contains approximately 3% lipid in the form of FO, which contributes to the DHA profile of the diets in which it is used. Conversely, PM contains approximately 2.5% lipid but does not contain DHA. Hence, when a diet has FM as a basal ingredient, less DHA is required in supplemental oils to meet nutritional requirements, and a diet with PM as the basal ingredient will require more DHA in supplemental oils. For example, FM- 100MCO performed much better than PM-based diets with lower replacement levels of MCO. Conversely, when FM was removed, MCO was only able to be used at a replacement level of 75% before growth performance was severely affected. It is difficult to report replacement value based on percentage of FO that can be replaced, as the amount differs with basal ingredient contribution to the lipid profile. This emphasizes the importance of the diet matrix on the use of this product, as protein source contributes to the lipid profile, so it can be used at high levels as long as the nutritional requirement for DHA is met.


Conclusion
Results from this growth trial indicate that MCO is an effective replacement for FO in practical shrimp diets, as long as the DHA requirement is met. The basal diet and PM100FO performed the best in terms of growth, which was expected because those diets contained full levels of FO. In FM free diets, from 75%-90% replacement of FO with MCO, shrimp growth was significantly lower than the two aforementioned diets, but was still somewhat acceptable. After 90% replacement in these diets, however, animal growth was significantly depressed and feed conversion increased significantly. This result indicated that growth was stunted due to a nutritional EFA deficiency, likely DHA. The feed palatability experiment did not indicate any significant differences in shrimp consumption, or at tractability between diet ingredients, meaning that the decrease in growth and feed conversion must be due to nutritional factors. Our results indicate that the nutritional requirement for DHA is higher than previously determined (0.5%) and is instead closer to 2% because of dilution of the oil profile from background oil sources in practical feed formulations. Additional research with this product is warranted to further confirm results and determine the DHA requirement under more practical conditions. More research should also be done to explore other options for FM and FO free diets, such as diets which include fermented products as an EFA source when FO is removed.
Acknowledgements
The authors would like to express our gratitude to those who have reviewed this manuscript and the students and staff who participated in this project from Auburn University and Claude Peteet Mariculture Center. We would also like to extend special thanks to the Global Edible Oil Solutions team at Cargill for providing the experimental oil and analyzing extracted oil samples. This work was supported in part by the Alabama Agricultural Station and the Hatch program (ALA016-1-19102) of the National Institute of Food and Agriculture, U.S. Department of Agriculture and was partly funded by Cargill, Minneapolis, MN, USA. The mention of trademarks and proprietary products does not constitute endorsement by Auburn University and is not intended to exclude other products or services that may be suitable.
References
- Amaya EA, Davis DA, Rouse DB (2007) Replacement of fish meal in practical diets for the Pacific white shrimp (Litopenaeus vannamei) reared under pond conditions Aquaculture 262: 393-401.
- Araujo BC, Antonio Mata-Sotres J, Teresa Vian M, Tinajero A, Braga A (2019) Fish oil-free diets for Pacific white shrimp Litopenaeus vannamei: The effects of DHA-EPA supplementation on juvenile growth performance and muscle fatty acid profile Aquaculture pp.511.
- Araújo BC, Flores-Galvez K, Honji RM, Barbosa VM, Viana MT, et al. (2020) Arachidonic acid effects on the overall performance fatty acid profile hepatopancreas morphology and lipid-relevant genes in Litopenaeus vannamei juveniles Aquaculture pp.523.
- Asdari R, Aliyu‐Paiko M, Hashim R, Ramachandran S (2011) Effects of different dietary lipid sources in the diet for Pangasius hypophthalmus (Sauvage 1878) juvenile on growth performance nutrient utilization body indices and muscle and liver fatty acid composition Aquaculture Nutrition 17: 44-53.
- Borski RJ, Bolivar RB, Jimenez EBT, Sayco RMV, Arueza RLB, et al. (2011) Fishmeal-free diets improve the cost effectiveness of culturing Nile tilapia (Oreochromis niloticus L) in ponds under an alternate day feeding strategy pp.111-118.
- Browdy C, Seaborn G, Atwood H, Davis DA, Bullis RA, et al. (2007) Comparison of Pond Production Efficiency Fatty Acid Profiles and Contaminants in Litopenaeus vannamei Fed Organic Plant-based and Fish-meal-based Diets Journal of the World Aquaculture Society 37: 437–451.
- Cheng ZJ, Behnke KC, Dominy WG (2002) Effects of poultry by-product meal as a substitute for fish meal in diets on growth and body composition of juvenile Pacific white shrimp Litopenaeus vannamei Journal of Applied Aquaculture 12: 71-83.
- Cruz-Suárez LE, Nieto-López M, Guajardo-Barbosa C, Tapia-Salazar M, Scholz U, et al. (2007) Replacement of fish meal with poultry by-product meal in practical diets for Litopenaeus vannamei and digestibility of the tested ingredients and diets Aquaculture 272: 466-476.
- Davis DA, Roy LA, Sookying D (2008) Improving the cost effectiveness of shrimp feeds in L E Cruz-Suárez D Ricque-Marie M Tapia-Salazar M G Nieto-López D A Villarreal-Cavazos J P Lazo & T Viana editors Avances en Nutricion Acuicola IX Simposio Internacional de Nutricion Acuicola Monterrey Nuevo León México p 24-27
- Feng ZF, Dong WX, Bu F, Zhu W (2020) Influence of dietary n-3 polyunsaturated fatty acids (PUFAs) on growth PUFA composition and the expression of FAD6 and ELOV5 in pacific white shrimp (Litopenaeus vannamei) Aquaculture Research 52: 1666-1676.
- Folch J, Lees M, Sloane Stanley G (1957) A simple method for the isolation and purification of total lipids from animal tissues Journal of Biological Chemistry 226: 497-509.
- Garlock T, Asche F, Anderson J, Bjørndal T, Kumar G, et al. (2019) A Global Blue Revolution: Aquaculture Growth Across Regions Species and Countries Reviews in Fisheries Science and Aquaculture 28: 107-116.
- Gia Vo LL, Galkanda‐Arachchige HSC, Iassonova DR, Davis DA (2021b) Efficacy of modified canola oil to replace fish oil in practical diets of Pacific white shrimp Litopenaeusvannamei Aquaculture Research 52: 2446-2459.
- Glencross BD (2009) Exploring the nutritional demand for essential fatty acids by aquaculture species Reviews in Aquaculture 1: 71-124.
- Gong H, Lawrence AL, Jiang D-H Castille FL, Gatlin DM (2000) Lipid nutrition of juvenile Litopenaeus vannamei: I Dietary cholesterol and de-oiled soy lecithin requirements and their interaction Aquaculture 190: 305-324.
- Gonzalez-Felix ML, Gatlin DM, Lawrence AL, Perez-Velazquez M (2003a) Nutritional evaluation of fatty acids for the open thelycum shrimp Litopenaeus vannamei: II Effect of dietary n-3 and n-6 polyunsaturated and highly unsaturated fatty acids on juvenile shrimp growth survival and fatty acid composition Aquaculture Nutrition 9: 115-122.
- Gonzalez-Felix ML, Lawrence AL, Gatlin DM, Perez-Velazquez M (2003b) Nutritional evaluation of fatty acids for the open thelycum shrimp Litopenaeus vannamei: I Effect of dietary linoleic and linolenic acids at different concentrations and ratios on juvenile shrimp growth survival and fatty acid composition Aquaculture Nutrition 9: 105-113.
- Gonzalez-Felix ML, Perez-Velazquez M, Quintero-Alvarez JM, Davis DA (2009) Effect of various dietary levels of docosahexaenoic and arachidonic acids and different n-3/n-6 ratios on biological performance of Pacific white shrimp Litopenaeus vannamei raised in low salinity Journal of the World Aquaculture Society 40: 194-206.
- Iassonova DR, Arriagada P, Capdeville A (2018) An alternative source of long chain Omega-3 fatty acids from Novel Canola oil for salmonid farming Feeding trial report 18th International Symposium on Fish Nutrition and Feeding las Palmas de Gran Canaria Spain.
- Iassonova DR, Arriagada P (2020) Performance evaluation of plant-based source of long chain Omega-3 fatty acids for growing aquaculture industry Aquaculture America Honolulu Hawaii.
- Kristy MA, Habte-Michael HT, Kenneth RT, Keith F, James HT, et al. (2019) Freshwater microalgae (Schizochytrium sp) as a substitute to fish oil for shrimp feed Scientific Reports 9: 1-10.
- Lim C, Ako H, Brown CL, Hahn K (1997) Growth response and fatty acid composition of juvenile Penaeus vannamei fed different sources of dietary lipid Aquaculture 151: 143-153.
- Perez-Velazquez M, Lawrence A (2004) Advances in triglyceride fatty acid nutrition in penaeid shrimp Global Aquaculture Advocate Global Aquaculture Alliance.
- Rosillo-Calle F, Pelkmans L, Walter A (2009) A global overview of vegetable oils with reference to biodiesel A report for the IEA Bioenergy Task 40.
- Ruyter B, Sissener NH, Østbye T-K, Simon CJ, Krasnov A, et al. (2019) n -3 Canola oil effectively replaces fish oil as a new safe dietary source of DHA in feed for juvenile Atlantic salmon British Journal of Nutrition 122: 1329-1345.
- Samocha TM, Patnaik S, Davis DA, Bullis RA, Browdy CL (2010) Use of commercial fermentation products as a highly unsaturated fatty acid source in practical diets for the Pacific white shrimp Litopenaeus vannamei Aquaculture Research 41: 961-967.
- Dyall SC (2015) Long-chain omega-3 fatty acids and the brain: A review of the independent and shared effects of EPA DPA and DHA Frontiers in Aging Neuroscience 7:52.
- Soller F, Rhodes MA, Davis DA (2017) Replacement of fish oil with alternative lipid sources in plant-based practical feed formulations for marine shrimp (Litopenaeus vannamei) reared in outdoor ponds and tanks Aquaculture Nutrition 23: 63-75.
- Turchini GM, Francis DS (2009) Fatty acid metabolism (desaturation elongation and beta-oxidation) in rainbow trout fed fish oil- or linseed oil-based diets British Journal of Nutrition 102: 69-81.
- Walsh TA, Bevan SA, Gachotte DJ, Larsen CM, Moskal WA, et al. (2016) Canola engineered with a microalgal polyketide synthase-like system produces oil enriched in docosahexaenoic acid Nature Biotechnology 34: 881-887.
- Weldon A, Davis DA, Roy LA, Morey A (2021) Use of Metabolically Modified Canola Oil as a Replacement for Fish Oil in Practical Diets of Pacific White Shrimp Litopeneaus vannamei (Accession No aul5938006) [Master’s thesis Auburn University] Auburn University Library Catalog.
-

This work is licensed under a Creative Commons Attribution-NonCommercial 4.0 International License.