 Mini Review
The Impact of Food Consumption Pattern on Women’s Health at Sana’a Governorate, Yemen
Muhammed AK Al Mansoob1* and Muhammed SA Masood2
1Faculty of Science, Sana’a University, Yemen
2Faculty of Education and Language, Amran University, Yemen
Muhammed SA Masood, Faculty of Education and Language, Amran University, Yemen.
Received Date: April 10, 2019; Published Date: August 13, 2019
Abstract
This research was aimed at studying the impact of food consumption pattern (FCP) via the Household Dietary Diversity Scores and Women Dietary Diversity Scores and also Households incomeon the malnutrition status of women (MUAC) in the two zones, Sana’a Dry (SD) that represents the rural part and Sana’a Temperate (ST) that represents the urban part of Sana’a Governorate, Yemen. The investigation based on data that extracted from a comprehensive survey conducted by UNICEF during 2016 with a total sample of 1396 women in the reproductive age 15-49 years from the two zones SD and ST. The prevalence of middle upper arm circumference (MUAC) in SD’s women is about 2.4 more than the ST’s women. The relationship between income quintiles and MUAC in the two zones is highly significance (P-Value <0.001). Based on the income data of HHs, and the exchange rate of 2016, it was found that 85.5% of HHs are living on less than 1US$ per capita/day. While MUAC rates are the highest among women consuming cereals, miscellaneous, oils, sugar honey and diary in the SD zone, they are sugar honey, diary, oils and legumes in the ST zone. Only when meat, fruits, eggs and seafood came into the FCP of women, MUAC rates have been reduced significantly in both zones. New thresholds for both HDDS and WDDS that based on the mean number of food groups consumed (FGC) were suggested and lead to more realistic results.
Keywords:FCP; FGC; HDDS; WDDS; Income quintiles; Sanaa Governorate
Introduction
It is well known that all health-related issues are on the hands of the social and economic structures of any society. So, changing these structures first is the corner stone for making life prospects more dignified, healthier and acceptable. The maternal mortality and morbidity are positively related to the inadequate maternal nutrition. This inadequacy could lead to increasing the preterm births and fetal growth retardation among the exposed women [1]. In most of the developing countries, malnutrition continues to be the most important health burden. In fact, it is the most important risk factor for illness and death of millions of pregnant women and young children globally [2]. Zahan argues that women’s health cannot be understood without existing a full definition of health related to women’s role and position in society and more particularly in the context of family [3].
Food security of households can be addressed in either able to produce their own food or able to purchase it and in both cases, income is the main burden. This is the reason behind considering malnutrition as a direct consequence of poverty and lack of economic resources [4]. Good nutrition is also vital on enhancing healthy life, education and productivity of people [5]. The most acceptable definition to household food insecurity stated that “a household (HH) is considered food insecure if it has a limited or uncertain physical and economic access to secure sufficient quantities of nutritionally adequate and safe foods in socially acceptable ways to allow HH members to sustain active and a healthy living” [6- 12]. Yet, in Yemen no research has been performed to assess the relationship between household food security and nutritional status of women either nationally or on a governorate level.
Due to the war that is running since March 2015, poverty, household food insecurity and malnutrition have become prevalent problems in Yemen [13]. The last human development report 2018 issued by UNDP Yemen has indicated that the country ranks 172 amongst 188 nations on the Human Development Index (HDI) [14]. The HDI of females in this country is 0.223 which is very low comparing to males (0.524). The life expectancy of women is 66.3 years and the Maternal Mortality Ratio is 385 per 100,000 live births. Yemen’s Gross National Income (GNI) per capita was $2229 by the end of 2015 and declined to reach $1239 in 2017 which is about 44.4% loss in two years’ time [14]. The State of Security and Nutrition in the World 2018 Report has stated that 34.4% of the total population of Yemen is undernourishment [15]. Along with the UN prospects, it also indicates that the prevalence of anemia among the Yemeni women of reproductive age (15-49) is 69.9% by 2016 [15, 16].These statistics are to show how life in Yemen has been enormously deteriorated, and as we crossing the midyear of 2019, surely these statistics are expected to be much worse.
Both the quantity and quality of food are important to assess household food security. The quantity can be assessed by the adequacy of its energy and protein [17]. For the present assessment, our focus is on the quality rather than the quantity of food. Fortunately, FAO has developed a simple tool to assess the quality of household food consumption called Household Dietary Diversity Score (HDDS) [18]. HDDS is a population-level indicator and is defined as the number of food groups consumed by a HH over a given period of time [19]. Its importance is coming from the fact that it brings a deep insight into HHs’ living standards including their capabilities to access food [18,20].
Availability, access and utilization are known as the food security components. Food access-in particular- describes how HHs are able to obtain enough food that meet the necessary nutritional needs of all their members. In a performance reporting context, FANTA is suggesting two options to deal with the critical value of HDDS. The first option depends on using the DD (Dietary Diversity) patterns of the wealthier HHs (the richest 33%) as a target and the second option is to establishing a target using the average DD of the 33% of HHs with the highest diversity [18]. None of these two options will be used in the present work and instead other threshold will be presented and examined.
In a previous work, we were investigating the relationship between Food Consumption Pattern (FCP) and its impact on the nutritional status of 6-59 months children in Sana’a Governorate, Yemen [21]. Later, another question was raised; how FCP affects other members of the HHs? More precisely, how FCP affects women’s health? So, the objective of the present study is to investigate the association between FCP represented by HDDS, WDDS and MUAC measures in a sample of women in the reproductive age 15-49 years in two ecological zones of Sana’a Governorate, Yemen; namely SD and ST. Fortunately, the data collection process involved measuring MUAC to the sampled women.
Materials and Methods
Study design, sampling and data collection process
Data of the present investigation were extracted from a comprehensive survey done by UNICIF Yemen during May 21st to June 2nd, 2016 as part of other surveys planned to cover all the Yemeni governorates. The survey was a cross-sectional study with a representative sample of women in the reproductive age 15-49 years. The survey was conducted in the two ecological zones of Sana’a Governorate, the ST and the SD. 11 districts were composing the ST, Jehanah, Al Teyal, Khawlan, BaniMatar, Hamdan, Arhab, BaniHoshaish, Nehm, Bilad Al Roos, Sanhan&BaniBahlul and Al Hesn, while only 5 districts were composing the SD, BaniDhabian, Al Haymah Al Dakheliah, Sa’fan, Manakhah and Al Haymah Al Kharijiah. All unsafe zones have been excluded from the frame before the selection of clusters. A two-staged cluster cross sectional study was conducted. The methods used, including sampling design and sample size determination were following SMART approach [22]. The sample size calculated for the ST was higher in the anthropometry than in mortality, while for SD, it was higher in mortality than in anthropometry. The calculated sample sizes of women in the two strata of ST and SD were 786 and 610 respectively [22]. The survey has taken place in 30 clusters in each stratum. The number of households in each cluster was calculated as 15 households in both ST and SD. The source of the sample frame used in this survey was taken from Sana’a Governorate Health Office. The frame contains a list of villages with a projection of population that is made based on the of the CSO (Central Statistical Organization) 2004 Census [23].
The survey population consisted of:
1. anthropometry: children aged 6 to 59 months
2. mortality: all people that have lived at the household (currently residing, left, born or died) over a set recall period
3. women anthropometry: women 15-49 years. The data collection was completed over a 12 days period.
Definitions
Women’s Health Measures
Data of women 15-49 years were entered, calculated and analyzed using ENA for SMART software. Classifying of malnutrition levels of Women [24-27]
MUAC GAM <23cm = Global Acute Malnutrition Prevalence Rates
MUAC GAM ≥ 2cm = Normal
MUAC: 21cm<= MUAC<23 cm = (MAM) Global Moderate Malnutrition Prevalence Rates
MUAC: MUAC<21 cm = (SAM) Global severe Malnutrition Prevalence Rates
MUAC ≥ 23cm = Normal
Undernourishment (Malnutrition)
Undernourishment is defined as the condition in which an individual’s habitual food consumption is insufficient to provide the amount of dietary energy required to maintain a normal, active, healthy life [15].
HDDS and WDDS
Dietary diversity scores are calculated by summing the number of food groups consumed in the household or by the individual respondent over the 24-hour recall period. The HDDS and WDDS Citation: Muhammed AK Al Mansoob, Muhammed SA Masood. The Impact of Food Consumption Pattern on Women’s Health at Sana’a Governorate, Yemen Glob J Nutri Food Sci. 2(2): 2019. GJNFS.MS.ID.000535. DOI: 10.33552/GJNFS.2019.02.000535. Global Journal of Nutrition & Food Science Volume 2-Issue 2 Page 3 of 8 are calculated based upon different numbers of food groups because the scores are used for different purposes. The HDDS is meant to provide an indication of household economic access to food, thus items that require household resources to obtain, such as condiments, sugar and sugary foods, and beverages, are included in the score. Individual scores are meant to reflect the nutritional quality of the diet. The WDDS reflects the probability of micronutrient adequacy of the diet and therefore food groups included in the score are tailored towards this purpose [18,20].
Twelve food groups are proposed for the HDDS, while nine food groups are proposed for the WDDS [18,20]. The food groups used to calculate HDDS are:
• Cereals
• White tubers and roots
• Vegetables
• Fruits
• Meats
• Eggs
• Fish and other seafood
• Legumes, nuts and seeds
• Milk and milk products
• Oils and fats
• Sweets (Sugar Honey)
• Miscellaneous (Spices, condiments and beverages)
The food groups used to calculate WDDS are:
• Starchy staples (Cereals and white roots and tubers)
• Dark green leafy vegetables
• Other vitamin A rich fruit and vegetables and red palm oil• Other fruits and vegetables (other fruit and other vegetables)
• Organ meat
• Meat and fish
• Eggs• Legumes, nuts and seeds
• Milk and milk products
DD based on HDDS
(will be referred as the original categorization of HDDS) categorized into three categories, i.e., low if consumption was <=3 various of food, moderate if consumption was 4-5 various of food and high if consumption was >=6 various of food [17,18].
DD based on WDDS
(will be referred as the original categorization of WDDS) categorized into three categories, i.e., low if consumption was <=3 various of food, moderate if consumption was 4-5 various of food and high if consumption was >=6 various of food [18].
FCP: Food consumption pattern that the people used to eat without specifying the food group
Statistical analysis
Data analysis was done using Excel, ENA and SPSS (version 24.0). Some descriptive statistics including frequencies and percentages were produced for the assigned variables. Chi-square test was used to assess the relationships among the categorical variables whenever necessary. Significance was defined as (P<0.05).
Results and Discussion
Food groups consumed (FGC), Income quintiles and MUAC
According to the food groups classification of HDDS, (Table 1) indicates that oil, sugar honey, diary, cereals and miscellaneous are the most consumed among the women of this governorate. Clearly, the FCP tends to depend mainly on the less nutrient food items. Factually and due to many factors, the health status of peoples varies from one zone to another and even within a country’s regions. So, when the FCP was recalculated for each zone separately, two similar patterns were emerged. While there are some similarities in some food items (oils, sugar honey, diary and vegetables) in the two zones, the consumption percentages of the more nutrient food items are in favor of the ST zone (Table 2). In other words, ST’s women are having better or healthier FCP
Table 1: Percentages of the FGC by all women.
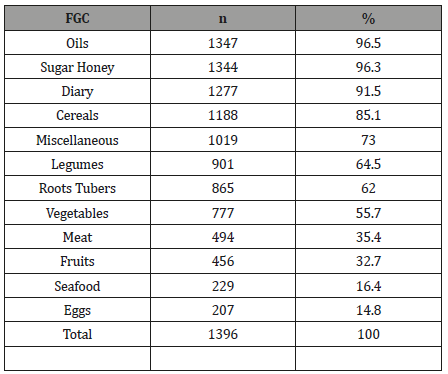
Table 2: FGC by zone.
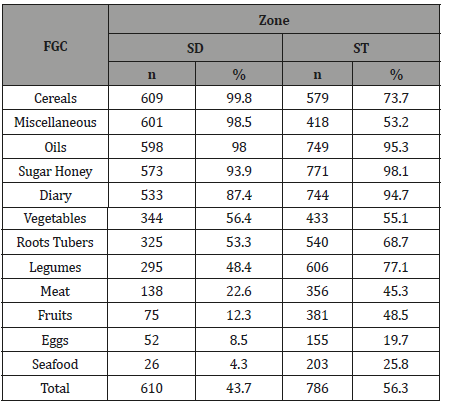
Table 3: Income quintiles by zone: *YR: Yemeni Rial.
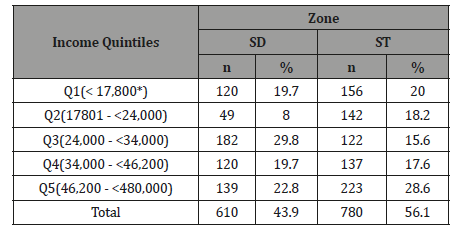
There are some pros and cons in living in urban zones. Accessibility to education, healthcare, clean water, sanitation and better economic opportunities are among the positive impacts, while crime, low physical activity and poor dietary habits are among the negative impacts [28]. To examine the contribution of income level in creating these patterns, (Table 3) shows the income quintiles of the HHs in the two zones. From which, income distribution seems similar in the two zones with slight improvement in ST zone and more specifically in Q5. Similar results were reported in many other studies [2,29,30]. The exchange rate of 2016 (data gathering date) was 300YR = 1US$ [31]. So, converting the income quintiles distribution into US$ and taking into consideration the number of HH’s members results in (Table 4).
Table 4: Income quintiles by zone: *YR: Yemeni Rial.
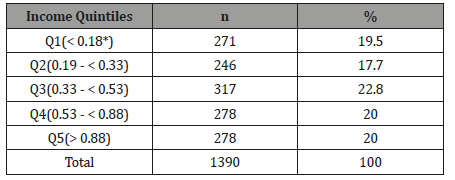
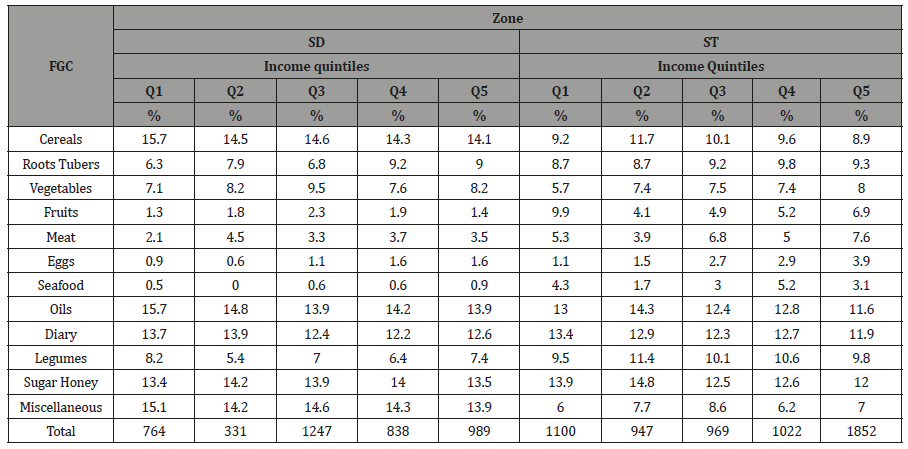
Further calculations revealed that only 202 women (14.5%) out of the sample are having more than or equal 1US$ per day, or in other words 85.5%of them are living on less than 1US$ a day. To elaborate more, FGC was compared with the income quintiles in the two zones (Table 5). As known, the fruits, meat, eggs and seafood groups are normally more expensive than the other food groups. Therefore, and despite of the income quintiles similarities, ST’s women are having the chance to consume more nutrient food groups. Such situation is very much clear when income quintiles were compared with MUAC in each zone (Table 6).
Table 5: FGC, income quintiles and zone.
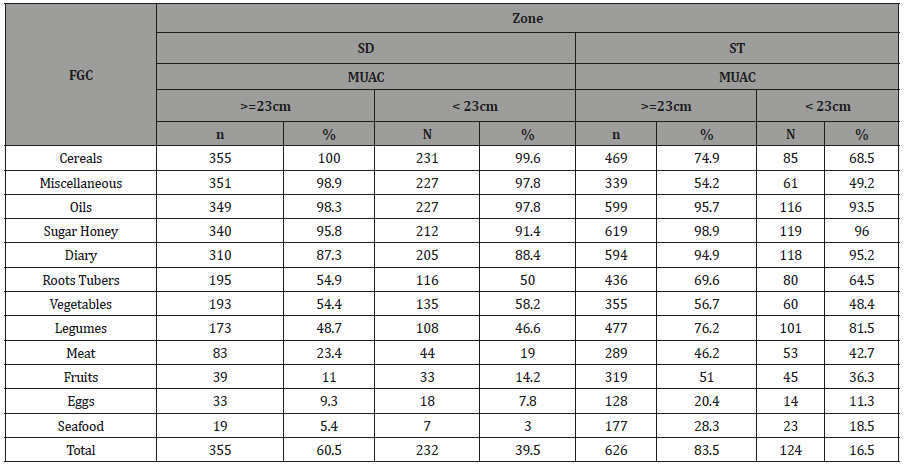
In Table 6, the malnutrition rate is 40.1% in the SD zone comparing to only 16.5% in the ST zone. The table also shows no significant association between income quintiles and MUAC. However, by separating the MUAC affected women in the two zones, the association was found highly significant. This result is crucial as it proves how the slight difference improvement in income plays a significant role in improving the women’s health and definitely all members of the HHs. In (Table 7), a comparison between the FGC with MUAC according to zone is presented. Many important points can be drawn: 1) 39.5% and 16.5% of the SD’s women and ST’s women are malnourished respectively; i.e. malnutrition among the SD’s women exceeds the double of ST’s women (the slight difference in the malnutrition rates is due to some missing values). 2) MUAC rates are the highest among women consuming cereals, miscellaneous, oils, sugar honey and diary in the SD zone. 3) MUAC rates are the highest among women consuming sugar honey, diary, oils and legumes in the ST zone. 4) The common FGC between the two zones are oils, sugar honey and diary. 5) Only when the last four groups (meat, fruits, eggs and seafood) were entered into the consumption pattern, MUAC rates have been reduced significantly in both zones.
Table 6: Income quintiles, zone and MUAC: *YR.
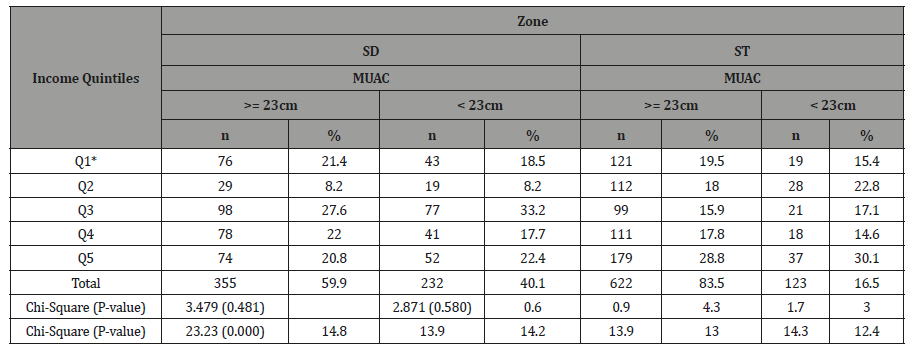
Table 7: Distribution of FGC by zone and MUAC.
HDDS, WDDS, Income quintiles and MUACWhile the individual dietary diversity score (IDDS) is used as a proxy measure of the nutritional quality of an individual diet, the HDDS is used as a proxy measure of the socio-economic level of the HH [18]. The distributions of HDDS and WDDS are shown on (Table 8), where the minimum is two with HDDS and one in WDDS. Both distributions look normally distributed with mean 7.24 and standard deviation 1.83 for HDDS and 5.09 and standard deviation 1.97 for WDDS. Now, and due to the ongoing conflict and economic crisis, Yemen is the largest food security emergency in the world. Nearly 16 million people-approximately 53 percent of Yemen’s population-face Crisis (IPC 3) or worse conditions countrywide, according to the Integrated Food Security Phase Classification (IPC). In other words, the IPC analysis has declared that from December 2018 to January 2019, a total of 15.9 million people, i.e., 53% of the population analyzed are severely food insecure [32, 33]. (Table 9), shows the HDDS and WDDS categories by zone. Clearly, in the HDDS classification (categorization), only 1.3 of women in the two zones is consuming less than four food groups. On the other side, in WDDS categories those women consuming less than four food groups are 30.6% and 15.3% in SD and ST respectively. Therefore, using this categorization under the ongoing circumstances is unrealistic and we suggest using the mean number of FGC as a cut-off instead.
Table 8: The distributions of HDDS and WDDS by zone with some descriptive statistics.
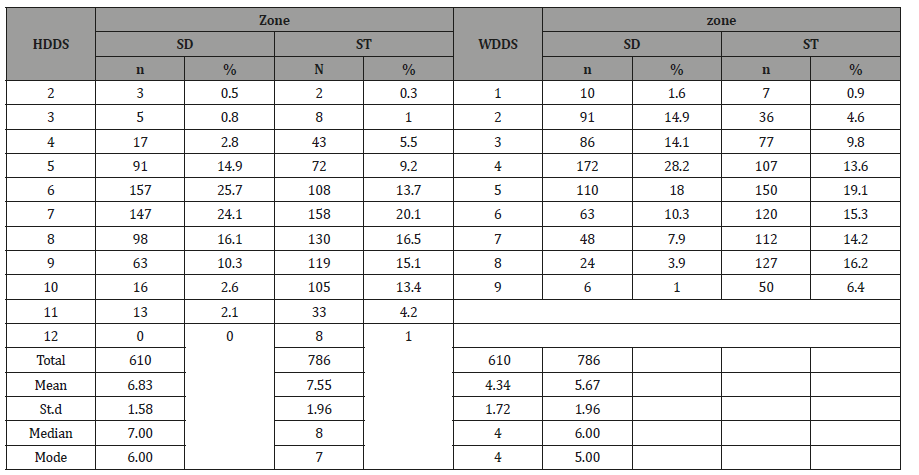
Table 9: HDDS and WDDS by zone.
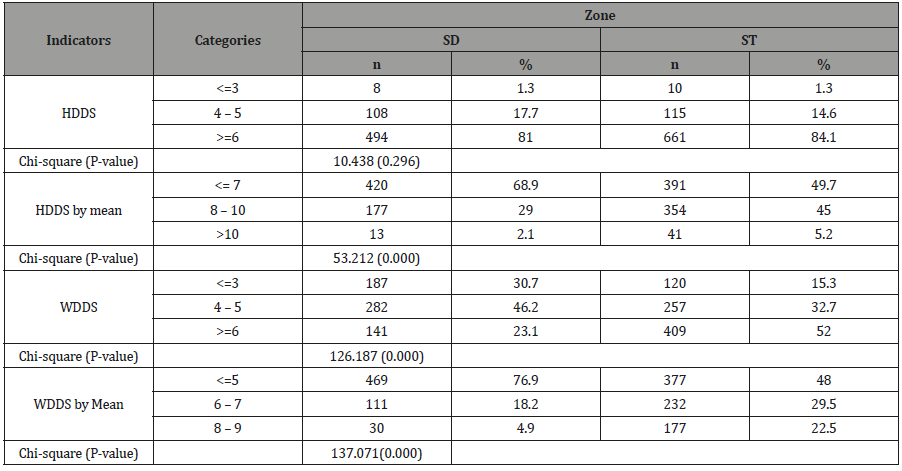
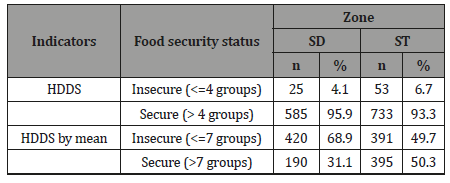
Comparing the results of using the ordinary categorization with the suggested one (Table 9), reveals immediately how using the mean of the FGC as a threshold is giving more realistic figures for both HDDS and WDDS. Furthermore, only the association between HDDS original categorization and zone was insignificant. It is known that no universal cut-off level that indicates whether HH food is sufficiently diverse or not. However, a critical value of 4 was widely used to categorize the target population into foodsecure and food-insecure [18,29,34]. In (Table 10), with minimal mathematics one can realizes easily that only 5.6% of the sample is food-insecure while using the mean as a threshold showed 58.1% which is close to the ICP estimation [33].
Table 10: HDDS, food security status by zone.
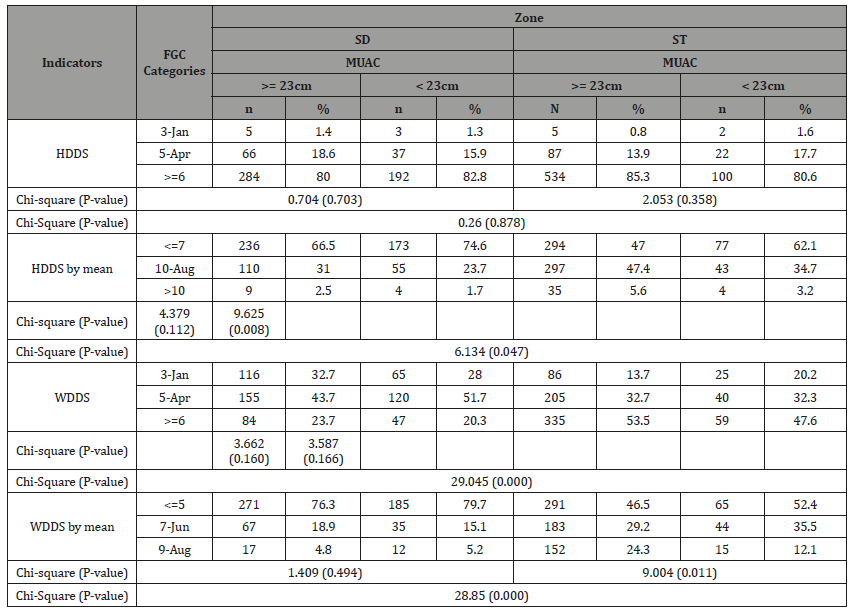
In (Table 11), the prevalence rates of MUAC are compared with the original HDDS and WDDS categories and also with the suggested categorization for both zones. Many important points can be noticed: 1) Using the original HDDS categories revealed that only 1.3% of women consuming less than 4 food groups are MUAC affected, 2) The original categorization give an impression that the more food groups consumed, the more women MUAC affected that has no rationale base, 3) The suggested categorization, gives an opposite impression that the more food groups consumed the less women MUAC affected which is more rationale, 4) Only with the new suggested categorization, the relationship between MUAC and both HDDS and WDDS are significant in ST zone, 5) Based on zone, MUAC is highly associated with the new categorization of HDDS and both the original and the new categorization of WDDS.
Table 11:HDDS, WDDS, FGC categories, zone and MUAC.
Conclusion
Any population or a community has its own way of dieting and it may differ from one place to another. So, any food study should take the habitual dieting into consideration before any further analysis. In the present research, it has been found that even inside one governorate, there are some differences in the habitual dieting between the two zones SD and ST. So, using international measures to describe the FCP of any nation or community is almost irrational and cannot be free of errors.
This research was aimed at studying the impact of food consumption pattern (FCP) via the Household Dietary Diversity Scores and Women Dietary Diversity Scores and also the Households’ income on the malnutrition status of women (MUAC) in the two zones, Sana’a Dry (SD) that represents the rural part and Sana’a Temperate (ST) that represents the urban part of Sana’a Governorate, Yemen. The investigation based on data that extracted from a comprehensive survey conducted by UNICEF during 2016 with a total sample of 1396 women in the reproductive age 15-49 years from the two zones SD and ST. The prevalence of MUAC in SD’s women is about 2.4 more than the ST’s women. The relationship between income quintiles and MUAC in the two zones is highly significance (P-Value <0.001). Based on the income data of HHs, and the exchange rate of 2016, it was found that 85.5% of HHs are living on less than 1US$ per capita /day. While MUAC rates are the highest among women consuming cereals, miscellaneous, oils, sugar honey and diary in the SD zone, they are sugar honey, diary, oils and legumes in the ST zone. Only when meat, fruits, eggs and seafood came into the FCP of women, MUAC rates have been reduced significantly in both zones.
The original categorization of HDDS and WDDS suggested by Swindale and Bilinsky, (2006) that is widely used to categorize the FGC as low, moderate and high was used in this study [13]. However, under this categorization, only 1.3% of women involved in the study were found to consume less than four food groups in both zones. Further, under the original categorization of WDDS, only 30.6% and 15.3% are consuming less than four food groups on SD and ST zones respectively.
Both the USAID and IPC organizations have declared that about 53% of the Yemeni population is severely food insecure. Even when the food security criterion (less than five food groups = food insecure) was introduced only 4.1% and 6.7% of women under HDDS were food insecure. So, using these original categorization thresholds in understanding the real situation of women’s dietetics in this governorate is not realistic. For such reason, thresholds based on the mean FGC are suggested for both HDDS and WDDS. These new thresholds have produced more realistic results that are comparable to the international estimates and appropriately portray the Yemen’s present situation. Based on the present research and results, any national or international interventions to help or improve the nutritional status of the peoples of this governorate, should focus on increasing the accessibility to the more nutrient food groups and more specifically the protein-based groups.
Acknowledgment
None.
Conflict of Interest
No conflict of interest.
References
- King JC (2003) The risk of maternal nutritional depletion and poor outcomes increases in early or closely spaced pregnancies. J Nutr 133(5 Suppl 2):1732S-1736S.
- Müller O, Krawinkel M (2005) Malnutrition and health in developing countries. CMAJ 173(3): 279-286.
- Zahan N (2014) Factors influencing women's reproductive health. ABC Journal of Advanced Research 3(2): 38-46.
- Begin F, Frongillo EA, Delisle H (1999) Caregiver behaviors and resources influence child height-for-age in rural Chad. J Nutr 129: 680-686.
- Ajao KO, Ojofeitimi EO, Adebayo AA, Fatusi AO, Afolabi OT (2010) Influence of Family Size, Household Food Security Status, and Child Care Practices on the Nutritional Status of Under-five Children in Ile-Ife, Nigeria. Afr J Reprod Health 14(4): 1-23.
- Humphries DL, Dearden KA, Crookston BT, Fernald LC, Stein AD, et al. (2015) Cross-Sectional and Longitudinal Associations between Household Food Security and Child Anthropometry at Ages 5 and 8 Years in Ethiopia, India, Peru, and Vietnam1-3. J Nutr 145(8): 1924-1933.
- Campbell CC (1991) Food insecurity: a nutritional outcome or a predictor variable? J Nutr 121(3): 408-415.
- Gillespie S, Haddad L (2001) "Attacking the double burden of malnutrition in Asia and the Pacific", ADB Nutrition and Development Series (4). Manila and Washington DC: Asian Development Bank (ADB) and International Food Policy Research Institute (IFPRI).
- Honfoga BG, Van Den Boom GJ (2003) Food-consumption patterns in central West Africa, 1961 to 2000, and challenges to combating malnutrition. Food Nutr Bull 24(2): 167-182.
- Bhattacharya J, Currie J, Haider S (2004) Poverty, food insecurity, and nutritional outcomes in children and adults. J Health Econ 23(4): 839-862.
- (2007) Health Reform Foundation of Nigeria, Child survival in Nigeria, Nigeria health review, 2006, HERFON, 50-58.
- Jones AD, Ngure FM, Pelto G, Young SL (2013) What are we assessing when we measure food security? A compendium and review of current metrics. Adv Nutr 4(5): 481-505.
- Von Grebmer K, Bernstein J, Hossain N, Brown T, Prasai N, et al. (2017) Global Hunger Index: The Inequalities of Hunger. Washington, DC: International Food Policy Research Institute; Bonn: Welthungerhilfe; and Dublin: Concern Worldwide.
- (2018) UNDP. Human Development Indices and Indicators 2018 statistical update.
- (2018) FAO, IFAD, UNICEF, WFP and WHO. The State of Food Security and Nutrition in the World 2018. Building climate resilience for food security and nutrition. Rome, FAO. Licence: CC BY-NC-SA 3.0 IGO.
- (2017) United Nations (UN). World Population Prospects 2017. New York, USA.
- Baliwati YF, Briawan D, Melani V (2015) Validation Household Dietary Diversity Score (HDDS) to Identify Food Insecure Households in Industrial Zone. Pak J Nutr 14 (4): 234-238.
- Swindale A, Bilinsky P (2006) Household dietary diversity score (HDDS) for measurement of household food access: indicator guide, Version 2. Food and Nutrition Technical Assistance Project, Academy for Educational Development, Washington, D.C.
- (2019) Household Dietary Diversity Score (HDDS).
- Kennedy G, Ballard T, Dop MC (2013) Guidelines for measuring household and individual dietary diversity. Nutrition and Consumer Protection Division, Food and Agriculture Organization of the United Nation, Italy.
- Al Mansoob MAK, Masood MSA (2018) Food consumption pattern and its impact on the nutritional status of 6-59 months' children in Sana'a Governorate, Yemen. American Journal of Food and Nutrition 6(2): 37-45.
- (2016) UNICEF. Nutrition Survey of Sana'a Governorate 2016, Final Report, Ministry of Public Health and Population, Primary Health Care Sector, Family Health General Directorate, Nutrition Department, Yemen.
- (2005) CSO (Central Statistical Organization), Population Projection Based on 2004 Census. Sana'a, Yemen.
- (1995) WHO. Physical status: the use and interpretation of anthropometry. Report of a WHO Expert Committee, WHO Technical Report Series No.854. World Health Organisation, Geneva, Europe.
- (2006) WHO Multicentre Growth Reference Study Group. WHO Child Growth Standards: Length/height-for-age, Weight-forage, Weight-for-length, Weight-for-height and Body mass index-for-age: Methods and Development, World Health Organization, Geneva, Europe.
- (2013) WHO. Guideline: Updates on the management of severe acute malnutrition in infants and children, World Health Organization, Geneva, Europe.
- (2014) AFC, UNICEF. Nutrition Survey using SMART Methodology for Typhoon Haiyan-affected zones of Regions VI, VII and VIII the Philippines.
- Janjua NZ, Mahmood B, Bhatti JA, Khan MI (2015) Association of household and Community Socioeconomic Position and Urbanicity with Underweight and Overweight among Women in Pakistan, PLOS ONE 10(4): e0122314.
- Babiker AA, Kabbar RF (2018) Use of Household Dietary Diversity Score (HDDS) in Measuring Food Security Status in Bindizi Locality of Central Darfur, Sudan, Africa.
- Bryce J, Coitinho D, Darnton Hill I, Pelletier D, Pinstrup Andersen P (2008) Maternal and child undernutrition: effective action at national level. Lancent 371(9611): 510-526.
- Yemen Economic Bulletin: How Multiple Exchange Rates Reduced Funds for Humanitarian Intervention.
- Food Assistance Fact Sheet-Yemen.
- Yemen: Acute Food Insecurity Situation December 2018-January 2019. Yemen's Food Insecurity Situation Remains Dire Despite Substantial Humanitarian Assistance.
- Steyn NP, Nel JH, Nantel G, Kennedy G, Labadarios D (2006) Food variety and dietary diversity scores in children: are they good indicators of dietary adequacy? Public Health Nutr 9(5): 644-650.
-
Muhammed AK Al Mansoob, Muhammed SA Masood. The Impact of Food Consumption Pattern on Women’s Health at Sana’a Governorate, Yemen Glob J Nutri Food Sci. 2(2): 2019. GJNFS.MS.ID.000535.
-
Food Consumption Pattern, Women's Health, Household Dietary Diversity Scores, Sana’a Dry, Meat, Fruits, Eggs, Seafood, Food Groups Consumed, Household Food Insecurity, Nutritionally Adequate, Safe Foods, Healthy Living, Household Food Security, Malnutrition, Quantity of Food
-

This work is licensed under a Creative Commons Attribution-NonCommercial 4.0 International License.


