


 Research Article
Beyond The Beans: A Statistical Analysis of Global Coffee Samples Input by Sensory Descriptive
Received Date: July 03, 2025 Published Date: August 05, 2025
Abstract
The coffee market is projected to reach approximately US$468.2 billion by 2024. Coffee farms are found on practically all continents, with Brazil being the world’s largest producer, accounting for approximately 60% of global coffee sales volume. Brazil boasts 35 distinct regions that certify, protect, and characterize their coffee based on specific aspects such as Sul de Minas, Mogiana, and Amazonia. Coffee pricing is determined by taste characteristics and is evaluated through sensory analysis, where human tasters assess the coffee using the sensory descriptive analysis. This protocol involves assigning scores. This complex system necessitates a large and dedicated workforce to evaluate samples from farms worldwide. This analysis aims to evaluate and compare the coffee sample scores from around the globe. By analyzing the scores and the characteristics of the sample, the data analysis, we can gain insights into coffee behavior and potentially identify statistically significant differences between samples.
Keywords:brewed coffee; sensory analysis; data science
Consumption Trends and Regional Diversity
The coffee market is a multi-billion-dollar industry every year, and consumption continues to rise year-over-year. This growth is partly driven by technological advancements in coffee farms, which have led to increased efficiency and improved post-harvest fruit quality. Brazil is a major player in the global coffee market, accounting for roughly 60% of global production. To illustrate the relationship between price and consumption in Brazil, a figure can be inserted below (Figure 1) [1,2].
Insert Figure 1 Here

The analysis examines the past ten years of data in the Brazilian coffee market. Interestingly, the data reveals an increase in coffee consumption using a two-period moving average, while price does not appear to impact this trend directly. This phenomenon may be attributed to two factors. Firstly, Brazilian cooperatives have observed that farms increasingly focus on sustainable forest management alongside technological advancements. These improvements may lead to higher-quality coffee beans, potentially driving consumption growth [3]. Secondly, the BSCA (Brazilian Specialty Coffee Association) designates 35 distinct coffee beangrowing regions in Brazil (Figure 2). Each region offers unique sensory qualities, potentially catering to a wider range of consumer preferences and contributing to increased overall consumption [4].
Insert Figure 2 Here

Comprehensive Sensory Evaluation Protocol for Assessing Coffee Quality
All coffee-growing regions are evaluated using the sensorial descriptive analysis. This method allows for the widespread availability of samples from various regions. The protocol involves evaluating 11 sensory attributes to determine the final score and profile of the brewed coffee [5]. These methods follow a specific sequence, regardless of the evaluated coffee type. Tasters undergo rigorous training to ensure consistency in scoring. The step-by-step described below (Figure 3) [6].
Insert Figure 3 Here

Compliance Statement
All methods employed in this study adhere to relevant national, international, and internal regulations. The data analyzed originated from the Coffee Quality Institute (CQI) via the Kaggle dataset platform (World of Data) in 2018. This dataset utilizes an open data commons license, ensuring data accessibility and trustworthiness as verified by the Open Knowledge Foundation.
Data preprocessing and processing
The dataset was downloaded and subsequently organized. We employed a Python script to perform initial exploration, including visualization of components, columns, and data attributes. Additionally, the script facilitated the removal of rows lacking values [7].
Data analysis methods
Correlation Analysis: A heatmap matrix was constructed using the pandas library to visualize correlations between identified attributes within the dataset.
Data Visualization and Organization: The Matplotlib library was used to organize data for generating all the graphics presented in this research, including visualizations by origin country [8].
Statistical Analysis: Descriptive analysis was performed on the green coffee bean samples to understand data distribution. Subsequently, one-way analysis of variance (ANOVA) and Tukey HSD (Honestly Significant Difference) test were conducted in Origin 2022 software (α = 0.05) to evaluate statistical relationships between results [9].
Analyzing the results with statistical treatment
Green Coffee Composition
A literature review revealed that green coffee beans contain approximately 228 different chemical compounds. Roasting these beans triggers the Maillard reaction and/or pyrolysis, leading to the formation of an additional 971 new chemical substances [10,11,12].
Sensory Evaluation and Data Acquisition
Sensory taste evaluation plays a crucial role in defining and analyzing the score for each attribute, ultimately determining the final score for a coffee sample. The data analyzed in this study originates from the Coffee Quality Institute (CQI) dataset, containing results from such evaluations.
Data Preprocessing and Characteristics
Following preprocessing and data organization, we identified 1338 unique samples within the dataset. These samples were categorized into two genera: Arabica (representing 2.13% of the dataset) and Conilon (representing 97.86%). The harvest years spanned from 2009 to 2018, with samples originating from 36 different regions worldwide. The most well-represented countries were Mexico (236 samples), Colombia (183 samples), Guatemala (181 samples), and Brazil (132 samples). Notably, the dataset included a total of 29 species within the two main genera.
Correlation Analysis and Heatmap
After compiling and analyzing the general characteristics of the dataset, we proceed to investigate the correlation between various attributes, including the score classification for each attribute, the final score, and altitude. A heatmap was constructed (Figure 4) to visualize the impact of these factors on one another.
Insert Figure 4 here

The heatmap results shown above indicate the strength of influence between attributes using a scale where 0 represents no influence and 1 represents strong influence. Based on this analysis, sweetness appears to have a minimal impact on the distinction between “very good” and “nasty” coffee within the dataset used in this study. The most significant factors influencing the overall score seem to be taste and equilibrium, while sweetness has the least impact [13]. To further explore the sensory test data and understand the influence of various attributes, we analyzed the impact of bean colour. The results, including the statistical significance, are presented in Figure 5.
Insert Figure 5 here

The Figure above depicts the data categorized by ben colour: green, blue-green, bluish-green, and unclassified (not shown). Interestingly, the final score appears to be relatively similar across all colour groups. Additionally, the standard deviation for each group hovers around 10 points, with the overall score ranging from approximately 83 to 84 points. To determine if there are statistically significant differences between the groups, we employed descriptive analysis. The results of this analysis are presented in Table 1.
Insert Table 1 here
Table 1: The results of the Tukey test the splitting groups per color and the mean results of the samples.

At a significance level of 0.05 (alpha = 0.05), the statistical analysis reveals no significant difference between the population means for the final score across the different bean colour groups. Therefore, we can infer that colour does not statistically impact the final score based on the data analyzed. Another frequently discussed attribute in the coffee market is the harvesting and processing method. The dataset categorizes these methods into six groups: Natural/Dry, Pulped Natural/Honey, Semi-washed/ semi-pulped, washed/wet, others, and Unclassified (blank). Figure 6 presents the final score distribution across all harvest methods, without differentiating by genus, species, or country of origin. This allows us to observe the overall trends in the final score associated with different harvesting methods within the dataset.
Insert figure 6 here

It is indicated that the point has an approximate score for post-harvest methods, and all the types stay around 80-85 points, depending on sample size, and have some outlier points. To increase the interpretation and the impact on the score composition were organized by post-harvest means and organized into groups with each method stay (Table 2).
Insert Table 2 here
Table 2: The harvest methods of the green coffee beans, with Tukey methods to apply with mean value and groups

The range of all samples was between 80-85 points, regardless of the post-harvest method. It is possible to understand that the general score is not influenced by the applied method. After the application of the Tukey test determined that all types of harvest stay in the sample group, in other words, there was no statistical difference. However, washed and naturally dried methods present the biggest outlier components in their group, and this is possible to impact the precise analysis. Continuous describe the variable in process, and organize the final score per altitude harvest, here have all the genera, species, countries, and harvest methods. To show was to make the graphic split into 11 groups, to organize the range to create the group, and to create the possibilities to make the statistical description, in Figure 7.
Insert figure 7 here

Not having the biggest difference in the final score is not after splitting and separating by group, and visually demonstrating similarities itself. To verify the statistical similarity and/or difference, organize the results in the Table 3.
Insert Table 3 here
Table 3: The samples of the green coffee beans with the Tukey test and the groups A, B, and C were generated after the test.

It is possible to create 3 groups; we have the statistical difference; however, the dataset indicates the strong complexity, and the intersection implies the data has a range of values for more than one group. The altitude range 1001-1500 and blank belong in the same group (C) and do not have an intersection with groups A and B, is possible to infer that there is a statistical significance. To continuously analyze and comprehend the interference with the taste and the capacity of the sensorial evaluation, for it is plotted the final score per country, as shown in Figure 8.
Insert figure 8 here

Conducted a one-way ANOVA to compare the means of three groups. The ANOVA results yielded an F-statistic of 95% with a p-value of 0.05, which suggests a statistically significant difference (p<0.05) in means across the groups. Following up with the Tukey test and generated seven groups split into A, B, C, D, E, F, and G, organized in Table 4
Insert Table 4 here
Table 4: Tukey test to analyze the countries’ samples and the grouping into 7 types of have statistical differences
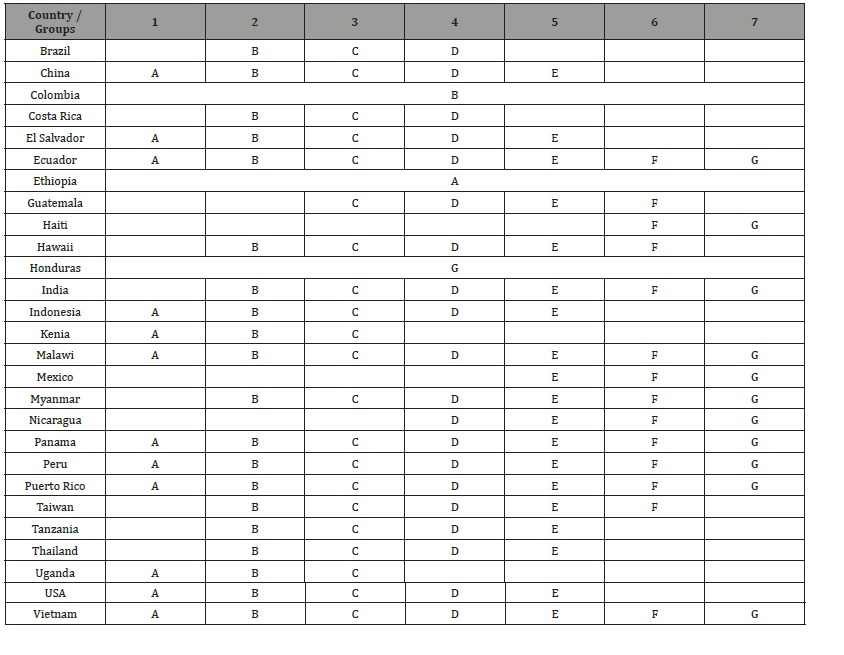
Firstly, to verify the dataset presented in this research, verify is not possible to apply the statistical components in all countries, because the data is a single value; these data drop out of the de basic dataset before applying the descriptive statistical analysis. Sensorial brewing coffee is a complex matrix, the fact that is present in the fats, carbohydrates, proteins, sugars, and phenols in most variable types and concentrations. The literature describes that around 900 compounds are present in green coffee beans [14].
A second point is that when roasting, these compounds undergo the Mallard and/or Pyrolysis process, the initial chemical compounds undergo cleavage, and generation of new compounds improves the initial number of chemical compounds in the coffee beans. The descriptive analysis started with 27 different countries and generated 7 statistical groups in this sample. Colombia is only group B, Ethiopia is a group A, and Honduras is in group G. All the other samples are presented in more groups, for example, Brazil is groups B, C, and D. In this dataset, the coffee does not have a distinction between itself, and no statistical difference when comparing these groups. The Brazil and India, for example, statistically, the sample values do not have significance; however, the farms are not present on the same continents. To better understand these results were the shape of each country per score and the quantified uncertainty associated with the estimated value, this is the standard error (SE), and the result shown in Figure 9.
Insert figure 9 here

Standard Error (SE) estimates the variability of a statistic, typically the mean, across different samples you could draw from the same population. Essentially, it tells you where to repeat the sampling process multiple times. Thus, the length of the standard error (SE) bar indicates the spread or variability of the data points around the mean within a particular group. Groups with a short SE bar suggest that the data points in that group are tightly clustered around the mean, signifying a high degree of reliability in the estimated mean.
On the other hand, long SE bars imply the data points are more scattered, indicating a less reliable estimate of the mean. The true population mean might be further away from the estimated mean we see on the plot for countries present in all groups, such as Ecuador, Malawi, Panama, Peru, Puerto Rico, and Vietnam. However, to evaluate the biggest sample sizes in this dataset, such as Brazil, Colombia, Guatemala, and Mexico, have results, that the estimated means are close to the true population means.
For this purpose, applying the standard deviation (SD) is appropriate. This statistic originates from the specific sample you have in hand and reflects the spread of the data points within that sample relative to its meaning. In other words, SD is a statistical measure that quantifies the spread or dispersion of data points around their mean. For comparison, the results were plotted in the Figure 10.
Insert figure 10 here

The high standard deviation (SD) indicates that the data points are widely scattered around the mean, while a low SD suggests they are clustered closer together. In the context of error, a high SD in these measurements signifies a lot of variation within your single sample set. Practically, all the groups amplify the minimum and maximum bars range. Honduras shows the most significant increase, with 22 units added to both the minimum and maximum values. The samples of Brazil, Colombia, and Guatemala have a range that is 6 units larger for both the minimum and maximum values. In simpler terms, SD is about the spread within one group of data, while SE is about the spread of the average value (mean) across different groups drawn from the same population.
Conclusion
Currently, the analysis of brewed coffee beans relies on sensory testing, evaluating 11 attributes, and generating a score for each aspect, with the human element being the critical control point. Analyzing the dataset to describe coffee beans from around 38 countries, categorized into two groups (Conilon and Arabica), our basic analysis reveals limitations in separating the specific aspects of attributes present in each sample. The current analysis approach leads to the inclusion of separate groups based solely on the final score by country or any attribute present in the supply chain. In conclusion, the current state of coffee quality analysis worldwide seems to be heavily reliant on the human element in specific regions. The data suggests that it is impossible to integrate all samples into the same database and separate them based on various factors. The literature currently shows that alternative methods and recent results for describing coffee-producing regions offer quantitative differences and propose new techniques for applying optical and analytical tools with more efficiency [15, 16,17, 18].
References
- TELES CRA, BEHRENS JH (2020) The waves of coffee and the emergence of the new brazilian consumer. Coffee Consumption and Industry Stategies in Brazil. Campinas: Woodhead Publishing pp. 257-274.
- VIECELI L. https://www1.folha.uol.com.br/mercado/2022/02/precos-do-cafe-sobem-mais-de-50-e-alteram-consumo-do-brasileiro.shtml. Folha de São Paulo. [Online] 02 21, 2022.
- Forbes. [Online] 4,6,2022. https://forbes.com.br/forbesagro/2022/04/consumo-de-cafe-no-brasil-cresce-17-em-2021/.
- BSCA- Cafés Especiais do Brasil. https://brazilcoffeenation.com.br/variety/show/id/9.
- protocols, SCAA Sensorial protocol.http://coffeetraveler.net/wp-content/files/901-SCAA_CuppingProtocols_TSC_DocV_RevDec08_Portuguese.pdf. [Online] November 2008.
- SANTOS, https://medium.com/data-hackers/estat%C3%ADstica-para-sele%C3%A7%C3%A3o-de-atribut os-81bdc274dd2c. Data Hackers. [Online] 2023.
- DELF, https://www.delftstack.com/pt/thowto/seaborn/correlation-heatplot-seaborn-python/. DELF STACK. [Online] 11 20, 2021.
- AGNOLETTI, BZ al, et. (2022) Multivariate calibration applied to study of volatile predictors of arabica coffee quality.
- PARLIMENT T H (2000) An Overview of coffee Roasting. American Chemical Society.
- RUOSI R (2021) A Further tool to monitor the coffee roasting process: Aroma Composition and Chemical Indices. Agricultural and Food Chemistry.BATLES W, MEVISSEN L (2022) Volatile reaction products from the reaction of phenylalanine
- glucose during cooking and roasting. Original Beiten.
- AHMAD, Raise, DALZIEL, Julie EG (2020) protein-coupled receptors in taste physiology and pharmacology. pp. 11: 587664.
- DULSAT-SERRA N, QUINTANILLA-CASAS B, VICHI S (2016) Volatile thiols in coffee: A review on their formation, degradation, assessment and influence on coffee sensory coffee.
- OLIVEIRA BP, YASUKA FM, CASTRO NETO JC (2024) Brewed coffee sensorial classification with fluorescence spectroscopy by chemometric analysis. SPIE OPTO.
- ATLABACHEW M (2021) Rapid and simultaneous determination of trigonelline, caffeine, and chlorogenic acid in green coffee bean extract. pp. 5028-5035.
- AGNOLETTI B Z, Lucas Louzada Pereira, Enrique Anastácio Alves, Rodrigo Barros Rocha, Danieli Gracieri Debona, et.al. (2024) The terrior of Brazilian Coffea canephora: Characterization of the Chemical Composition. Food Research International 176: 113814.
- (2021) \ABIC https://estatisticas.abic.com.br/wpcontent/uploads/2022/04/pesq_cafe_superior_abic_spch. pdf.
- MOON JK (2009) Role of roasting conditions in the profile of volatile flavor. Agricultura and Food Chemistry Article.
- TRAVELER (2011) The Coffee. https://www.thecoffeetraveler.net/home-1/tag/Typica. The Coffee Traveler.
- (2008) PROTOCOLS, SCAA Cupping.http://coffeetraveler.net/wp-content/files/901SCAA_CuppingProtocols_TSC_DocV_RevDec08_Portuguese.pdf. Coffee Traveler.
- (2023) PAIVA L. https://reviewcafe.com.br/dicas-e-receitas/cafe-bourbon. Review Café. [Online] 06 21, 2023.
- (2022) MAPA. https://revistacafeicultura.com.br/index.php?tipo=ler&mat=71928&portaria-sda-n--570--de-9
- SANCHEZ K, CHAMBERS IV E (2015) How does product preparation affect sensory properties? An example with coffee. Journal of Sensory Studies pp. 499-511.
- CORREIA R M (2022) Infravermelho portátil na região do próximo (NIR) aplicado no controle de qualidade de cafés adulterados por borra.
- CHENG B (2016) Influence of genotype and environment on coffee quality.
- Yamin Zuo, Gaohao Tan, Di Xiang, Ling Chen, Jiao Wang, et al. (2021) Development of a novel green tea quality roadmap and the complex sensory-associated characteristics exploration using rapid near-infrared spectroscopy technology. Spectrochim Acta A Mol Biomol Spectrosc 258: 119847.
- Natalina Cavaco Bicho, António Eduardo Leitão, José Cochicho Ramalho, Nuno Bartolomeu de Alvarenga, Fernando Cebola Lidon (2013) Impact of roasting time on the sensory profile of Arabica and Robusta coffee. 52(2): 163-177.
[Online] 03 10, 2023.
-maio-2022----estabelece-o-padr--o-oficial-de-classifica----o-do-caf---torrado.html. Ministerio da Agricultura e Pecuária.
-

This work is licensed under a Creative Commons Attribution-NonCommercial 4.0 International License.