 Research Article
Seepage Analysis for Soork Dam Foundation
Masoud Cheraghi Seifabad1*, Abdol Ali Khosravi1 and Mahmood Vafaeian2
1Department of Mining Engineering, Isfahan University of Technology, Isfahan, Iran
2Department of Civil Engineering, Isfahan University of Technology, Isfahan, Iran
Masoud Cheraghi Seifabad, Department of Mining Engineering, Isfahan University of Technology, Isfahan, Iran.
Received Date: August 13, 2020; Published Date: August 24, 2020
Abstract
This paper presents a 3-D seepage analysis case study of the Soork Dam in Iran. For this study geotechnical information of the site was collected in two phases. Then the condition of the ground waters characteristics and the seepage through the foundation of the dam was modeled. In this way, numerical simulation was attempted by employing Seep/W, and Seep 3D software. This study shows the results of numerical simulations thus providing seepage measures.
Keywords: Joint Characteristics; Underground Flow; Seepage; 2D and 3D Modeling
Introduction
It is typical that the water reserved behind the dams cause the seepage and sometimes leakage. The rate of seepage should be specifically controlled so that it would not pass the permissible limits. Cedergreen [1] investigated the importance of seepage in all aspects and maintained that most damages to the water facilities can be from the seepage of underground water which are explained in two categories:
• That causes the soil particles move through an escape exit and cause piping or erosion failures;
• The damages caused by uncontrolled seepage patterns leading to saturation, excessive uplift or excessive seepage forces. The seepage control of the dam foundations was studied, and it was suggested that due to the discharge of the soil particles and weakening the foundations [2], the seepage of water occurred eventually leading to dam damage. The possibility of dam collapse due to erosion by the seepage was studied by Meyer [3].
The 3-dimensional seepage was analyzed by using a finite element method based on variable permeabilities [4]. The seepage of Kafrein dam and the ways to control it was studied by Malkavi [5]. The stress-strain, and seepage of a high rock-fill dam with clay core on the sand-gravel foundation was numerically simulated with FLAC 3D software [6]. A study [7] of seepage monitoring of RCC dam was conducted using entropy-based fuzzy matter-element analysis. Curtain grouting with minimum seepage pressure resultant [8] was studied. A regional numerical model was developed and used to evaluate the interaction between surface water bodies and the Quaternary aquifer system in the Nile Valley [9]. The seepage behavior of Gotvand Dam considering effects of dissolution of gypsum was evaluated with 2D and 3D models [10]. A mathematical model was established for coupled unsteady seepage and stress fields in the fractures network of the dam foundation [11]. The 3-D program was developed to analyze the coupling unsteady seepage and stress fields in the fracture rock mass (3D-coupled) used to analyze the influence of seepage field on the dam foundation due to water level fluctuation. The role of nuclear logging techniques and tracer tests were discussed to delineate the path of the seepage from a damaged portion of tailrace channel at the Bhama-Askhed Dam, Maharstra, India [12]. Penalty Function Element-Free Method was used to study the steady seepage field in main dam, that is, with a protective concrete slab and structure of hydro fracture grouting cutoff wall of Dashi Bu reservoir located in Donghai County (China), when it is normal water level for the reservoir, and then the errors between the measured value and computed values from piezometer tubes [13] were compared. An attempt was made to estimate the water seepage from the upper reservoir of Azad pumped storage power plant based on the combined geotechnical studies and geostatistical methods. In their study, using a geostatistical method (Kriging), Lugeon values were estimated for the walls of the reservoir [14]. Analytical methods and the results for assessing the variation in the concentration of sulfates (and other ions) over space and time in the ground water flowing through a soluble evaporate terrain beneath a dam [15] were presented. Remote sensing and geographic information system (GIS) techniques were applied to construct and integrate the hydrogeological data, inventory for potential sources of contamination and mapping the sensitive areas, in order to construct the protected buffer zone for the Ismailia Canal and to constrain the development activities in all the surrounding areas of surface water supply [16]. The aim of this present article is to analyze the seepage pattern within the Soork Dam.
Dam Site
Soork Dam is located southeast of Isfahan (Boroojen, central Iran). The average rainfall in this area is 323 mm/y. The Soork Dam is an earth dam with the clay core. The height of the dam measured from river bed is 39 m with a length of 590 m and a width of 11 m in crown.
Engineering geology and geotechnical characteristic of the Soork Dam
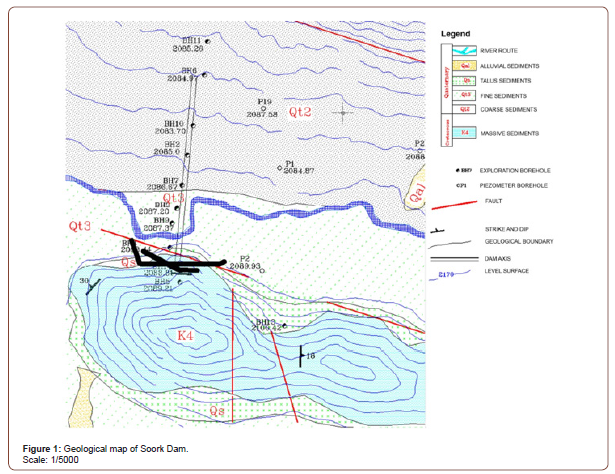
On the dam axis, the valley is an asymmetrical U shape with wide spans. The dips of the walls on the left and right abutments are about 25 and 6 degrees respectively. The rock outcrops of the area are generally of early Cretaceous limestone and shaly limestone. In the dam area, there is Quaternary alluvium with considerable thickness (about 100 m). At the deep areas of the valley, the coarse sediments are replaced by fine sediments of the surface area. Figures 1 and 2 illustrate the area geology of the dam site and the geological section respectively.

Geomechanical characteristics of Soork Dam
The rocks in the area consist of limestone with some abundant cracks, joints, and some small cavities on the surface which are possibly karstic cavities in depth. Two faults with the strikes N5E, N15W and the vertical dips cause the crush of the rock layers. According to the discontinuities, the joints of this area divide into two zones. Each zone is examined separately from another.
The Zone P1
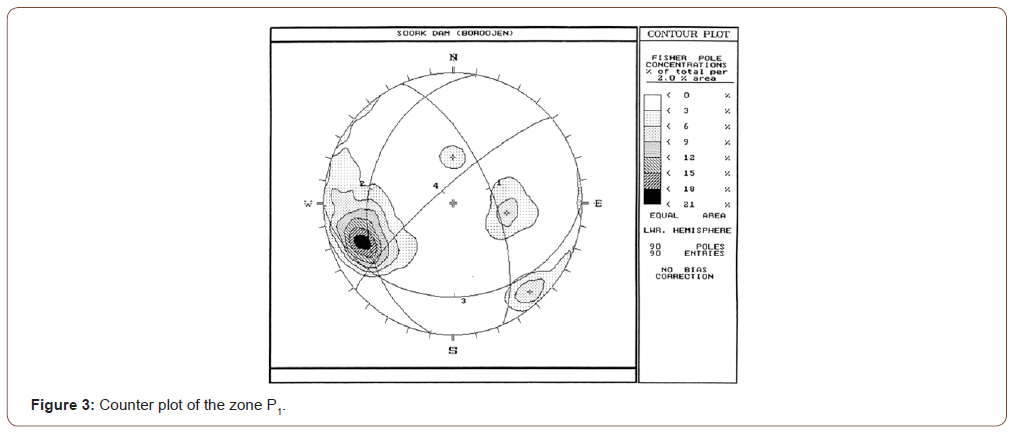
This zone consists of light grey limestone, full of white crystalline calcite veins. The abundance of calcific veins causes color change in rocks. The abundant joints in limestone create long blocks. The water flow and karst effects are observed on the joint surfaces and outcrops. This section is studied linear arrangement based on the spatial positions. The direction is vertical to main joint groups (S1, S2). However, in order to study the other groups (S3, S4), another scan line vertical to the first direction was chosen.
Joint Set S1
This joint set is the most abundant and important. About 67% of the total data in this research is related to this joint. According to the information, the joint set is characterized as N23W/65NE and the average of vertical distance between the joints is 1.8 m. Most of the joints have openings which filled with clay, silt, and partly sand to gravel. There is no water leakage, or flow of water in any of the joints. Figure 3 illustrates all the joint sets of zones P1. Joint set S1 is more than 20 meters in 34 % of them has a length of 3-10 meters in 40 % of the cases. Joint set S1 is rough, and planar in 58% and 10mm opening and defined in 38 %, referred to as a very open one.
Joint Set S2
This joint set is at a lower grade with reference to the abundance and persistence which includes 17 % of the total joints. The characteristic of the joint set S2 is N10E/35NW and the vertical distance between the joints is 4.5m. 35% of this joint set is 3-10m long and 29% has a length of over 20 m. Over 50% of the joints are rough, planar and 36% are rough and undulating.
Joint Sets S3, S4
Compared with the first two sets, these joint sets are less important. They actually cross the others. Most joints are filled with transparent, white crystalline calcite and at the outcrop have openings filled with clay and silt. The representative plane characteristics of these two joint sets are as follows:
Joint Set S3: N90E/30SE
Joint set S4: N50E/80NW
The average spacing of the joint sets S3 and S4 are 1.5-2 m and 2-2.5 m respectively.
The Zone P2
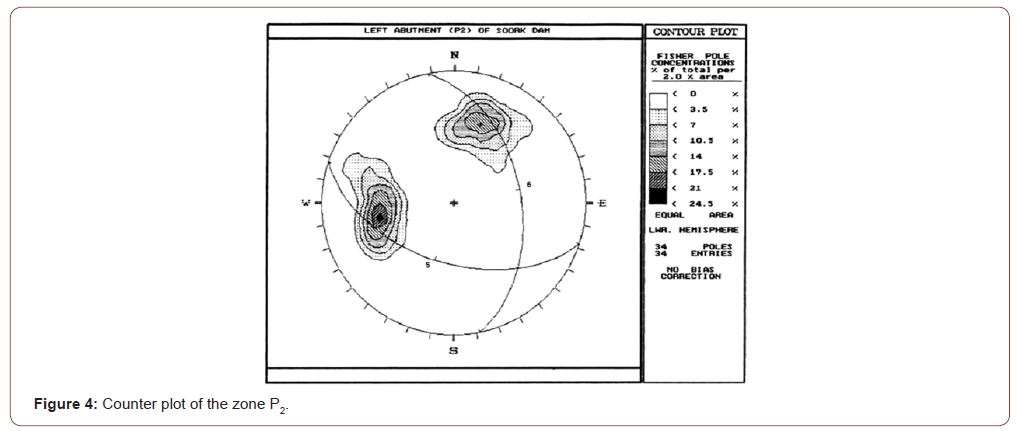
Lithologically this zone consists of a small outcrop of light grey limestone with brown to dark red chert nodules. The limestone is folded. The characteristics of the discontinuities in this zone are investigated linear arrangement in the direction of N38E. Figure 4 shows the counter of discontinuities. Accordingly, the joint sets S1 and S2 are defined from the discontinuity point-of-view. The characteristics of these planes are:
S5: N72W/52SW
S6: N12W/48NE
The average spacings of joint sets S5and S6 are 1-1.5m and 2m respectively.
Seepage Flow Analysis
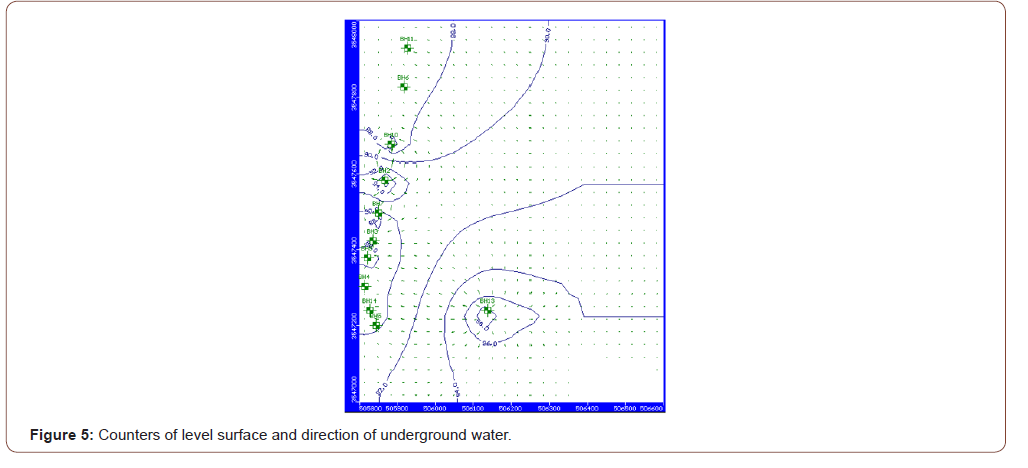
Ten boreholes were drilled during the 1st stage of the studies. According to the technical exploration specifications and geotechnical studies, the water level of all boreholes was achieved fortnightly. The trend of the underground water level changes shows the alternative periods of dry and dump conditions of the underground water at dam axis. Such a water table at the dam site has been modeled. As shown in Figure 5, the direction of the underground water involves a mild deep slope towards the middle of the valley and the water level of the dam axis passes borehole 10.
Seepage assessment
Engineering geology and geotechnical characteristics of the dam site were assessed, 7 boreholes were drilled in foundation, 2 boreholes in the right section, 3 boreholes in the left section and 5 boreholes in the reservoir. The results of permeability tests are indicated in Table 1. The permeability of the rock is achieved through Lugeon tests. The Lugeon tests are conducted at 5 m intervals. The amount of permeability in different intervals is changed from 1 to over 100 Lugeon. As shown in Table 1, the permeability is medium to very high.
Table 1:Distribution of Lugeon values.

Water flow monitoring
The movement of water in the cavities and different joints in the rock differed during water pressure tests. This depends on the type of joint or cavity. Thus, the water flow behaved differently. In most cases the turbulent type of the water flow was observed. Normally in these cases the permeabilities are high and there is need for grouting. In these areas, the joints are very open and there is lack of filling.
Seepage of alluvium materials
To achieve permeability of granular sediments in the field, the Laufran permeability test was conducted in all of the boreholes in the field. The permeability test was conducted using both methods ‘constant head’, and ‘falling head’. The results differed from 10-7 to 10-2cm/s. Because of the variation in permeability, it is important to note the following:
• The boreholes BH3 & BH9 were drilled and tested around the bed river in fine materials. The average permeability in borehole 3 was 10-4cm/s and the maximum permeability change from 10-4 to 10-3cm/s. The maximum permeability in borehole 9 changed from 10-3 to 10-2cm/s. Therefore, it is reasonable to choose 10- 3cm/s for the horizontal permeability of this section. Generally, the vertical permeability is less than this and should be taken into consideration in the calculations.
• In the middle section of the valley, the fine alluvium sediments mixed with the course were located to depth of 100m. The boreholes BH2, BH7 were drilled and tested in this area. Unfortunately, the drilling quality of BH2 was not satisfactory and therefore most of the materials were washed and destroyed. For this reason, BH7 borehole was drilled and Laufran permeability test was performed repeatedly to a depth of 70m. The permeability results in BH7 borehole changed from 10-5 to 10-3cm/s. There was no special arrangement for this dispersion. Hence, the upper limit, i.e. 10-3cm/ s was chosen for the horizontal permeability of this area.
• On the right-hand side, boreholes BH6, BH10 were drilled and tested. The permeability test of BH10 was approximately 10-3 cm/s. This situation was approved for the whole length of BH6. Figure 6 shows the permeability of different sections at the bed rock.
Two-Dimensional seepage analysis
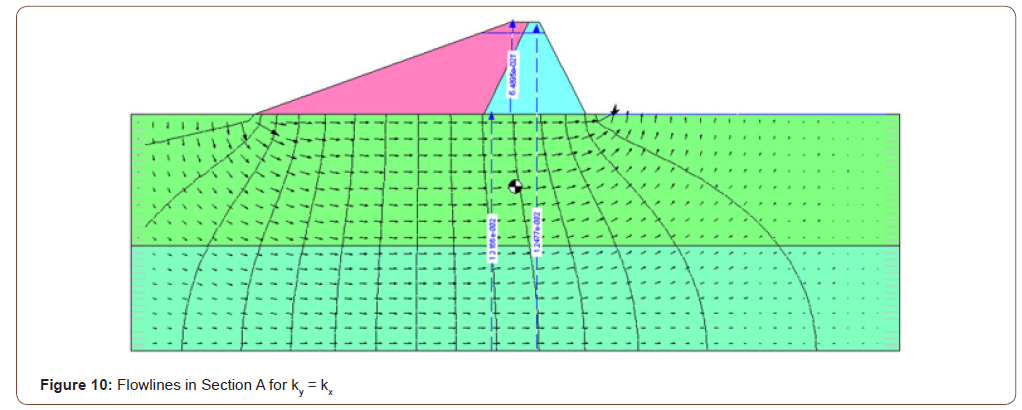
To estimate the seepage water flow, based on the model of alluvium permeabilities with it, different values Ky/Kx (0.1,0.5,1), the amount of flow rate was calculated with Seep/W software [17]. Figure 7 shows the two-dimensional model of section A: the flow rate and flowlines for different Ky/Kx are also illustrated in Figures 8-10. The results of seepage in section A (alluvium foundation) are presented in Table 2. Tables 3 and 4 illustrate the results of seepage analysis for foundation in sections B and C. According to Tables 2,3 and 4 the total amount of flow rate in alluvium foundation can be achieved. In Table 5, the results of alluvium foundation of two-dimensional seepage are shown. Based on a 25-million cubic water reservoir volume, the water loss was shown to be 5.4% in this analysis.
Three-Dimensional seepage analysis
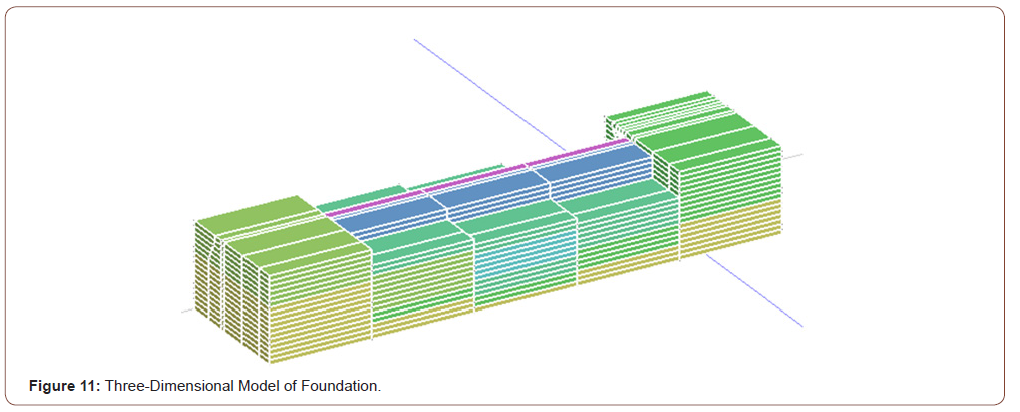
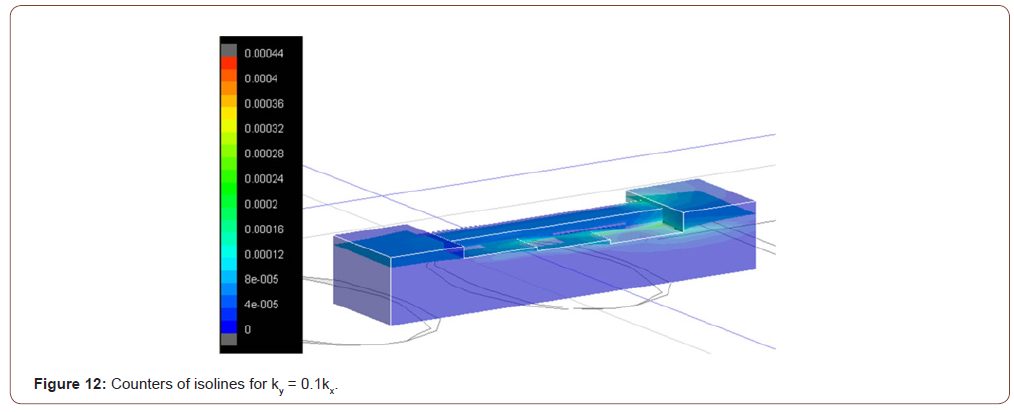
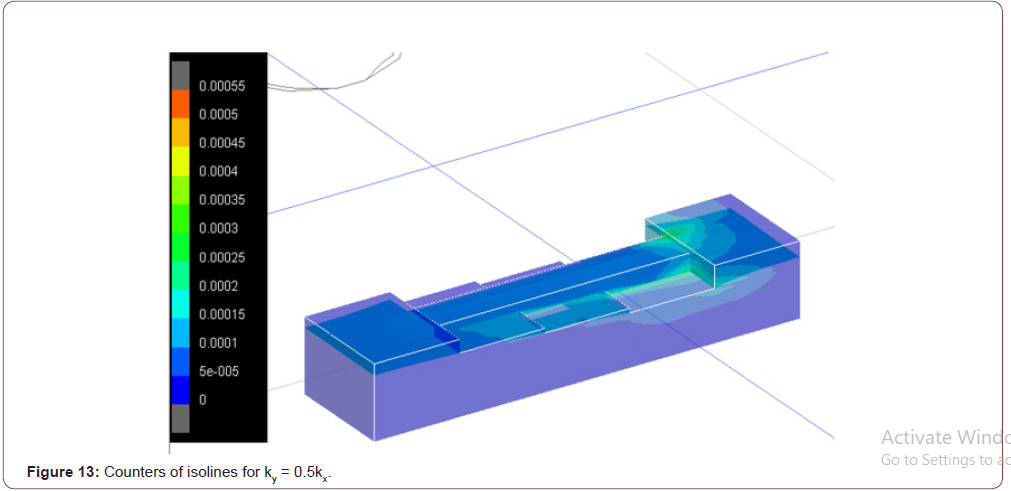
In this part, the report of seepage analysis for different Ky/ Kx is presented. For this purpose, the seep 3D software [17] was used. Figure 11 shows a three-dimensional model and Figures 12 to 14 show the counters for the seepage flow rate. The results of three-dimensional seepage analysis are shown in Table 6. As far as the 25-million cubic meter water reservoir volume is concerned, the water loss here is shown to be 5.4% in this analysis.
Table 2:2D Seepage Analysis in Section A.

Table 3:2D Seepage Analysis in Section B.

Table 4:2D Seepage Analysis in Section C.

Table 5:2D Seepage Analysis in Foundation.

Table 6:3D Seepage Analysis in Foundation.

Table 7:Comparison of 2D and 3D analysis.



Comparison of 2 and 3-Dimensional analysis
Analysis shows that most seepage occurs in section A and the least in section C. The results of 2D and 3D analyses are different. The reason for this is that since the flows are vertical to the transverse sections, they are calculated in 3D analysis. Therefore, the flow rates are calculated more accurately. The differences in the results of 2D, 3D analyses are presented in Table 7.
Conclusion
• The Soork Dam site is an asymmetrical U shape with relatively wide spans. The dips of the walls on the left and right abutments are about 25 and 6 respectively.
• The discontinuities of the left abutment dam site are divided into two zones: P1, P2. P1 include 4 joint sets and P2 two joint sets.
• The quality of rock in wide areas on the left abutment is relatively low. This affects the joint sets and cracks.
• The materials around the river bed on the left end of the valley are generally fine sand, silt, and clay.
• The direction of the underground water is from the abutment sides with a mild dip slope towards the middle of the valley.
• The water loss in 2D and 3D is 5.4% and 6.5% respectively.
• The 2D and 3D analyses of seepage are different. Because the flows are vertical to transverse sections in 3D, the flow rate is calculated more accurately.
Acknowledgement
None.
Conflict of Interest
No conflict of interest.
References
- Cedergreen HR (1968) Seepage, drainage and flow nets. John Wiley and Sons, New York.
- Leg JE (1973) Foundation of existing dams, seepage control. Proceedings of the Engineering Foundation Conference. ASCE California, USA.
- Meyer W, Schuster R, Sabol M (1994) Potential for seepage erosion of landslide dam. J of Geo Eng 120(7): 1211-1229.
- Griffiths DV, Fenton GA (1997) Three-dimensional seepage through spatially random soil. J of Geo and Geoen Eng 123(2): 153-160.
- Malkawi AIH, Al-sheriadeh M (2000) Evaluation of rehabilitation dam seepage problems, Kafrein dam: a case study. Engineering Geology 56: 335-345.
- Xing YL, Shu YM, Hua JF, Li YH, Zhou WY (2008) Improvement of arch action at clay core-wall of high rockfill dam by united seepage control with geomembrane. Proceedings of the 4th Asian Regional Conference on Geosynthetics, Shanghai, China.
- Gu C, Zhang Z, Cai X, Hou Y (2011) Application of entropy-based fuzzy matter-element analysis in seepage monitoring of RCC dam. Front Archit Civil Eng China 5(1): 105-111.
- Chai J, Cui W (2012) Optimum thickness of curtain grouting on dam foundation with minimum seepage pressure resultant.” Struct Multidisc Optim 45: 303-308.
- Dawoud MA, Ismail SS (2011) Saturated and unsaturated River Nile/groundwater aquifer interaction system in the Nile Valley. Egypt. Arab J Geosci 6: 2119–2130.
- Sadrekarimi J, Kiani M, Fakhri B, Vahdatirad MJ, Bahri A (2011) Seepage analysis of Upper Gotvand Dam concerning gypsum karstification (2D and 3D approaches). Front Archit Civ Eng China 5(1): 71-78.
- Chai JR, XU WS (2011) Coupling analysis of unsteady seepage and stress fields in discrete fractures network of rock mass in dam foundation. Sci China Tech Sci 54(1): 133-139.
- Kamble RK, Panvalker GA, Chunade AD (2011) Mapping seepage in the tailrace channel, Bhama-Askheddam: a case study. Bull Eng Geol Environ 70: 643-649.
- Jing T, Yongbiao L (2012) Penalty Function Element Free Method to solve complex seepage field of earth fill dam. 2nd International Conference on Mechanical, Industrial, and Manufacturing Engineering, China, pp. 117-123.
- Alianvari A, Maleki Tehrani M, Soltanimohammadi S (2012) Application of geostatiscal methods to estimation of water flow from upper reservoir of Azad pumped storage power plant. Arab J Geosci 6: 2571–2579.
- Piqueras JAM, Pérez ES, Meméndez-Piedel I (2012) Water seepage beneath dams on soluble evaporate deposits: a laboratory and field study (Caspe Dam, Spain). Bull Eng Geo Environ 71: 201-213.
- Ghodeif KO, Arnous MO, Geriesh MH (2013) Define a protected buffer zone for Ismailia Canal. Egypt using Geographical Information Systems. Arab J Geosci 6: 43-53.
- Seep 2D,3D Software (2004) The seep analysis group, Groundwater seepage analysis (Seep/W). Geo-slope International Ltd.
-
Masoud Cheraghi Seifabad, Abdol Ali Khosravi, Mahmood Vafaeian. Seepage Analysis for Soork Dam Foundation. Glob J Eng Sci. 6(3): 2020. GJES.MS.ID.000637.
-
Joint Characteristics, Underground Flow, Seepage, 2D and 3D Modeling
-

This work is licensed under a Creative Commons Attribution-NonCommercial 4.0 International License.


