 Research Article
Quantification of Mass Concentrations Aerosols PM2.5 from Secondary Schools in Ogbomoso
Olu-Arotiowa Olusesan Abel1, Ajani Ayobami Olu1*, Jimoda Lukuman Adekilekun1, Akande Gabriel Opeyemi1 and Raji Wuraola Abeke2
1Ladoke Akintola University of Technology, Ogbomoso-Nigeria
2Igbinedion University Okada, Edo State-Nigeria
Ajani Ayobami Olu, Ladoke Akintola University of Technology, Ogbomoso-Nigeria.
Received Date: April 23, 2022; Published Date: May 23, 2022
Abstract
High PM concentrations in classrooms, which indicate poor ventilation conditions and the increasing particulate matter in urban outdoor air, have in particular, been identified as primary causes of poor indoor air quality in schools. In this study, 16 secondary schools were selected in Ogbomoso, and the collection of PM2.5 was performed in morning and afternoon and in the presence and absence of students. The concentration levels of PM2.5 concentration ranged from 14.4 to 58.5g/m3 for indoor and 8.2 to 70.1g/m3 for outdoor, PM10 concentration ranged from 83.5 to 348g/m3 for indoor and 48 to 282.3μg/m3 for outdoor in the presence of students while PM2.5 concentration ranged from 7.4 to 27.3μg/m3 for indoor and 5.7 to 20.3μg/m3 for outdoor, and PM10 concentration ranged from 55.8 to 291.5μg/m3 for indoor and 38.8 to 203.9μg/m3 for outdoor in the absence of students.
Keywords:Particulate matter; Concentration; Ventilation; Outdoor; Indoor; Air
Introduction
Air pollution has been of major concern throughout the world due to the health effects on human, animal and materials. This issue is receiving much attention, due to the fact that both in developed and developing countries there have been an increase in urbanization due to higher activities in transportation and industrialization [1]. The growing concerns about the health implications of air, water, and soil pollution to ecosystem have led to the establishment of agencies which are saddled with the responsibility of combating the adverse effects [2]. Examples of these organization, agencies and departments are World Health Organisation (WHO), United State Environmental Protection Agency (USEPA), United Nations (UN), and Central Pollution Control Board (CPCB) from India. The local, national and international agencies are working and concentrating on pollutions in the environment and publishing and issuing documents to improve the air quality (Department of Environmental, Food and Rural Affairs 2015). Human activities, due to industrial revolution, have always had the prosperity of instigating a variety of environment pathologies [3].
The particulate matter (PM) refers to a generic class of contaminant rather than a particular individual contaminant with a specific chemical structure; it applies to solid or liquid particles suspended in the air independently of composition [4]. The PM consists of a heterogeneous group of components where the particles are derived from various sources including traffic, biomass burning small- and large-scale waste incineration and industrial processes, among others. Consequently, these airborne particles are a complex mixture of organic and inorganic, solid and liquid substances, which vary in size and composition including gaseous pollutants, sulfate and nitrate ions, condensed acid, soil dust, soot, ash, mold and pollen [5]. The classification of particles according to their aerodynamic properties is critical since these properties determine how the particle is transported and removed from the air, their deposition in the respiratory system and its chemical composition and source. Since the composition of the particles vary widely, it is postulated that some are more toxic than others, and therefore, the evaluation of interventions in public health requires assess them differentially. Some studies suggest different health outcomes with different particle size. The information so far available indicates that PM2.5 (particles in air with 2.5 micrometers in diameter or smaller) is a better predictor of health effects that the PM10 (particles up to 10 micrometers in diameter). Air pollution derives from a variety of sources from which the combustion of fossil fuels can be considered a primary source. Wood smoke can be an important contributor PM and gas in the ambient air, reaching up to 80% of airborne particles during the winter [6]. Today there are studies on air pollution and its effects on health that have established a relatively consistent link between the two. However, investigations have focused with more emphasis on outdoor air pollution more than in the indoor. Attributable to indoor air pollution cause by inefficient use of solid fuels, including pneumonia, stroke, ischemic heart disease, chronic obstructive pulmonary disease and, lung cancer. The main sources of emission of pollutants of interior spaces include the use of fuels, cigarette smoke and outdoor air infiltration. Studies have shown that between 60 and 75% of PM2.5 from outside penetrates into indoor environment [7]. Thus, it has been determined that construction activities and vehicular traffic are important sources of atmospheric PM but they also affect indoor PM concentrations. The study of McCormack et al., carried out at Baltimore, Maryland, found a statistically significant relationship between environmental and indoor PM2.5 concentration, calculating that for every 1 μg/m3 increase in environmental PM2.5 indoor levels increase 0.58 μg/m3 (p=0.02). However, it could be expected that in smaller cities, where vehicular traffic and construction activity are significantly lower, PM concentrations depend mainly of indoor emission sources [8]. Thus, from a global point of view, many factors affect indoor particle concentration, including environmental particles, activities within the home (cooking, cleaning, moving), particle deposition and air exchange rate. The use of solid fuels for cooking and heating is probably the main source of indoor pollution. Solid fuels are cheaper than gas and electricity and are used more frequently in urban and rural areas of extreme poverty. The preference for this type of fuel is due to the favorable ratio of price and heat quality and is used for cooking and to heat homes. In this context, pollutants emitted by the combustion of solid fuel (CO, NOx and PM) reach significantly higher levels indoor than the outdoor air, mainly due to poor ventilation and inappropriate technology, for example, using incomplete combustion stoves or open fires, which is still common in many developing countries [9]. Many harmful components are products of burning solid fuels, so the problem is particularly relevant in areas where home heating and food preparation are made at the expense of these fuels. Approximately 3 billion people are still cooking and heating their homes with solid fuel (i.e., wood) in open fires and leaky stoves, mostly poor people living in lowand middle-income countries. Specifically, the use of solid fuels has been associated with acute respiratory infections in children under 5 in developing countries, such as Nepal, Argentina, Nigeria, Tanzania, Gambia and Brazil. However, although PM concentrations in developed countries are much lower than in developing countries given the differences in the advancement of technology for routine household activities and the use of cleaner fuels (i.e., liquefied petroleum gas, electricity and natural gas) for cooking and heating, there are still health risks in people from developed countries. In developing countries, such as Nepal and China, where traditional methods such as open cooking fire and other open devices are used, the total suspended MP from wood smoke range from 2.7 up to 25μg/m3 [10]. Meanwhile, it has been shown that particles emitted by the combustion of pine, oak and eucalyptus, ranging from 0.1 to 0.3 microns in aerodynamic diameter. Indoor air pollution derived from solid fuels has been considered the eleventh overall risk factor for mortality and the seventh risk factor for burden of disease, estimated to be responsible for 2.6% of the global burden of disease. Compared to households that use cleaner fuels (i.e., electricity, kerosene, natural gas) mortality rates of children under five from households that use more polluting fuel (biomass) are substantially higher. Consequently, it has been estimated higher risk of death in rural areas (RR=2,0; CI 95% 1,4-2,8) as well as urban (RR=1,22; CI 95% 1,004-1,5). There are several factors that increase the risk of exposure to indoor air pollution such as large amount of exposed population, frequent use of stoves, time spent by people at home and, in particular, the proximity of women and children to stoves while biomass is burned. The adverse effects of indoor air pollution on health are often exacerbated by the lack of ventilation in homes using biomass fuel and poorly designed stoves that do not have fireplaces or hoods to bring the smoke outside the inhabited area. Moreover, the combustion efficiency of biomass is also very low, resulting in relatively high levels of incomplete combustion products, which are harmful to health [11-16].
Research Method and Materials
This study was carried out in a three-step process which include sampling of particulate matter (PM1, PM2.5, PM4, PM10) in 16 secondary schools in Ogbomoso. The second step involves mapping which the use of google earth to locate the coordinates of the schools and Arc-Gis to get the maps of the sampling locations. Thirdly mapping the points with ISC- AERMOD software [17-21].
Description of Study area
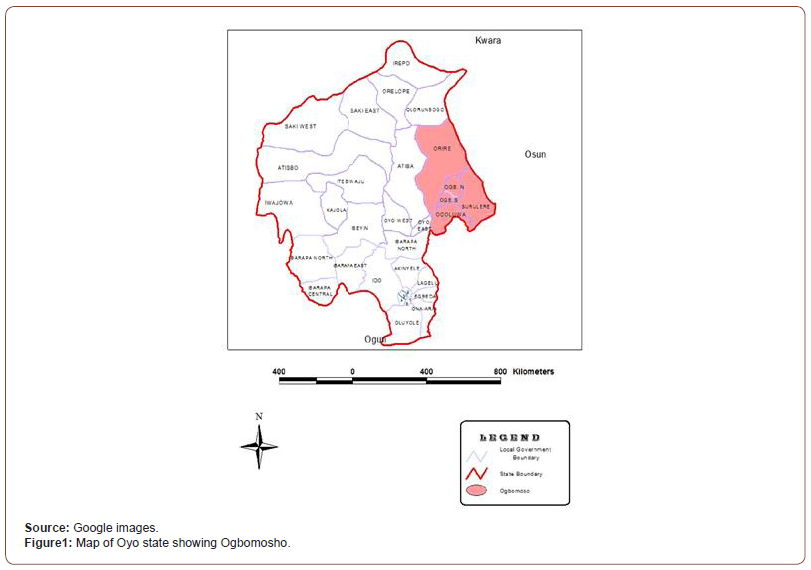
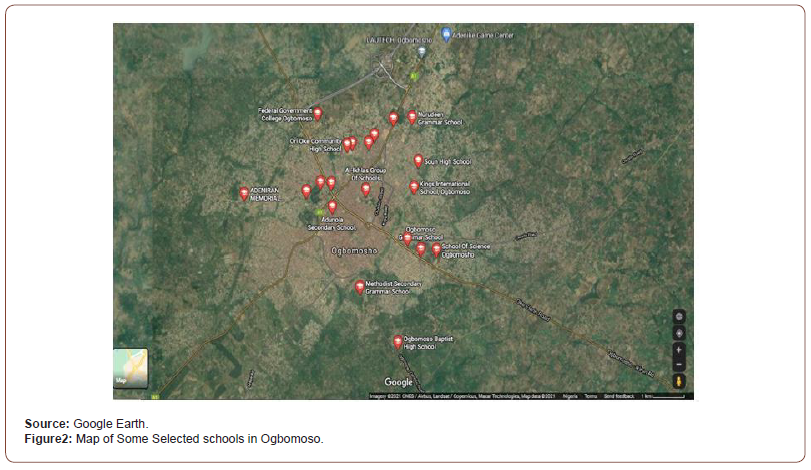
The study was carried out in Ogbomoso, this city is located in Oyo state, south-western Nigeria. The city of Ogbomoso lies on longitude 80 081N, 40 151E and latitude 8.1330N, 4.2500 E, with daily average temperature ranges of 25oc and 35oc. Ogbomoso lies on 334m above sea level, it has a tropical climate, in winter there is much less rainfall than in summer, the least amount of rainfall occurs in January, the average in this month is 9mm/0.4 inch, most precipitation falls in September, with an average of 212mm/ 8.3inch. As of 2006 census, it had population of 245000. Land use patterns – resident, industrial and commercial were considered in choosing the sampling locations in the metropolis (Figures 1&2) [22-26].
Air sampling for particulate matter
The 16 secondary school was randomly selected and was spread throughout Ogbomoso. The PM collections consist of placing the impactor in the middle of the school yard one-meter-high, away from any source of contamination from the ground. four samples were taken daily for each school, in the morning (8 – 10 am), both indoor and outdoor, at noon (2:30pm – 4:30pm), both indoor and outdoor. PM2.5 collections were conducted in the presence and absence of students in the school yard. The collection time was 30 minutes; for each sample, a total of four samples per day per school was collected. A total of 320 samples shall be collected for Four months. Quantification of PM2.5 aerosols in secondary schools in the city of Ogbomoso was made using Aerocet 531S particulate counter/dust monitor, an equipment from Met One Instruments. The Aerocet 531S is a full-featured, battery-operated handheld mass monitor, The unit measure six mass concentration ranges (PM1, PM2.5, PM4, PM10). Gravimetric method was employed in measuring filter weights before and after sampling. The obtained PM concentrations from Hazdust sampler were correlated against those obtained from Aerocet531S dust monitor. Corrected values were calculated using equations for corrected factor adapted from Adeniran et al., 2017. The obtained data was analyzed and the determination of air quality impact by comparing calculated ground level concentration with required air quality standards [27-29].
Estimation of particulate matter
The air pollutants estimated for includes PM1, PM2.5, PM4 and PM10. The values were read on the Met one instrument and tabulated in Table 3.2 for each school.
Mapping of study area
The mapping was performed using Google Earth, Arc-Gis for the selected secondary schools in Ogbomoso.
Google earth
Google earth is a computer program that renders a 3D representation of Earth based primarily on satellite imagery. The program maps the Earth by superimposing satellite images, aerial photography, and GIS data onto a 3D globe, allowing users to see cities and landscapes from various angles.
The school’s coordinates were located with Google earth and the locations were recorded for each school as recorded.
ArcGIS
ArcGIS is a geographic information system(GIS) for working with maps and geographic information. It is used for creating and using maps, compiling geographic data, analyzing mapped informed, sharing and discovering geographic information, using maps and geographic information in a range of applications, and managing geographic information in a database.
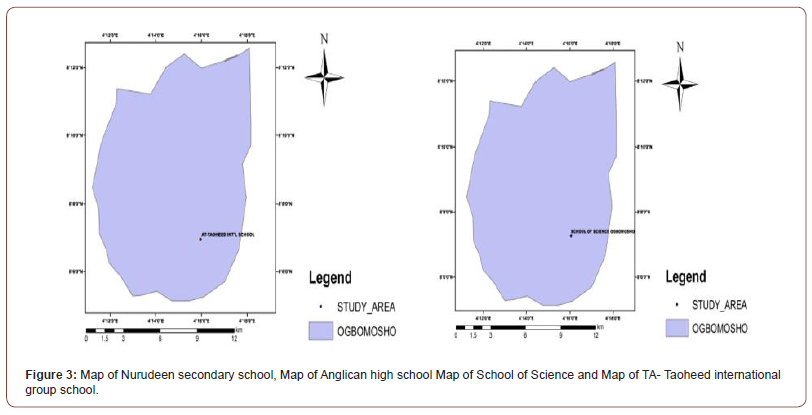
This system was used to map all the areas in Ogbomoso where the samples were taken. The map of Oyo state was extracted using the system because all the work that was done on the system requires the map. This map was imported into the system after which the coordinates of all the locations within the areas (i.e. the longitudes and latitudes of all the locations, together with the elevation) Olu-Arotiowa et al., 2022. The location of selected schools from Oyo state map using ArcGIS are shown below (Figure 3).
Prediction of ground study area and concentration level using AERMOD
The AERMOD atmospheric dispersion modeling system is an integrated system that includes three modules:
A steady-state dispersion model designed for short (up to 50 kilometers) dispersion of air pollutant emissions stationary industrial sources. A meteorological data preprocessor (AERMET) that accepts surface metrological data, upper air soundings, and optionally, data from on-site instrument towers. It then calculates atmospheric parameters needed by the dispersion model, such as atmospheric turbulence characteristic, mixing heights, friction velocity, Monin-Obukov length and surface heat flux.
A terrain preprocessor (AERMAP) whose main purpose is to provide a physical relationship between terrain features and the behavior of air pollution plumes. It generates location and height data for each receptor location. It also provides information that allows the dispersion model to simulate the effects of air flowing over hills or splitting to flow around hills.It also includes PRIME (Plume Rise Model Enhancements) which is an algorithm for modelling the effects of downwash created by the pollution plume flowing over nearby building. AERMOD was developed by the AERMIC (American Meteorological Society (AMS)/United State Environmental Protection Agency (EPA) Regulatory Model Improvement Committee), a collaborative working group of scientists from the AMS and the EPA [30].
AERMOD was used to model the particulate matter depositions for each study location based on the longitude and latitude coordinates to obtain a pictorial representation of the high and low concentrations of the PM deposited in each study location.
Emission modelling
Emission dispersion was modelled using the ISCST3 AERMOD (Industrial Sources Complex Short-term American Meteorological Society/Environmental Protection Agency Regulatory Model Version 8.7.0) view to study spatial distribution of pollutants from burning points. The software model employed Gaussian Air Plume Dispersion approach to study the concentrations at various points as we move away from the source. The evaluation of source concentration was achieved using EFA approach (equation 3.3). Other parameters for a volume source such as plume height, vent diameter was measured, and meteorological data needed for effective programming were obtained. The AERMOD View (8.7.0) air dispersion modelling tool developed specially for Microsoft Windows and runs under windows 95/98/Me/NT/2000 and XP could only view a radius of 50 km maximum [31-33].
The country was dividing into twenty grid points to ensure effective coverage.
The elevation of source strength was achieved using Equation 3.1 which was based on the emission factor. The AERMOD viewed the model emission from volume source in this research work.
Air quality impact study
The emission dispersion result obtained was compared with other available standard or standard values for Nigeria and globally to ascertain if it falls within the threshold limit.
Results and Discussion
Results presentation
The result of the emission inventory, dispersion modelling study and impact assessment are presented in this chapter. The results consist of the estimate of pollutants emission rate from various emission source in some selected secondary schools in Ogbomoso. The criteria air pollutants include PM2.5.
The results show the varying emission rates obtained from different times such as morning indoor with students, morning outdoor with students, afternoon indoor without students and afternoon outdoor without students.
Deposited particulate matter
The deposited rate of measured mass concentration of PM2.5 concentration ranged from 14.4 to 58.5 μg/m3 for indoor and 8.2 to 70.1 μg/m3 for outdoor. all in the presence of students. PM2.5 concentration ranged from 7.4 to 27.3 μg/m3 for indoor and 5.7 to 20.3 μg/m3 for outdoor all in the absence of students
Emission inventory results
From the results of emission inventory carried out in Nurudeen Secondary School, emissions of PM2.5 for morning indoor with students, morning outdoor with students, afternoon indoor without students and afternoon outdoor without students were 0.0072 g/s, 0.0082 g/s, 0.0063 g/s and 0.0052 respectively.
In Anglican Grammar School, PM2.5 has emissions of 0.0101 g/s, 0.0063 g/s, 0.0073 g/s and 0.0052g/s respectively for morning indoor with students, morning outdoor with students, afternoon indoor without students and afternoon outdoor without students. The emission results for School of Science Ogbomosho. PM2.5 has emissions of 0.0087g/s, 0.0168 g/s, 0.0069 g/s and 0.0066 g/s respectively
Pictorial representation of the model
The dispersion modeling outputs for 1-hour averaging period ground level concentrations from all the emission sources in the four secondary schools under consideration are reported and summarized.
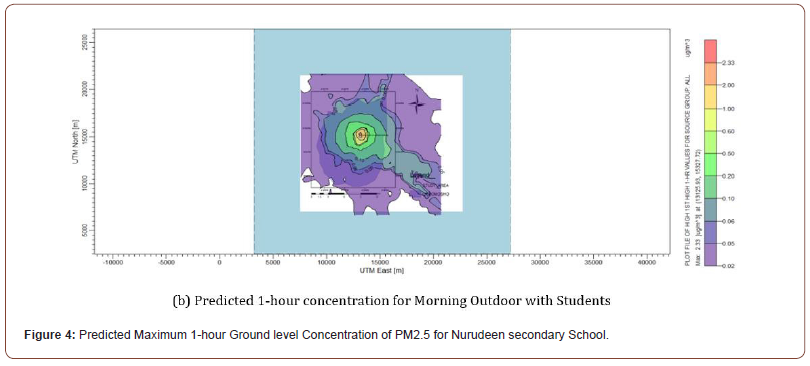
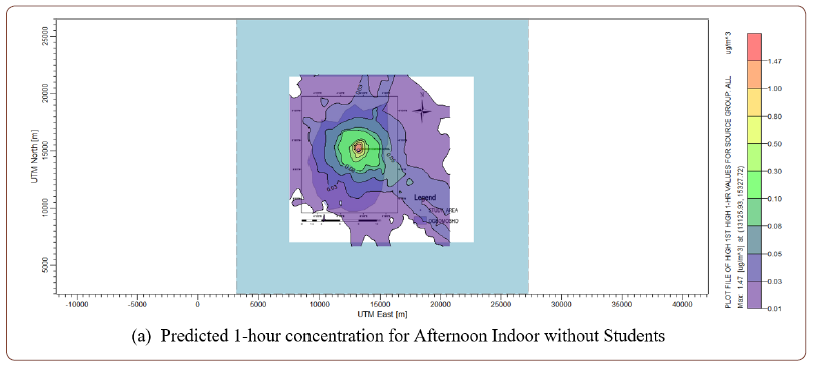
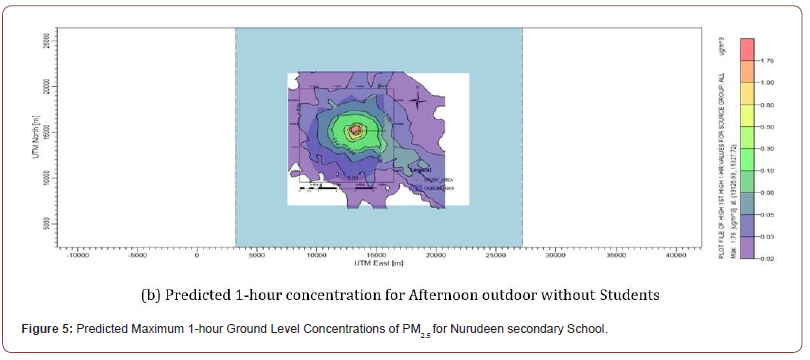
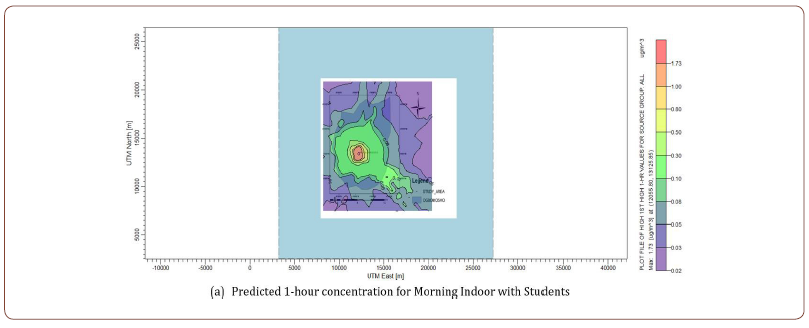
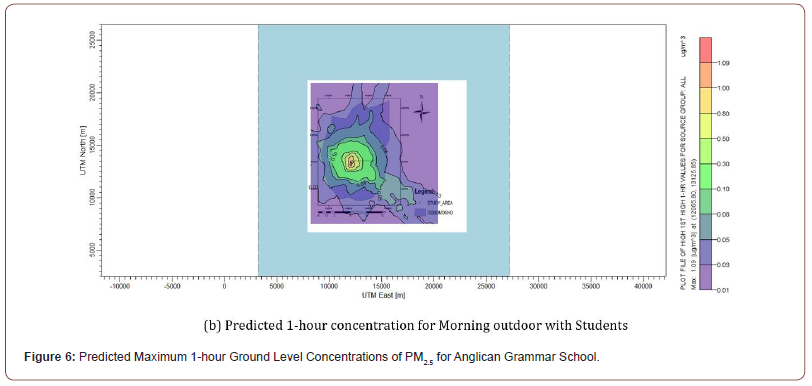
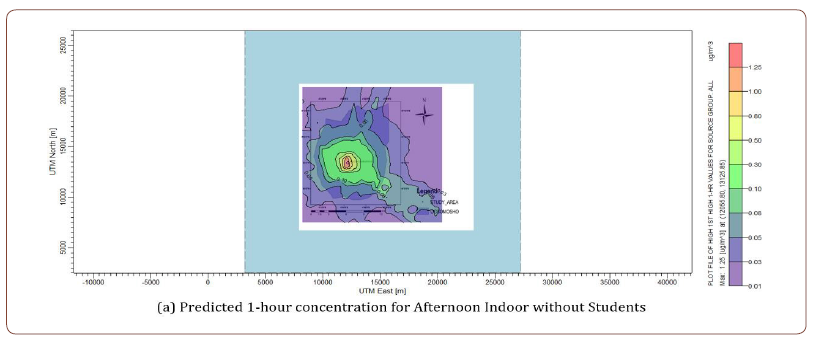
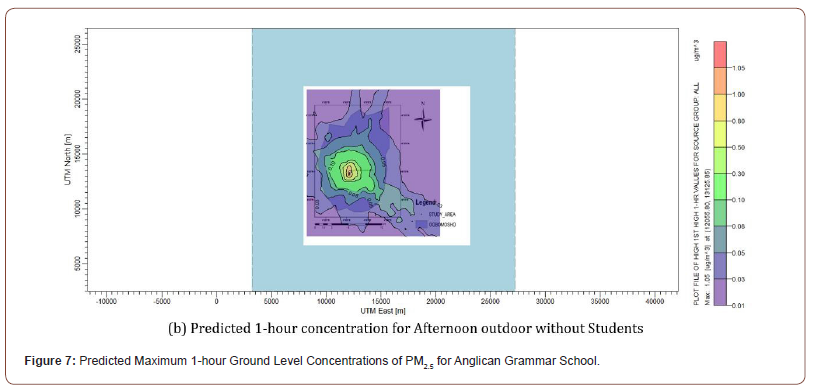
Considering the PM2.5 emissions from Nurudeen Secondary, the 1-hour averaging periods ground level concentrations for morning indoor with students, morning outdoor with students, afternoon indoor without students and afternoon outdoor without students were predicted to be in the range of 0.02-2.05μg/m3, 0.02-2.33μg/ m3, 0.02-1.76 μg/m3 and 0.01-1.47 μg/m3 respectively as shown in Figure 4 and Figure 5. Similarly, Figure 6 and Figure 7 show the PM2.5 emissions from Anglican High School on the average 1-hour averaging periods ground level concentrations for morning indoor with students, morning outdoor with students, afternoon indoor without students and afternoon outdoor without students, which were predicted to be in the range of 0.02-1.73 μg/m3, 0.01-1.09 μg/ m3, 0.01-1.25 μg/m3 and 0.01-1.05 μg/m3 respectively [34,35].
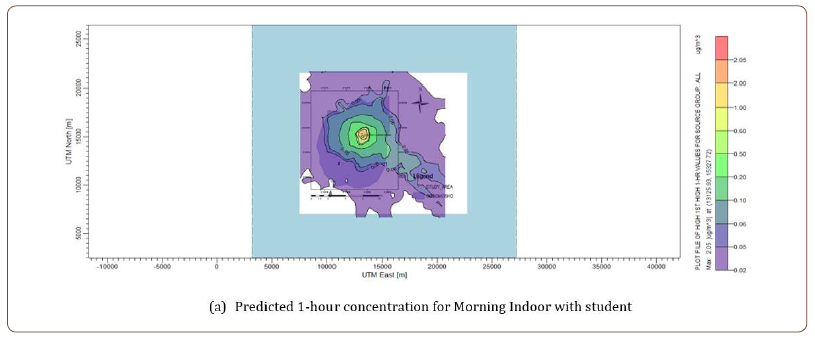
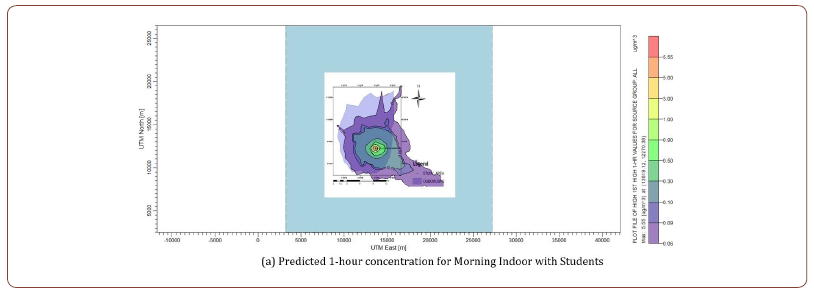
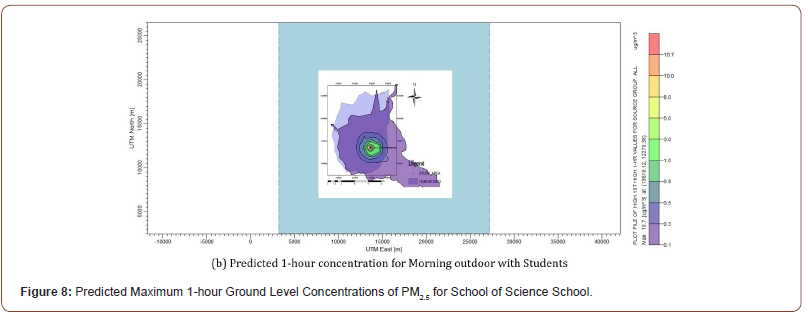
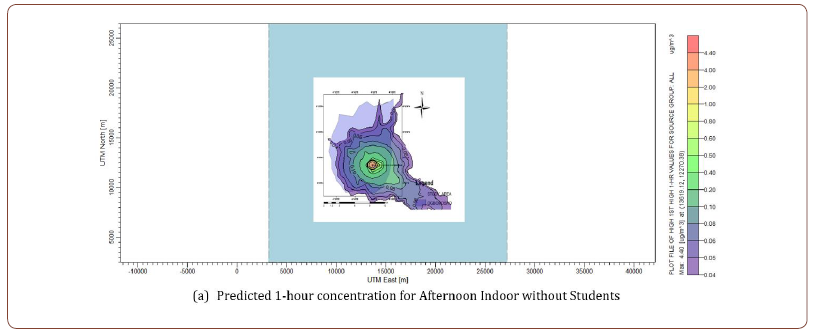
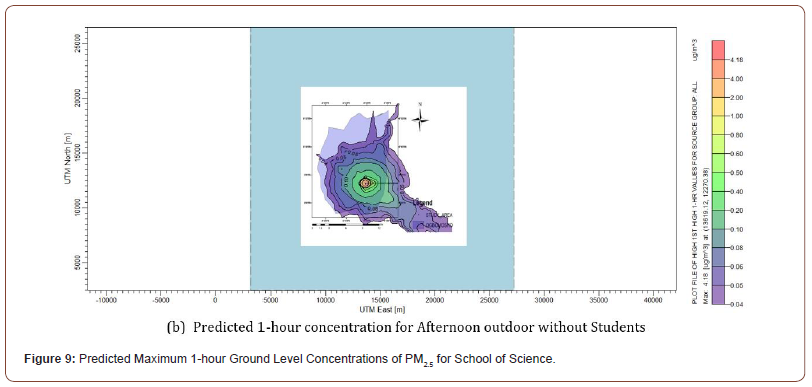
Lastly, the PM2.5 emissions from School Science Ogbomosho on the average 1-hour averaging periods ground level concentrations for morning indoor with students, morning outdoor with students, afternoon indoor without students and afternoon outdoor without students were predicted to be in the range of 0.06-5.55 μg/m3, 0.1-10.7 μg/ m3, 0.04-4.40 μg/m3 and 0.04-4.18 μg/m3 respectively as shown in Figure 8 and Figure 9.
Discussion of Results
From the dispersion modeling results, predicted maximum ground level concentrations of PM2.5 from Nurudeen Secondary School were all below the World Bank standard limit in all identified emission sources. From Anglican High School, predicted maximum ground level concentrations of PM2.5 were also below the standard limit of World Bank in all identified emission sources. Considering From School of Science Ogbomoso, predicted maximum ground level concentrations of PM2.5 were similarly below the standard limit of World Bank in all identified emission sources [36].
Conclusion
This study has made it possible to know the state of PM2.5 air quality in the educational establishments of Ogbomoso, where a certain number of suspended contaminants in the air is present in the urban school environment. However, repairable suspended particles (RSPMs) are of great importance because they can significantly affect the health of occupants [37]. The analysis of the canonical components showed that the PM2.5 concentration was strongly correlated with the wind speed and closely related to the humidity and temperature in the 3 sampling times. We, therefore, note that wind speed is one of the conditions more or less favourable to the dispersion of pollutants. We conclude that wind speed also has a significant influence on the increase of aerosol concentrations in winter, with important implications that must be related to occupants in the middle. There was a highly significant difference (p = 0.001) between the mass concentrations of PM2.5 measured in the presence and absence of students for the schools. Ultimately, the dispersion of aerosols is favored by the increase in speed wind and the movements of students in the course at the time of recreation. The analysis of factorial variance in the absence of indoor and outdoor of student and in the presence of students both indoor and outdoor showed that the concentration of the PM2.5 in the morning both indoor and outdoor with student was higher than at noon both indoor and outdoor without student. Out of 16 schools, the school of science was noted that PM2.5 is dominance. The school is located in ogbomoso-owode and it exposed to heavy road ground floor; we also note that the causes of pollution are the floor of the school was not tile, road traffic and human activities in markets and building sites located near these school. Tree cover and tree planting programmes are still quite rational and reasonable.
Acknowledgment
None.
Conflict of Interest
No conflict of interest.
References
- Abiye OE, Obioh IB, Ezeh GC (2013) Elemental characterization of urban particulates at receptor locations in Abuja, North Central Nigeria. ATM Env 81: 695-701.
- Ezeh GC, Obioh IB, Asubiojo OI, Chiari M, Nava S, et al. (2014) Elemental Compositions of PM10-2.5 and PM2.5 aerosols of a Nigerian Urban City using ion beam analytical techniques. Nucl Inst & Methods in Phy Res B 334: 28-33.
- Alahmr FO, Othman M, Wahid NBA, Halim AA, Latif MT et al. (2012) Composition of dust fall around semi-urban areas of Malaysia. Aerosol and Air Quality Res 12: 629 -642.
- Amodio M, Catino S, Dambruoso PR, Laiola E, Marzocca A et al. (2014) Atmospheric deposition: Sampling procedures, analytical methods, and main recent findings from the scientific literature. Adv Meteorology http://dx.doi.org/10.1155/2014/161730.
- Astudillo P, Mancilla P, Olmos C, Reyes Á (2012) Epidemiology of pediatric respiratory consultations in Santiago de Chile, from 1993 to 2009. Revista Panamericana de Salud Pública 32:56–61.
- Avolio ML, Pataki DE, Pincetl S, Gillespie TW, Jenerette GD et al. (2015) Understanding preferences for tree attributes: The relative effects of socio-economic and local environmental factors. Urban Ecosystems 18(1): 73–86.
- Bell M, McDermott A, Zeger S, Samet JM, Dominici F et al. (2004) Ozone and short-term mortality in 95 US urban communities, 1987–2000. JAMA 292(19): 2372–2378.
- Crilley LR, Ayoko GA, Stelcer E, Cohen DD, Mazaheri M et al. (2014) Elemental composition of ambient fine particles in urban schools: sources of children’s exposure. Aerosol and Air Quality Res 14:1906-1916.
- Díaz-Robles LA, Fu JS, Vergara-Fernández, A, Etcharren P, Schiappacasse LN et al. (2014) Health risks caused by short term exposure to ultrafine particlesgenerated by residential wood combustion: A case study of Temuco, Chile. Environment International 66: 174–181.
- Dallman IR, Onasch TB, Kirchstetter TW, Worton DR, Fotner EC et al. (2014) Characterization of particulate matter emissions from on-road gasoline and diesel vehicles using a foot particle aerosol mass spectrometer. Atm Chem Phys 14: 7585-7599.
- Gostin IN (2009) Air pollution effects on the leaf structure of some Fabaceae species. Notulae Botanicae Horti Agrobotanici Cluj-Napoca 37(2): 57.
- Machler F, Wasescha MR, Krieg F, Oertli JJ et al. (1995) Damage by ozone and protection by ascorbic acid in barley leaves. Journal of Plant Physiology 147: 469–473.
- McConnell R, Berhane K, Gilliland F, London S, Islam T et al. (2002) Asthma in exercising children exposed to ozone: A cohort study. The Lancet 359:386–391.
- WHO Air Pollution (2019). WHO. Available online at: http://www.who.int/airpollution/en/ (accessed October 5, 2019).
- Moore FC (2009) Climate change and air pollution: exploring the synergies and potential for mitigation in industrializing countries. Sustainability 1:43–54. 10.3390/su1010043.
- USGCRP (2009) Global Climate Change Impacts in the United States. In: Karl TR, Melillo JM, Peterson TC (Eds.), Climate Change Impacts by Sectors: Ecosystems. New York, NY: United States Global Change Research Program. Cambridge University Press USA.
- Marlon JR, Bloodhart B, Ballew MT, Rolfe-Redding J, Roser-Renouf C et al. (2019) How hope and doubt affect climate change mobilization. Front Commun 4:20 10.3389/fcomm.2019.00020.
- Eze IC, Schaffner E, Fischer E, Schikowski T, Adam M et al. (2014) Long- term air pollution exposure and diabetes in a population-based Swiss cohort. Environ Int 70:95–105. 10.1016/j.envint.2014.05.014.
- Kelishadi R, Poursafa P (2010) Air pollution and non-respiratory health hazards for children. Arch Med Sci 6: 483–95. 10.5114/aoms.2010.14458.
- Sitch S, Cox PM, Collins WJ, Huntingford C (2007) Indirect radiative forcing of climate change through ozone effects on the land-carbon sink. Nature 448: 791–794.
- http://cfpub.epa.gov/ncea/isa/recordisplay.cfm?deid=149923.
- S. Environmental Protection Agency (2006) Air Quality Criteria for Lead (Final Report). Washington, DC: U.S. EPA, National Center for Environmental Assessment. EPA/600/R-05/144aF-bF. http://cfpub.epa.gov/ncea/isa/recordisplay.cfm?deid=158823.
- S. Environmental Protection Agency (2009) Integrated Science Assessment for Particulate Matter (Final Report). Washington, DC: U.S. EPA, National Center for Environmental Assessment.EPA/600/R-08/139F. http://cfpub.epa.gov/ncea/CFM/recordisplay.cfm?deid=216546.
- S. Environmental Protection Agency (2009) National Ambient Air Quality Standards (NAAQS).
- Bateson TF, J Schwartz (2008) Children's response to air pollutants. Journal of Toxicology and Environmental Health 71(3): 238-43.
- Salvi S (2007) Health effects of ambient air pollution in children. Paediatric Respiratory Reviews 8(4): 275-80.
- Wigle DT, TE Arbuckle, M Walker, MG Wade, S Liu et al. (2007) Environmental hazards: Evidence for effects on child health. Toxicology and Environmental Health Part B: Critical Reviews 10(1-2): 3-39.
- Ginsberg G, B Foos, RB Dzubow, M. Firestone (2010) Options for incorporating children's inhaled dose into human health risk assessment. Inhalation Toxicology 22(8): 627-47.
- Ginsberg GL, B Asgharian, JS Kimbell, JS Ultman, AM Jarabek (2008) Modeling approaches for estimating the dosimetry of inhaled toxicants in children. Journal of Toxicology and Environmental Health 71(3): 166-95.
- S. Environmental Protection Agency (2008) National Ambient Air Quality Standards for Lead: Final Rule. Federal Register 73 (219): 66964-67062.
- S. Environmental Protection Agency (2006) National Ambient Air Quality Standards for Particulate Matter: Final Rule. Federal Register 71 (200): 61143-61233.
- Kajekar R (2007) Environmental factors and developmental outcomes in the lung. Pharmacology & Therapeutics 114(2): 129-45.
- Islam T, K Berhane, R McConnell, WJ Gauderman, E Avol et al. (2009) Glutathione-S-transferase (GST) P1, GSTM1, exercise, ozone and asthma incidence in school. 64(3): 197-202.
- McConnell R, K Berhane, F Gilliland, SJ London, T Islam et al. (2002) Asthma in exercising children exposed to ozone: A cohort study. Lancet 359(9304): 386-91.
- Clark NA, PA Demers, CJ Karr, M Koehoorn, C Lencar et al. (2010) Effect of early life exposure to air pollution on development of childhood asthma. Environmental Health Perspectives 118(2): 284-90.
- Pierre D (2011) Experimental determination of the dry deposition rate of submicron aerosols in the natural environment: influence of granulometry, micrometeorological parameters and cover.
- Radha G, Mukesh K (2011) Indoor air quality modeling for PM10, PM2.5, and PM1.0 in naturally ventilated classrooms of an urban Indian school building May. Environnemental Monitoring and Assessment 176(4):501-516.
-
Olu-Arotiowa Olusesan Abel, Ajani Ayobami Olu, Jimoda Lukuman Adekilekun, Akande Gabriel Opeyemi and Raji Wuraola Abeke. Quantification of Mass Concentrations Aerosols PM2.5 from Secondary Schools in Ogbomoso Glob J Eng Sci. 9(4): 2022. GJES. MS.ID.000718. DOI: 10.33552/GJES.2022.09.000718.
-
Particulate matter, Concentration, Ventilation, Outdoor, Indoor, Air
-

This work is licensed under a Creative Commons Attribution-NonCommercial 4.0 International License.


