 Research Article
Optimal Spacing of the Wolfcamp in the Delaware Basin
Ahmed Alzahabi1*, A Kamel1, A Harouaka1 and A Alexandre Trindade2
1Petroleum Engineering Department, University of Texas-Permian Basin, Odessa, TX, USA
2Department of Mathematics and Statistics, Texas Tech University, Broadway and Boston, Lubbock, USA
Ahmed Alzahabi, Petroleum Engineering Department, University of Texas-Permian Basin, Odessa, TX, USA.
Received Date: February 23, 2021; Published Date: March 22, 2021
Abstract
Proper well spacing for horizontal wells is one of the missing pieces for the Delaware Basin development in the Wolfcamp Formation. In the Wolfcamp formation in the Delaware Basin, well spacing varies with formation characteristics (rock and fluid) across the Basin. Finding the spacing intervals between horizontal wells right is crucial to maximizing productivity and estimated ultimate recovery (EUR) while avoiding detrimental frac hits and cross-well pressure and fluid interference during stimulation and production.
Along with the various parameters affecting development, well patterns and completion methodologies are having the highest impact. Both parameters show a significant impact on the drainage area of wells and may in turn affect optimal spacing between the wells. The model outcomes are expected to improve recovery efficiency, oil production, and minimize detrimental frac hits and cross-well pressure and fluid interference during stimulation and production. A pool of private production and spacing data were analyzed in conjunction with data analytics. This step led to a newly developed model to optimize well spacing.
The work may lead to an optimal spacing for the stacked Delaware Basin, and contribute to a better understanding of infill Wolfcamp child wells relative their offset parent wells. Our model within the Wolfcamp may be applied to various sections and formations across the Permian Basin. Current workflows and spacing advisors require use of numerical reservoir simulation and fracture simulation. Drainage area, spacing, reserves, recovery factors, and fracture height and width are the main unknown variables in unconventional plays. Application of data analytics with production, spacing, life of the well on production, and completion data is anticipated to resolve some of these issues.
Nomenclature
• Kf= fracture permeability
• wfp= propped fracture closed width
• 200, 100, 40/70, 30/50, 20/40, 30/70 = a descriptor used to describe the size of the proppant being pumped.
• Age = the difference in number of days between the time the well was completed and 01/01/2001.
• Avg. Prop. Concentration = the lbs of proppant pumped per fluid gallons pumped.
• Avg. Rate = the average rate at which the mixture is pumped downhole to create the fractures.
• Cluster spacing = the distance between the clusters within the stage.
• Cluster = a set of perforations arranged in a certain pattern to achieve the optimal completion.
• Clusters per stage = the number of clusters used in each stage.
• Comp Date = the date the well was completed.
• Completed feet = the calculated distance between the top perf and bottom perf where the fractures occur.
• County = the county where the well was drilled.
• County Variable = a numeric variable to distinguish between counties.
• Degradation = the amount of overlap divided by total rectangular area.
• Fluid Bbls = the amount of fluid pumped downhole to initiate fracture and place proppant.
• Fluid Gal/Cluster = the amount of fluid pumped per cluster.
• Fluid Gal/Ft = fluid volume in gallons per foot.
• Fluid Gal/Ft = the amount of fluid pumped per completed foot.
• Fluid Gal/Perf = the amount of fluid pumped per perforation.
• GOR Ratios = a metric used to determine the amount of gas produced per oil produced (SCF/STB).
• IP = initial production rates.
• IP = the amount of oil produced by a new oil well, measured in B/D (barrels of oil per day) or BOE/D (barrels of oil equivalent per day).
• IP 30, 90, & 180 = calculations taking a rolling average by number of days described (30, 90, or 180) and then using the maximum value obtained for oil, gas and water.
• ISIP/Ft = instantaneous shut in pressure once a stage has been completed and frac pumps are shut down.
• Linear Gel = a fracturing fluid supplemented with different polymers which increase its ability to carry proppant.
<• Max Prop. Concentration = the proppant concentration begins with mostly fluid and then is built up to a maximum concentration of pounds of proppant per fluid gallon.
• Max. Rate = the maximum rate achieved pumping mixture into fractures.
• Number of stages = Whenever a plug is set, perforations are created, the reservoir is fractured with fluid, and then another plug is set, it is called a stage.
• Oil, Gas, MBOE EUR= the estimated ultimate recovery of oil and gas, MBOE – Oil + Gas/6.
• Perfs = the number of holes created from the charges that are inserted downhole in sets of perforations called clusters designed in different patterns to achieve optimal completion.
• Perfs/Clusters = the number of perforations used in each cluster.
• Prop. Lbm = the amount of proppant pumped with the fluid to keep the created fractures open.
• Prop. Lbm/Cluster = the amount of proppant pumped per cluster.
• Prop. Lbm/Ft = the amount of proppant pumped per completed foot.
• Prop. Lbm/Perf = the amount of proppant pumped per perforation.
• Proppant Lbm = Mass of proppants
• Rate/Cluster = the average rate per cluster.
• Rate/Ft = the average rate per completed foot.
• Rate/Perf = the average rate per perf.
• Reservoir = the formation in which the lateral was drilled (i.e. Wolfcamp A, Wolfcamp LA, Wolfcamp MA).
• Reservoir = the formation that the lateral was drilled (i.e. Wolfcamp A, Wolfcamp LA, Wolfcamp MA).
• Reservoir Variable = a numeric variable distinguishing between reservoirs Wolfcamp C-D and Wolfcamp A.
• Reservoir Variable = a numeric variable distinguishing between reservoirs Wolfcamp C-D and Wolfcamp A.
• ROA= Rectangular Overlap Area: the area of overlap from wells in the same section with one another determined by their legal spacing location. Assuming a Xf off 770’ and Hf of 200’ and rectangular drainage area.
• Slickwater = water with chemicals added to speed up the rate at which it can be pumped to create more fractures.
• Stage length = the length of each stage, a good indicator for normalizing stages for lateral length.
• TVD = the furthest vertical depth drilled.
• UWI = a unique well identifier for every well; each set of numbers stands for a unique location and well identifier (i.e. county, state, horizontal, pilot).
• WCUT = Water cut; a metric used to determine the amount of water produced per oil produced. (Water / (Water + Oil)).
• Yield= Condensate yield, MMSCF/STB.
Keywords: Optimal production; Wolfcamp formation; Fracture driven interaction; Well spacing
Introduction
The paper is to develop a thorough understanding of proper well spacing and to propose a methodology for optimization in tight rocks. Production well interference due to fracture driven interaction (FDIs) may occur between child and parent wells especially if the distance between the wells is narrow. This interference must be avoided to reduce the significant negative impact on productivity and estimated ultimate recovery (EUR) of the producing wells. The impact of these interactions is sophisticated and requires numerical modeling to account for fracture propagation and depletion effects due to varied spacing sets (Kan et al. 2019). Examining numerous cases of Improper spacing has caused well interference and FDIs in horizontal wells in the Wolfcamp section in both the Delaware and Midland basins. Nearly 10% of these cases have resulted in critical productivity loss.
The EUR is certainly a function of many parameters including fracture and well spacings. These variables include but are not limited to [1]: Completion style (Open hole, cased hole, etc.);In-situ stresses and stress regimes, and faulting ; Wellbore lateral length and number; Fracturing fluid and proppant size, concentration, and type; Fracture job design parameters (i.e. injection rate, volume, rheology, additives, fracture conductivity, leak coefficient); Formation characteristics and rock mechanical properties (i.e. permeability, porosity, formation density, initial reservoir pressure, Young’s Modulus, Poisson’s ratio, Biot’s constant); Reservoir fluid properties; Decline rate of wells, which is dependent on the depletion strategy.
limited to [1]: Completion style (Open hole, cased hole, etc.);In-situ stresses and stress regimes, and faulting ; Wellbore lateral length and number; Fracturing fluid and proppant size, concentration, and type; Fracture job design parameters (i.e. injection rate, volume, rheology, additives, fracture conductivity, leak coefficient); Formation characteristics and rock mechanical properties (i.e. permeability, porosity, formation density, initial reservoir pressure, Young’s Modulus, Poisson’s ratio, Biot’s constant); Reservoir fluid properties; Decline rate of wells, which is dependent on the depletion strategy.
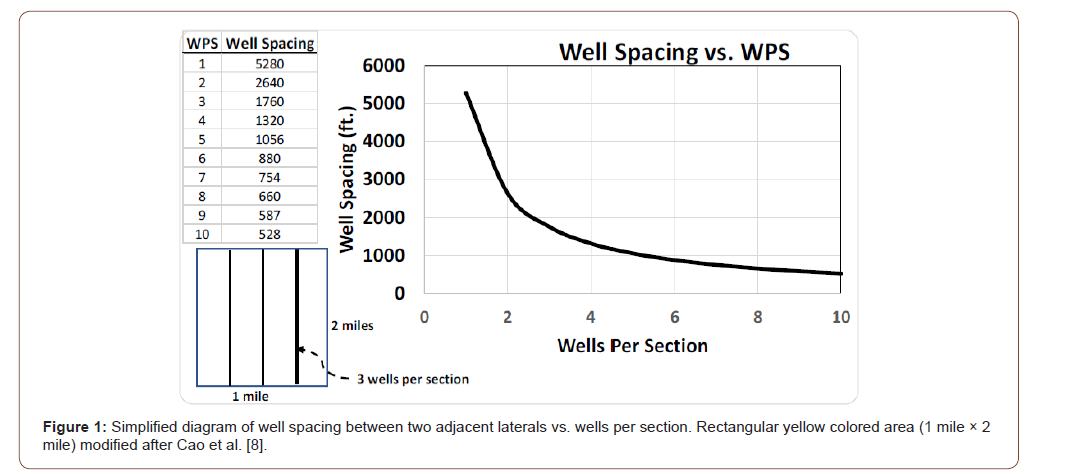
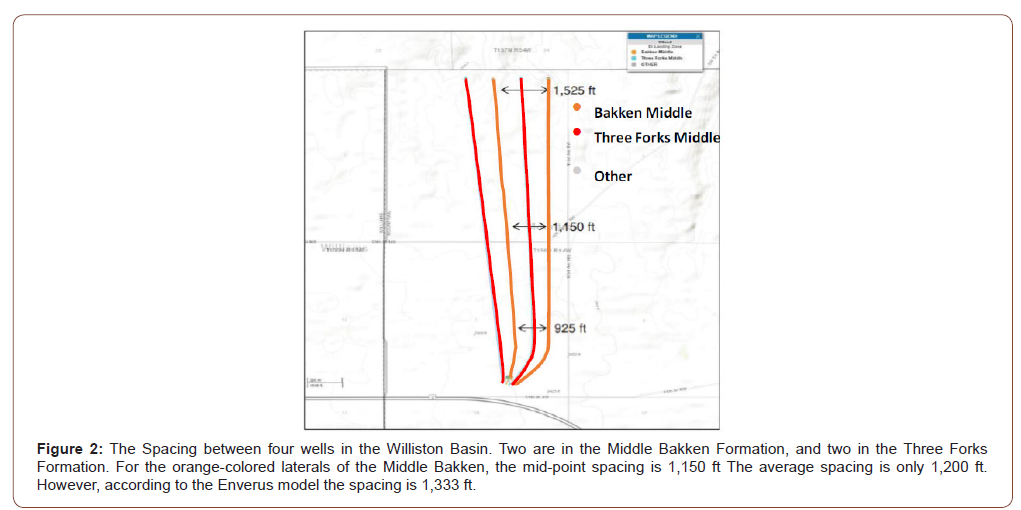
Figure 2 also shows how various methods can be used to determine well spacing in unconventional developments.
A narrative about the Delaware Basin development warrants the following questions:
1. What is the minimum and maximum spacing between horizontal wells?
2. What is the optimum number of wells per section to avoid FDI?
3. Does spacing affect horizontal well EUR?
Increasing spacing between parent and child wells can improve EURs per well to a point, but on the other hand, production per section/lease will decrease as fewer wells are drilled to drain the section, potentially leaving the reservoir volume under stimulated.
Since the shift from vertical to horizontal wells, more than 3,000 horizontal wells have been drilled and completed in the Midland Basin, Wolfcamp section. This is in addition to more than 1400 wells in the Delaware Basin, Wolfcamp Formation [3].
Proper well spacing is critical for successful development of unconventional resources. Numerous studies have been conducted on spacing of horizontal wells in unconventional reservoirs [1,4- 23].
This paper introduces a new model as an attempt to better understand spacing effectiveness. The model can be used to quickly predict the optimum spacing of horizontal wells in the Permian Basin, Wolfcamp Formations. In developing the model, we considered 201 horizontal wells, obtained from private parties for the Permian Basin, Wolfcamp A through D.
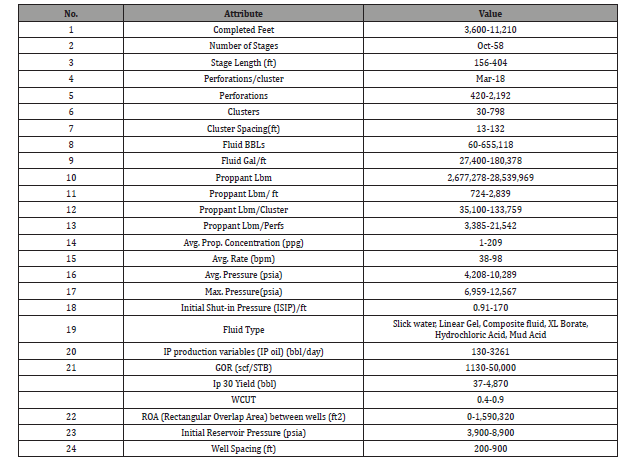
To predict spacing (the dependent variable) in that model, the following pool of independent (or input) variables was considered: County, depth, oil EUR, IP 30 oil, IP 60 oil, volume of the injected fluid in bbl., gas EUR, IP 30 gas, IP 60 gas, GOR, gas yield, well number of days in production, number of pounds of proppant, BOE per well, cumulative oil, cumulative gas, TVD (True vertical depth), injected fluid in gal/ft, IP 180 oil. The completion data ranges, obtained from private sources, to develop the model are summarized in Table 1. The spacing model introduced correlates the spacing variable Rectangular Overlap Area (ROA) to the wells EUR.
Table 1:Range of completion parameters used to develop the model.
We used analytics (Scatter-diagram smoothing) to develop a relationship between two dependent variables EUR and IP over 150 days and Rate of overlap (See Eqs. 1 through 5, Appendix A) among laterals. The study demonstrates the effect of stacked reservoirs on EUR and IP 150 oil. The interactions can help us understand the relationship between the planning of older and newer wells.
Recent Advancements in Well Spacing
There is no simple formula to guide proport well spacing in the Permian Basin. Defeu et al. [24], considering data from Wolfcamp shale play in the Delaware Basin, one study found that when a child well was drilled within 1,000 feet of an older well, the parent outperformed the new child by 66%. When the comparison was adjusted for high-intensity completions with higher fluid and proppant volumes, 79% of older Wolfcamp wells performed better than offset child wells. If well density or lateral spacing is too tight, it could lead to negative well interference issues between neighboring laterals from fracture-driven interactions (FDIs), or frac hits, which could degrade the productivity and recovery factors of parent and infill wells.
It is well known in the industry that an increase in well spacing lowers the wells EUR [24]. The wider the spacing the higher the EUR per well to a point, but production per section (lease) drops as fewer wells are drilled to drain the section.
Estimated ultimate recovery of wells (EUR) usually increases with the increase in number of stages. As the number of fracture stages increases, the efficiency of incremental stages decreases in the Bakken shale Formation [25]. Beyond a certain number, therefore, the incremental cost would exceed the incremental benefits.
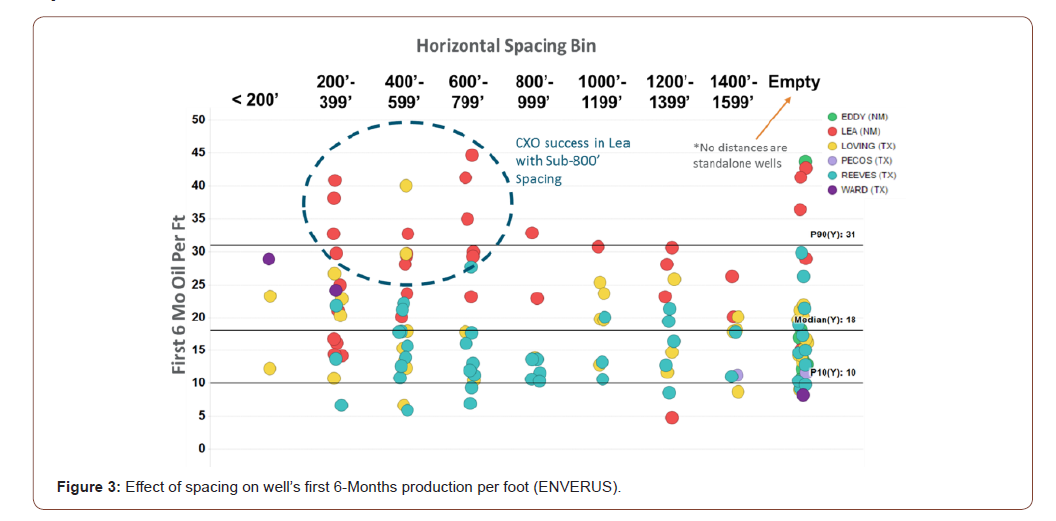
A study by Hart Energy and ENVERUS on the Wolfcamp A, shows multiple spacing tests done by operators in the DOMINATOR area in Lea County, New Mexico. Despite the risks associated with the tight spacings (<200 ft) used in the project, more testing (numerically and analytically) is needed to push the boundaries of spacings to determine with an optimum range (Figure 3). Shows the effect of Wolfcamp-A linear spacing on productivity. The figure demonstrates the recommended range of 200-800 ft.
A study done by Hart Energy on 180 horizontal wells in the Eagle Ford shale play used a geospatial approach to estimate well spacing rather than measuring interwall footage. The pseudo-drainage area is calculated using vector geometry algorithms (Figure 4). Wells with tighter spacing showed poorer performance (well profile). On the other hand, wells with 200-400 acres spacing are the best performing wells. In this slice of the Eagle Ford shale, well spacing seems to have an important effect on performance, particularly when wells have less than 200 acres (drainage area) available to drain. The modeling of three wells from East Texas, with spacing between the middle and two offset laterals increasing from 1000 to 2500 ft in 500-ft increments, showed that the highest NPVs are correlated to a lateral stage spacing between 360 and 385 ft [26].
Table 2 demonstrates variations in well spacing as practiced by many operators in various basins across North America. The variation of spacing is used in shales of Permian Wolfcamp, Marcellus, Bakken, Eagle Ford and Anadarko Woodford.
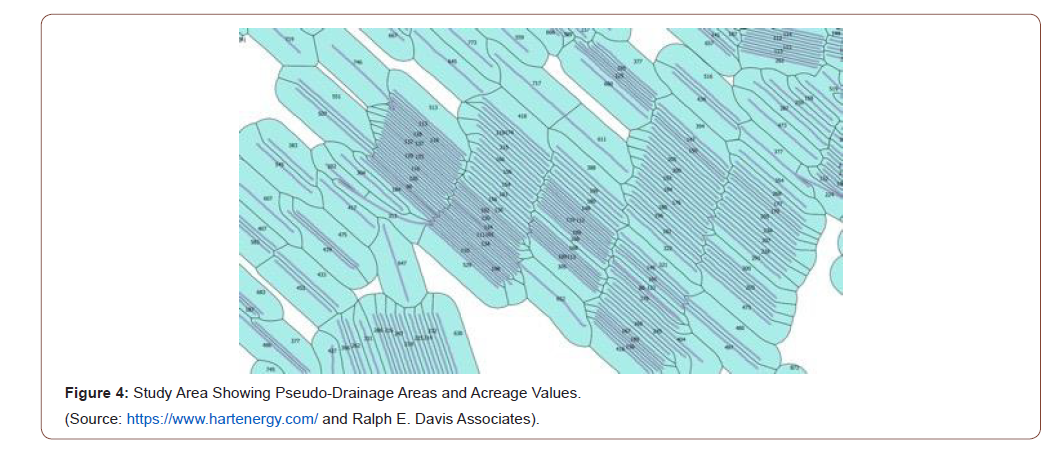
Table 2:Various well-spacing parameters commonly implemented in various basins.

New Analytical Workflow
The workflow involves two main stages
• A global model that predicts EURs and initial production for Delaware Basin Wolfcamp wells for the first 150 days of using nonparametric regression and scatter diagram smoothing (Hastie et al. 2015); and
• Testing of the model using both in-sample test data and publicly available Wolfcamp data.
A pool of independent (input) variables from the well dataset was analyzed to develop the model and predict optimal spacing (the dependent variable). Some of the variables considered were oil and gas EUR, initial and cumulative oil and gas production, gasto- oil ratios, pounds of proppant, true vertical depth, injected fluid volume, etc. The spacing model correlates the spacing variable “rectangular overlap area” (ROA) to the well EUR and IPs. While we fitted a global model to the output, we only report the results of the model for ROA in this paper.
Rectangular Overlap Area (ROA)
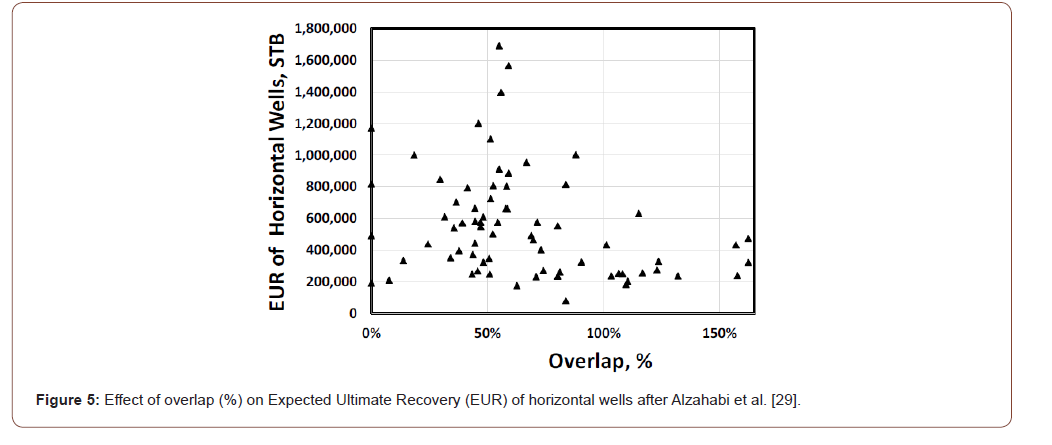
A software was used to calculate the stacked spacings. Well locations and Total Vertical Depth (TVD), and min and max values of Xf and Hf were used to determine ROA. Eqs. 1 through 5 and Figures B1 and B2 in the Appendix A illustrate spacing calculations. Figure 5 shows that EUR declines with the increase of overlap between horizontal wells due to interference. There is a linear relationship initially between EUR and overlap for an overall range of 0-50 %, then decreases sharply due to increase in well communications.
EUR and cumulative IP regression model
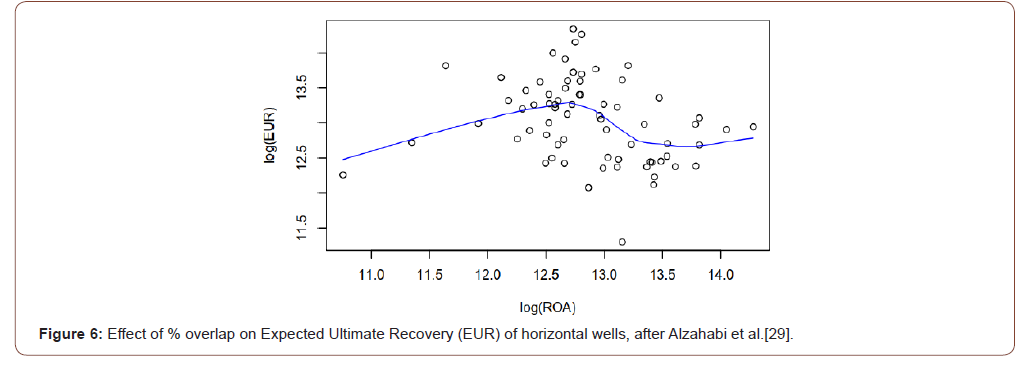
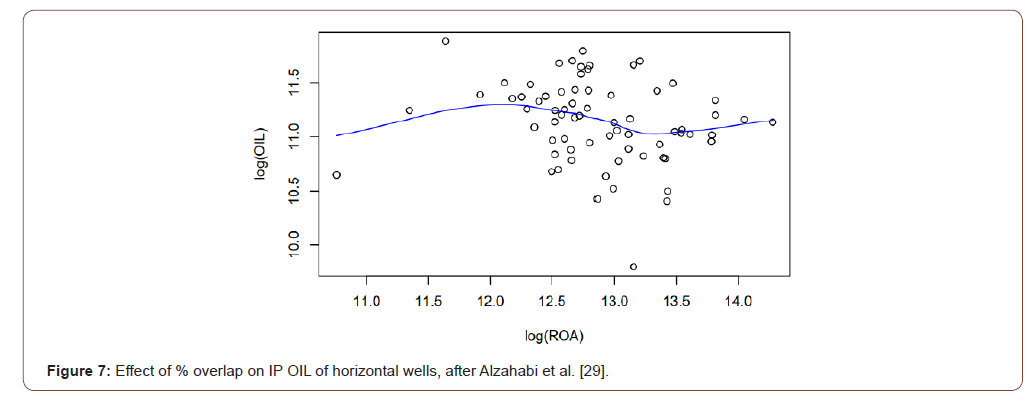
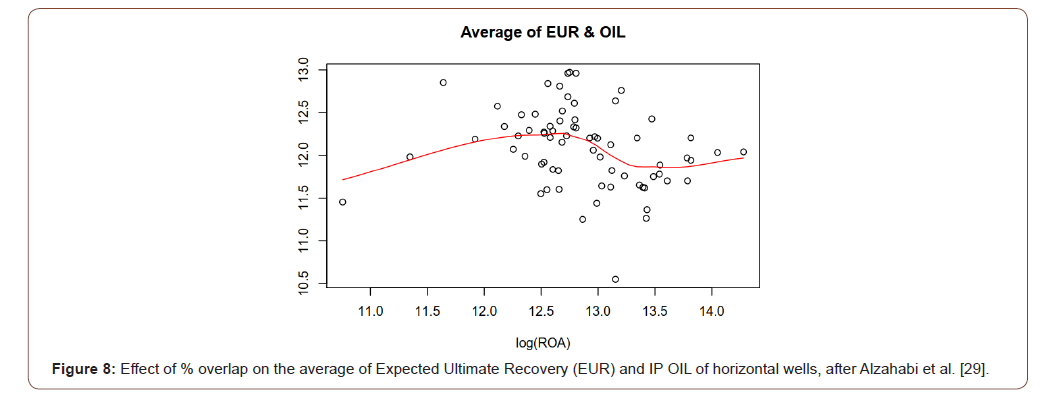
Figures 6 and 7 show log-scale scatterplots of ROA vs. EUR and IP OIL (Initial Production of Oil for 150 days), smoothed via the LOESS (locally estimated scatterplot smoothing) algorithm of Cleveland [27]. Figure 8 is similar, except the y-axis is the average of EUR and IP OIL. These plots suggest that maximum values for both ROA and IP OIL are obtained when log (ROA) is approximately 12.5, which implies an optimum ROA of approximately exp (12.5) = 268,337 ft2. The results show a good correlative fit (95% confidence interval) between 150-day oil IP and EUR, and at least in this area of the Delaware Basin, the relationship between spacing (ROA) and well performance is clear [28-35].
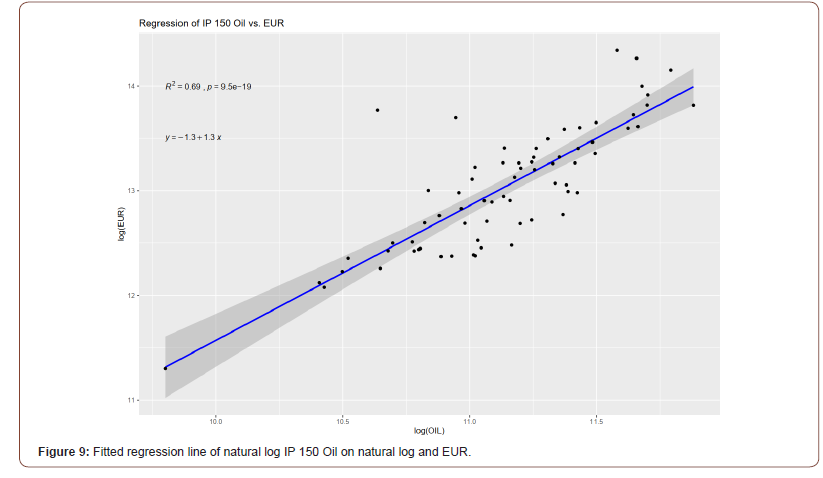
The question here is whether to use IP of oil for 150 days or EUR. One school of thought maintains the initial rolling average of oil production is an indication of well potential. Another one maintains that EUR is the scale to be used to measure well performance. Figure 9 shows a good fit (R2=0.69). The shaded band is a 95% confidence interval for the two parameters line. In this area of the Delaware Basin, the relationship between well spacing (ROA) and well performance is clear [36-54].
Conclusion
The main goal of the paper was to introduce a model to correlate well-spacing variable with two production metrics. We used the available pool of data of a total of 200 horizontal wells (privately owned) in the Wolfcamp to guide developing the model. Our study concludes the following.
Maximum values for both EUR and IP OIL are obtained when log (ROA) is approximately 12.5, which implies an optimum ROA of approximately exp (12.5) = 268,337 ft2.
EUR drops with the increase in overlap between horizontal wells due to interference. EUR shows a linear relationship initially for an overall range of 0-50 %, then decreases sharply due to increase in the communications.
The work suggests the higher the overlap (ROA>60%) between wells, the lower expected IP for 150 days and EUR from the well. This leads to a spacing of 10 acres. This leads to a development spacing of 10 acres, This leads to linear spacing between laterals of 1580 feet.
The results show a good correlative fit (95% confidence interval) between 150-day oil IP and EUR, and at least in this area of the Delaware Basin, the relationship between spacing (ROA) and well performance is clear.
Acknowledgement
The authors would like to acknowledge the kind assistance through fruitful discussion with Wade Baustian from Camino Natural Resources and Cimarex for providing the data used in this work.
This paper is a modified reprint by permission from URTeC, whose permission is required for further use.
Conflict of Interest
No conflict of interest.
References
- Ziarani AS, Chen C, Cui A, Quirk DJ, Roney D (2014) Fracture and Wellbore Spacing Optimization in Multistage Fractured Horizontal Wellbores: Learnings from Our Experience on Canadian Unconventional Resources. International Petroleum Technology Conference.
- Enverus (2020) Drillinginfo is now Enverus | A new name to reflect our future.
- Gaswirth SB (2017) Assessment of continuous oil resources in the Wolfcamp shale of the Midland Basin, Permian Basin Province, Texas, 2016: U.S. Geological Survey Open File-Report 2017-1013, 14 p.
- Alrashed A, Miskimins J, Tura A (2019) Optimization of Hydraulic Fracture Spacing Through the Investigation of Stress Shadowing and Reservoir Lateral Heterogeneity. Society of Petroleum Engineers.
- Awada A, Santo M, Lougheed D, Xu D, Virues C (2016) Is That Interference? A Workflow for Identifying and Analyzing Communication Through Hydraulic Fractures in a Multiwell Pad. Society of Petroleum Engineers.
- Belyadi H, Smith M (2018) A Fast-Paced Workflow for Well Spacing and Completions Design Optimization in Unconventional Reservoirs. Society of Petroleum Engineers.
- Cao R, Chen C, Li R, Firincioglu T, Ozgen C, et al. (2018) Integrated Stochastic Workflow for Optimum Well Spacing With Data Analytics, Pilots, Geomechanical-Reservoir Modeling, and Economic Analysis. Unconventional Resources Technology Conference.
- Cao R, Li R, Girardi A, Chowdhury N, Chen C (2017) Well Interference and Optimum Well Spacing for Wolfcamp Development at Permian Basin. Unconventional Resources Technology Conference.
- Cullick AS, Carrillo M, Clayton C, Ceyhan I (2014) Well-spacing Study to Develop Stacked Tight Oil Pay in Midland Basin. Society of Petroleum Engineers.
- Feder J (2019) Optimization Workflow Maximizes Value of Unconventional Fields. Society of Petroleum Engineers 71(10): 55-56.
- Fowler G, McClure M, Cipolla C (2019) A Utica Case Study: The Impact of Permeability Estimates on History Matching, Fracture Length, and Well Spacing. Society of Petroleum Engineers.
- Karam P, Yang J, Cozyris K, Stephenson T, An X, et al. (2019) Well Spacing and Landing Zone Optimization to Improve Development Strategy - A Case Study from the Stack. Society of Petroleum Engineers.
- McClure MW, Kang CA (2018) Applying a Combined Hydraulic Fracturing, Reservoir, and Wellbore Simulator: Staged Field Experiment #3, Cluster Spacing, and Stacked Parent/Child Frac Hits. Society of Petroleum Engineers.
- Orozco D, Aguilera R (2017) Use of Dynamic Data for Estimating Average Reservoir Pressure, OGIP, and Optimum Well Spacing in Shale Gas Reservoirs. Society of Petroleum Engineers.
- Pankaj P (2018) Characterizing Well Spacing, Well Stacking, and Well Completion Optimization in the Permian Basin: An Improved and Efficient Workflow Using Cloud-Based Computing. Unconventional Resources Technology Conference.
- Pettegrew J, Qiu J, Zhan L (2016) Understanding Wolfcamp Well Performance - A Workflow to Describe the Relationship between Well Spacing and EUR. Unconventional Resources Technology Conference.
- Tang Y, Liang B (2015) Reservoir Surveillance Pilot Study for Midland Basin Tight Oil Spacing Optimization. Society of Petroleum Engineers.
- Tian C, Lei Z, Jiang Q, Chang T, Chen D, et al. (2019) Optimizing Well Spacing and Fracture Design Using Advanced Multi-Stage Fracture Modeling and Discrete Fractured Reservoir Simulation in Tight Oil Reservoir. Society of Petroleum Engineers.
- Wilson J, Verkhovtseva N (2019) Applying Multiple Diagnostic Technologies to Understand Well Spacing. Society of Petroleum Engineers.
- Xiong H, Liu S, Feng F, Liu S, Yue K (2019) Optimize Completion Design and Well Spacing with the Latest Complex Fracture Modeling & Reservoir Simulation Technologies - A Permian Basin Case Study with Seven Wells. Society of Petroleum Engineers.
- Xu T, Lindsay G, Zheng W, Yan Q, Escobar Patron K, et al. (2018) Advanced Modeling of Production Induced Pressure Depletion and Well Spacing Impact on Infill Wells in Spraberry, Permian Basin. Society of Petroleum Engineers.
- Yu W, Sepehrnoori K (2014) Optimization of Well Spacing for Bakken Tight Oil Reservoirs. Unconventional Resources Technology Conference.
- Yu W, Xu Y, Weijermars R, Wu K, Sepehrnoori K (2017) Impact of Well Interference on Shale Oil Production Performance: A Numerical Model for Analyzing Pressure Response of Fracture Hits with Complex Geometries. Society of Petroleum Engineers.
- Defeu C, Garcia Ferrer G, Ejofodomi E, Shan D, Alimahomed F (2018) Time Dependent Depletion of Parent Well and Impact on Well Spacing in the Wolfcamp Delaware Basin. Society of Petroleum Engineers.
- Temizel C, Energy A, Purwar S, Abdullayev A, Urrutia K, et al. (2015) Efficient Use of Data Analytics in Optimization of Hydraulic Fracturing in Data-Driven Analytics.
- Malayalam A, Bhokare A, Plemons P, Sebastian H, Abacioglu Y (2014) Multi-Disciplinary Integration for Lateral Length, Staging and Well Spacing Optimization in Unconventional Reservoirs. Unconventional Resources Technology Conference.
- Cleveland, William S (1979) Robust locally weighted regression and smoothing scatterplots. Journal of the American Statistical Association 74: 829-836.
- Aibazarov M, Kaliyev B, Mutaliyev G, Vignati E, Gulyaev D, et al. (2019) Well Spacing Verification at Gas Condensate Field Using Deconvolution Driven Long-Term Pressure and Rate Analysis (Russian). Pp. 1-15.
- Alzahabi A, Kamel A, Trindade AA, Baustian W (2020) Optimal Spacing for the Wolfcamp in the Delaware Basin using Data Analytics: A Case Study. SPE/ARMA American Rock Mechanics Association 2020, ARMA 20-1317.
- Alzahabi A, Kamel A, Harouaka A, Trindade A (2020) Model Predicts Optimal Wolfcamp Well Spacing. AOGR.
- Alzahabi A, Kamel A, Harouaka A, Trindade A (2020) A Model for Estimating Optimal Spacing of the Wolfcamp in the Delaware Basin. Paper presented at the SPE/AAPG/SEG Unconventional Resources Technology Conference.
- Aniemena C, LaMarca C, Labryer A (2019) Well spacing optimization in shale reservoirs using rate transient analytics. SPE/AAPG/SEG Unconventional Resources Technology Conference, pp. 1-20.
- Bhattacharya S, Lake E, Liu X, Dombrowski R, Cao R, et al. (2018) Increase Net Present Value and Reduce Completion Cost by Using an In-House Automated Fracture Design, Reservoir Simulator and Optimization Workflow for Well Spacing and Completions Design. Unconventional Resources Technology Conference.
- Cao R, Li R, Girardi A, et al. (2017) Well Interference and Optimum Well spacing for Wolfcamp Development at Permian Basin. URTeC - 2691962 submitted at the Unconventional Resources Technology Conference held in Autin, Texas, USA.
- Jacobs T (2018) Three Unconventional Startups Offer New Clues on Shale’s Biggest Well Spacing Mysteries. Journal of Petroleum Technology 70(9): 47-52.
- Jacobs T, Editor JPTD (2019) “Simple” Well Spacing Calculations are Inaccurate and Costly. 71(11): 33-35.
- Steve Hendrickson (2019) Measuring The Impact Of Well Spacing With Novel Geospatial Technique.
- Khodabakhshnejad A, Zeynal AR, Fontenot A (2019) The Sensitivity of Well Performance to Well Spacing and Configuration - A Marcellus Case Study. Unconventional Resources Technology Conference.
- Klimentos T, AS Harouaka, B Mtawaa, S Saner (1998) Experimental Determination of the Biot Elastic Constant: Applications in Formation Evaluation (Sonic Porosity, Rock Strength, Earth Stresses, and Sanding Predictions), SPEREE.
- Lorwongngam AO, Cipolla C, Gradl C, Cidoncha JG, Davis B (2018) Multidisciplinary data gathering to characterize hydraulic fracture performance and evaluate well spacing in the Bakken. Society of Petroleum Engineers - SPE Hydraulic Fracturing Technology Conference and Exhibition 2019, HFTC 2019.
- Lorwongngam AO, Cipolla C, Gradl C, Gil Cidoncha J, Davis B (2019) Multidisciplinary Data Gathering to Characterize Hydraulic Fracture Performance and Evaluate Well Spacing in the Bakken. Society of Petroleum Engineers.
- Murtaza M, Naeim S Al, Waleed A (2013) Design and evaluation of hydraulic fracturing in tight gas reservoirs. Society of Petroleum Engineers - SPE Saudi Arabia Section Technical Symposium and Exhibition, pp. 469-478.
- Pankaj P, Morrell JC, Pope T, Maguire M, Gray D, et al. (2018) Introducing Hydraulic Fracture Heat Maps: Deriving Completion Changes to Increase Production in the Wolfcamp Formation. Society of Petroleum Engineers.
- Pankaj P, Shukla P, Kavousi P, Carr T (2018) Determining optimal well spacing in the Marcellus shale: A case study using an integrated workflow. Society of Petroleum Engineers - SPE Argentina Exploration and Production of Unconventional Resources Symposium 2018.
- Rassenfoss S (2019) How Close is too Close? Well Spacing Decisions Come With Risks. Journal of Petroleum Technology 71(01): 28-31.
- Tanner KV, Dobbs WC, Nash SD (2019) Right-Sized Completions: Data and Physics-Based Design for Stacked Pay Horizontal Well Development. Society of Petroleum Engineers.
- Vietti WV, Thornton OF, Mullane JJ, Van Everdingen AF (1945) The Relation Between Well Spacing And Recovery. American Petroleum Institute.
- Vincent MC, Besler MR (2013) Declining frac effectiveness - Evidence that propped fractures lose conductivity, surface area, and hydraulic continuity. Unconventional Resources Technology Conference 2013, URTC 2013.
- White JB, GeoMark Re S (2017) GIS-ba New W Secon ased Inter Well Outco d White S. pp. 1-16.
- Wilson A (2018) Face-Detection Algorithm Handles Big Data To Help Identify Candidates for Restimulation. Journal of Petroleum Technology 70(10): 62-63.
- Wilson A (2018) Simulation Algorithm Benefits by Connecting Geostatistics With Unsupervised Learning. Journal of Petroleum Technology 70(10): 64-66.
- Wilson J, Verkhovtseva N (2019) Applying Multiple Diagnostic Technologies to Understand Well Spacing. Pp. 7-8.
- Brian Lidsky, Enverus Drillinginfo (2019) Permian Poised To Deliver Strong Oil And Gas Production Growth.
-
Ahmed Alzahabi, A Kamel, A Harouaka, A Alexandre Trindade. Optimal Spacing of the Wolfcamp in the Delaware Basin. Glob J Eng Sci. 7(3): 2021. GJES.MS.ID.000663.
-
Optimal production, Wolfcamp formation, Fracture driven interaction, Well spacing
-

This work is licensed under a Creative Commons Attribution-NonCommercial 4.0 International License.


