 Research Article
Malicious Android Applications’ Classification using Machine Learning
Kanwalinderjit Kaur1*, Jesal Patel2, Alex Kiss2 and Michael Walen2
1California State University, Bakers, USA
2Florida Polytechnic University, Lakeland, FL, USA
Kanwalinderjit Kaur, Department of Computer and Electrical Engineering and Computer Science, California State University, Bakers, USA.
Received Date: May 17, 2022; Published Date: May 27, 2022
Abstract
Smartphones have been an integral part of everyday life for society since their development. Naturally, the popularity of these devices has brought an equal amount of malware designed specifically for these smartphone devices. The struggle to keep these devices secure and in turn the sensitive information stored on these devices from getting into the wrong hands has become an ever-evolving endeavor. With the sheer amount of malware produced coupled with the intelligent, polymorphic nature of the malicious software, it has become increasingly difficult to protect against them. In this paper, we propose a dynamic approach to classifying malicious Android applications that does not rely solely on the signatures of said applications. Instead, we analyze the Android Manifest of the dataset to classify whether an application should be considered malicious or benign.
Keywords:APK; repackaging; Android Manifest; Smali; Dex; Dalvic executable; Google play store
Introduction
With the proliferation of smartphones within the past few years they have become a part of most cellphone users’ everyday lives [1]. Due to how integral they have become in today’s society coupled with ease of access these devices have brought to contact one another, it is only natural that these devices have very sensitive information hosted on them. Knowing this, potential attackers see these devices as very enticing targets.
What makes Android devices even more enticing to potential attackers than the other platforms are the sheer amount of them being used. According to a worldwide market share survey, 85% of smartphone devices are Android based leaving iOS devices as the second largest with 14.7% and other devices as effectively non-existent [2]. Moreover, the fact that Android based devices use Java as the coding language leaves the Android devices vulnerable to reverse engineering. This is because Java applications in general have this characteristic. Attackers have used this to their advantage and as explained by Yajin et al. [3] that 86% of malicious software developed for Android has been through repackaging attacks.
A repackaging attack is performed by downloading a known to be benign and most likely popular application, reverse engineering the code, injecting a small snippet of malicious code within the application, and finally resigning the APK with the original signature to make it resemble the original application. Thus, resulting in applications that look familiar and benign on the Google Play Store, but has malicious code hiding within them.
Related Work
The paper \Kernel-based Behavior Analysis for Android Malware Detection” by Isohara et al. focuses on using a lower level approach to malware detection. Instead of using the manifest file, it classifies malware based on system calls at the OS level of processing. It collects logs of all valuable application activity on the kernel, as well as process trees for suspicious applications, and sends them to a server so they can be analyzed. The advantage of doing this is that all applications must run through the kernel in some form or another, so even if a malicious app tries to circumvent its own analysis, the logger will have evidence of the processes being used to do so. Out of 230 popular third-party applications that were used as a sample, the logs found that 37 of the apps leaked information, 14 of them ran exploitation code, and 13 ran with the “su” command, giving the application access to other accounts. However, the server that the logs are being sent to uses a signature-based detection system of analyzing the system calls, so the accuracy of this detection method may not be as high as we want it to be.
Motivation
The majority of currently used pre-existing work in this area focuses on signature-based malware detection. While this method is very effective it requires a large database of known malware samples that must be kept up to date. Additionally, the app in question is being signed with identical signature those are same as the original benign app then it will go under the radar of the signature- based detection system. Another factor that could prove difficult to detect with this methodology is when polymorphic malware is introduced into the scenario. All these issues can be solved using a dynamic malware detection approach. Using a dynamic approach combined with machine learning can solve the issues that static signature-based detection systems have. These dynamic solutions reverse engineer the APK, examine the Dalvic Executable code contained within to determine whether the application in question is malicious or benign. The main issue with the dynamic approach is the limited resources found on mobile phones such as power consumption, CPU, memory, and storage. Keeping these limitations in mind we will take a look at alternative solutions.
Data Acquisition and Preprocessing
Working with malware detection, we need to have a baseline of benign samples with examples of known malicious samples. Our malware samples came from a combination of Koodous [4] and a collection on Github [5].
Something to keep in mind is that due to the popularity of these datasets it is also likely that static signature-based virus detection systems also use all or portions of these datasets. The APKs on these websites were double checked to be malicious using the VirusTotal tool [6] as a confirmation that these samples are indeed malicious. So, if the malicious sample is indeed malicious, it is very likely that VirusTotal will also confirm that.
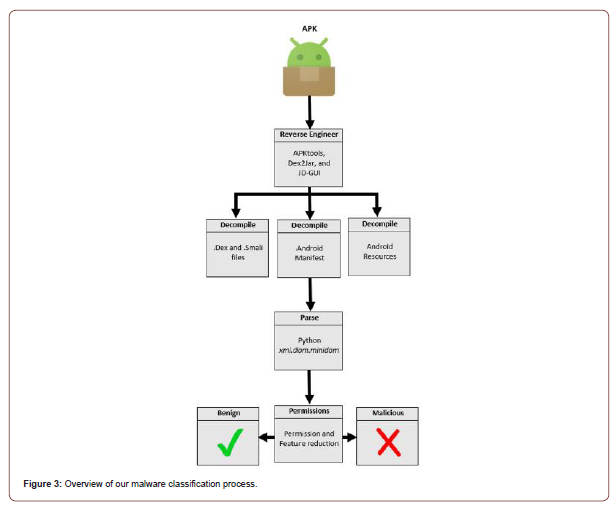
When an Android application is compiled it is referred to as an APK. A compiled APK comprises of 3 modules; the Android Manifest made up of .xml permission requests coupled with API calls, the Java code that determines the logic of the application and lastly the resource file that consists of any music, images, colors, or anything else to produce an application. When we gathered a dataset of 100 malicious APK samples, we also gathered 100 benign APK samples taken from Google Play Store [7] and once again confirmed through VirusTotal that they were benign. Once we had our samples, we began the reverse engineering process. To do this we utilized a wellknown tool known as APKTool [8] to extract the Android Manifest from an APK file. Our approach is to analyze the Android Manifest file included in every Android application that holds the permissions as well as the intent actions found within the Android Manifest. Intent Actions work as a message object that triggers an action in the component of some other app. To analyze the Android Manifest, we wrote a python script utilizing the xml.dom.minidom [9] library that parses through a Manifest file and organizes the requested permissions accompanied with the intent actions found within the application.
Malware Detection
The process of our dynamically detecting malware algorithm from an Android application’s Manifest begins with sifting through the parsed permissions, and later on intent actions, to determine correlations between certain amounts of permissions called, the frequency of those called and assign a malignancy score to the most frequent permission requests and intent actions. Then, the number of permission requests and intent actions is recorded. Finally, the malignancy score for each app is calculated, and the application is classified as benign or malicious with the Logistic Regression, kNN, and Naive Bayes algorithms.
A dataset is developed consisting of 100 malicious applications and 100 benign applications and gathered the number of occurrences of the permissions from each. This was done using our python script that utilizes the xml.dom.mindom library in combination with second script that utilizes APKTool. This second script allows us to extract the manifests of a folder of APK files and gather the permission requests to score the application (Figure 1).

Through the process of gathering this dataset it was noticed that we could cut down on the complexity of the algorithm by determining unique and infrequently used permission requests and cutting those out of the permission requests that will be considered. In doing so we were able to cut the complexity down so that we can focus resources where they will be the most useful. Table 1 shows the top occurrences of permission requests from the benign data set and Table 2 shows the top occurrences of permission requests from the malware data set.
Table 1:Occurrences of permission requests in benign data set.
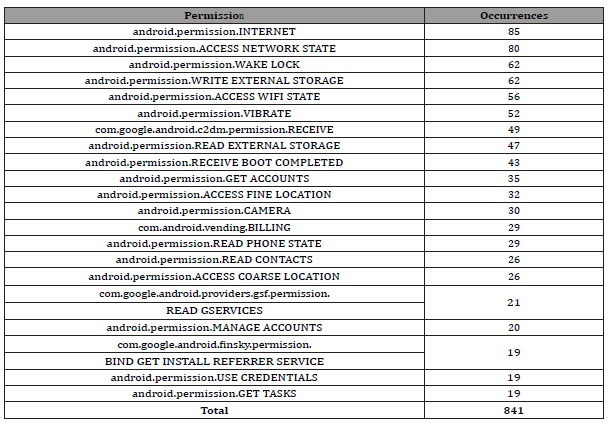
Table 2:Occurrences of permission requests in malicious data set.
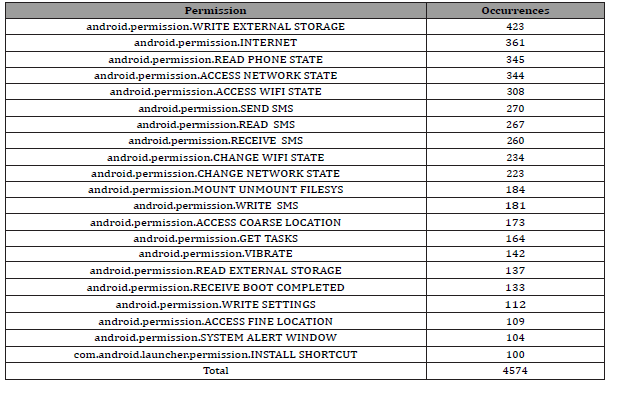
From this data, we observe that the malware dataset had about 443.9% more permission requests than the benign dataset. This is likely due to some manifests having duplicate permission requests. Requesting a permission that has already been requested before, has no effect on changing the approval or denial status of that permission. Therefore, the max number of requests for a particular permission should be as the number of APKs (Table 3).
Table 3:Scores assigned to permissions.
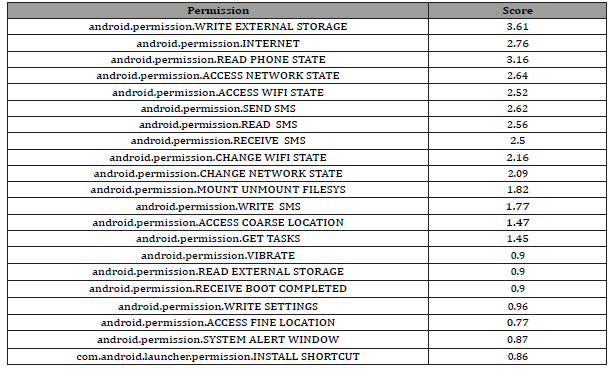
In this research the number is 100 for both datasets. The next step in our malware detection process is to assign a malignancy score to the app. To do this, we first assign a malignancy score to each of the permission requests in Table 4. The score for each permission request is calculated using the following Eq. 1. n represents the number of APKs.

Shown below in Table 3 are the scores that were calculated.
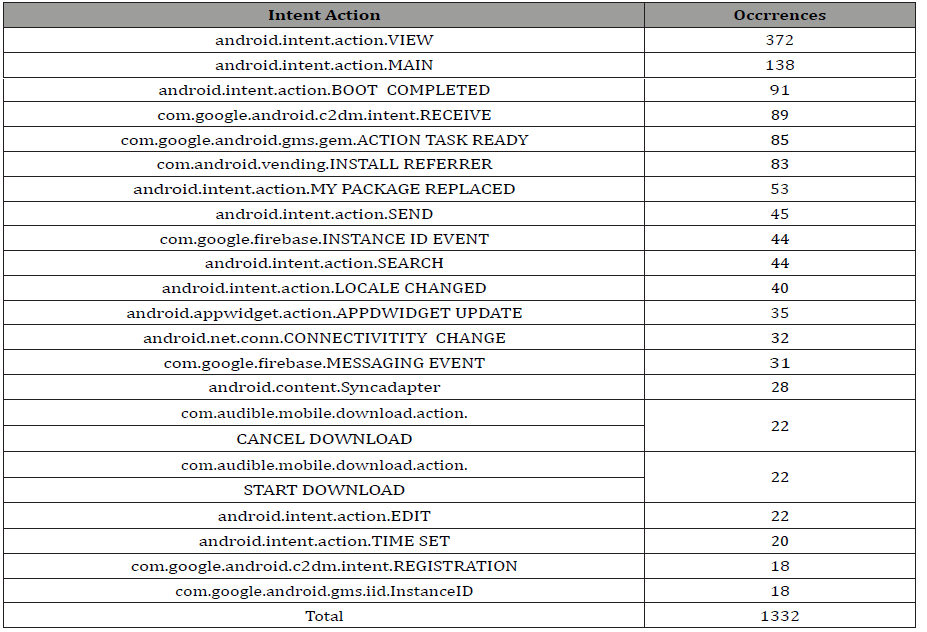
Table 4:Occurrences of intent actions in benign data set.
Next, the number of permission requests found in an app’s manifest are recorded. The malignancy score for an app is then calculated by adding up the scores of each scored permission found in the app’s manifest .
From the results of the algorithms, it was decided that another
attribute besides the number of permission requests and the permission
request score for each app is required. The results from the
algorithms for only permission requests are presented in the Results
and Analysis section. We limited our search to items that are
found in the Android Manifest le to make the implementation consistent.
It was found that intent actions would be the best addition
to the malware detection process. Intent actions are an attribute of
an item found within the Android Manifest called an intent filter. Intents
are a data structure that allows for an Android app to request
actions from other apps. Two types of intents exist: explicit and implicit.
Where, explicit intents specify the app that will perform the
action and implicit intents do not specify the app that will perform
the action, but rather the action that is being requested. Implicit
intents are specified using intent filters [10]. The actions that the
intent filters specify are under the
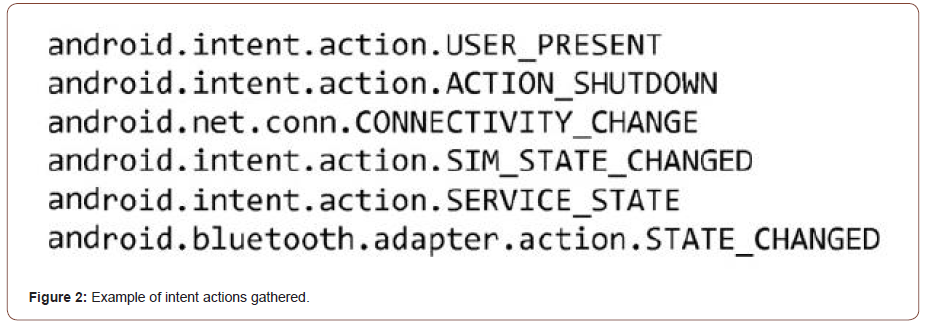
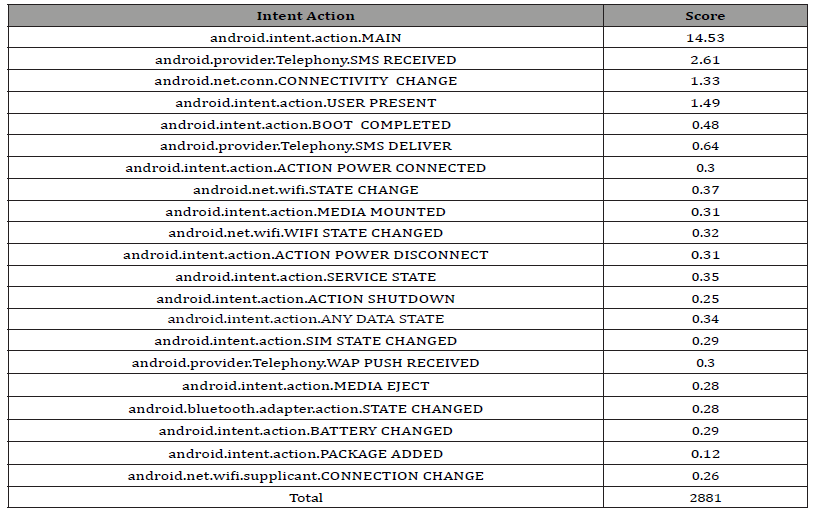
Shown in Table 4 and 5 are the occurrences of the most frequent intent actions of both data sets. With this data, it was noticed that both data sets have intent actions that exceed 100 occurrences. Unlike permission requests however, duplicate intent actions are justified because there could be multiple interactions in an app that perform the same action. Despite this, it was decided to use the same scoring method as the permission requests because most of the occurrences came from a few intent actions. Most notably, about 55.2% of the occurrences of the malware data set came from one intent action: MAIN. So, it was concluded that the use of this intent action is common in malware, and that the previous scoring method would be able to reflect that. The calculated scores are shown below in Table 6.
Table 5:Occurrences of intent actions in malicious data set.
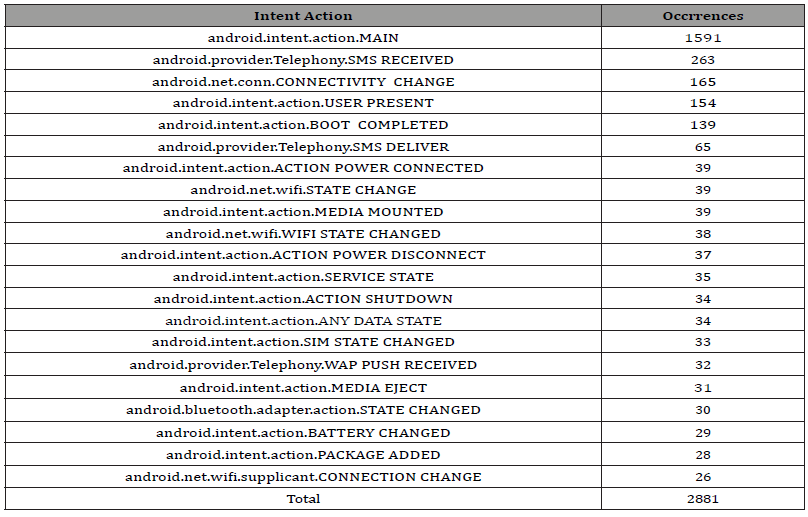
Table 6:Scores assigned to intent actions.
Various Parameters
The parameters that are used to compare this experiment with previous Android Malware research are given as follows:
• TPR representing True Positive Rate
• FPR representing False Positive Rate
• Accuracy
• Area under the ROC curve
• Precision
• Recall
• F1-score
TPR computes if the given vector supports in detecting malware.

True Positives representing TP is how many malwares are classified correctly. False Negatives representing FN is how many malwares are classified incorrectly.
FPR computes if a benign app is falsely detected as malware.

False Positives representing FP is how many benign apps are classified incorrectly. True Negative representing TN is how many benign apps are classified correctly.
Accuracy is how many benign apps and malware apps are classified correctly.

If the TPR is high and the FPR is low that means algorithm has a good performance. An algorithm with good performance will have an accuracy closer to 1.
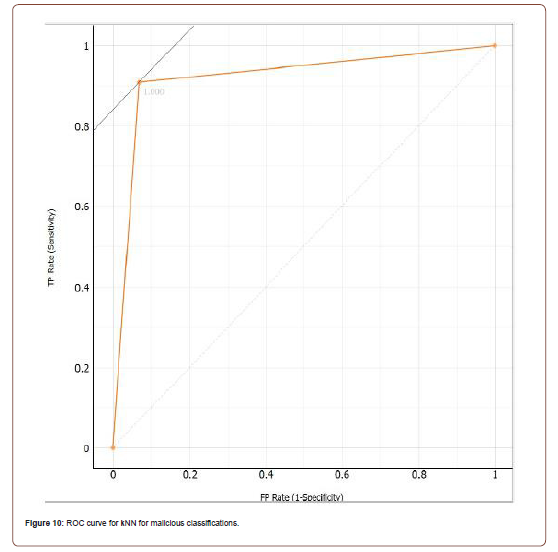
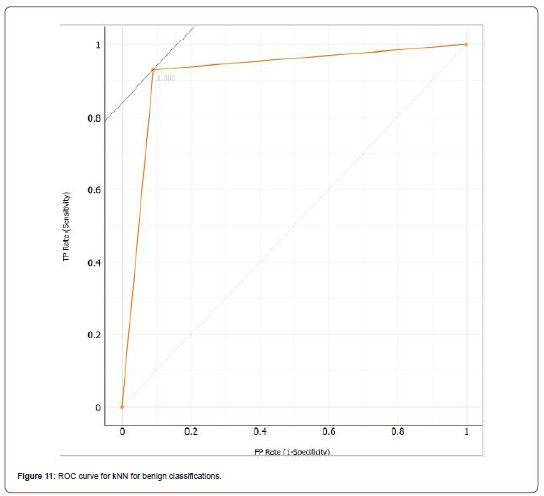
This will be displayed in the ROC curve. If this curve is closer to the axis of TPR and TPR 1, then the algorithm has good performance. The area under the curve will show how well the classifier can distinguish each class. Precision represents the percentage of apps classified correctly as malware, as they actually being malware.

Recall is the percentage of apps that are malware are also classified correctly as malware.
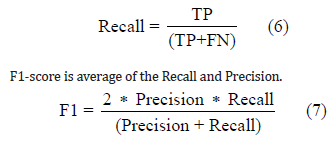
The F1-score is closer to the smaller value. Generally, if these values are closer to 1, then the algorithm is performing well.
Results and Analysis
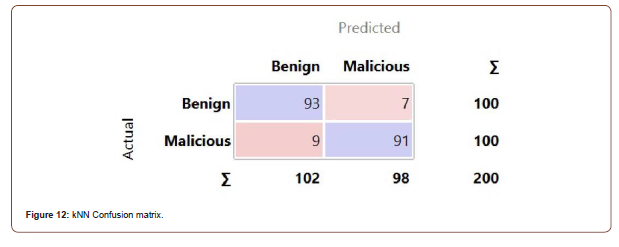
The classification algorithms chosen to work with are Logistic Regression, Naive Bayes, and kNN [11]. This section will provide explanations of these classification algorithms, along with the results for each of them. The results of each algorithm include the ROC curve for both classes, the confusion matrix, and then a table containing other results such as area under the curve and classification accuracy. The ROC curve represents the TPR vs the FPR related to each test case. The confusion matrix represents how many apps are classified for each class, and how many apps that were actually in each class. The experiments started with the default properties for each algorithm, and any changes that were made to increase accuracy is mentioned in their respective explanation. The testing method used is 10-fold cross validation. This means that the data will be split into 10 groups, the model will learn from 9 random folds, test itself on the remaining fold, then repeat the process for each other fold. The first algorithm tested with the data set was Logistic Regression [12] (Figure 3).
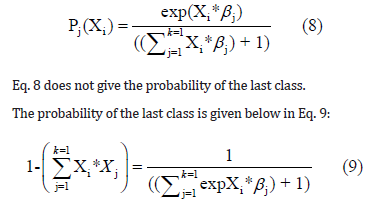
This algorithm uses a logit transform to calculate the probability that an instance is a member of a class. The predicted classification of the instance is the classification that has the highest probability. The probability that an instance X is a member of class j with k possible classes is calculated with Equation 8. If an instance has m attributes, then β is the m ∗ (k −1) parameter matrix.
With all the probabilities calculated, the algorithm then uses a log-likelihood function to optimize the probabilities.

Ridge is a parameter entered by the user to determine how much the algorithm will optimize the loglikelihood. The classification of each instance is the class with the highest probability. With Logistic Regression, we obtained the best results when using 20- fold cross validation instead of 10-fold cross validation. Only difference between 20-fold and 10-fold is how many folds the data is split into. Logistic Regression had a classification accuracy of 91% with the ridge parameter set at 8. Logistic Regression did not have the highest classification accuracy out of the three algorithms, it did have 0.95 area under the ROC curve. The ROC curves for both classes are shown below in Figures 4 and 5, along with the confusion matrix in Figure 6. Table 7 is the full table of evaluation results for Logistic Regression.
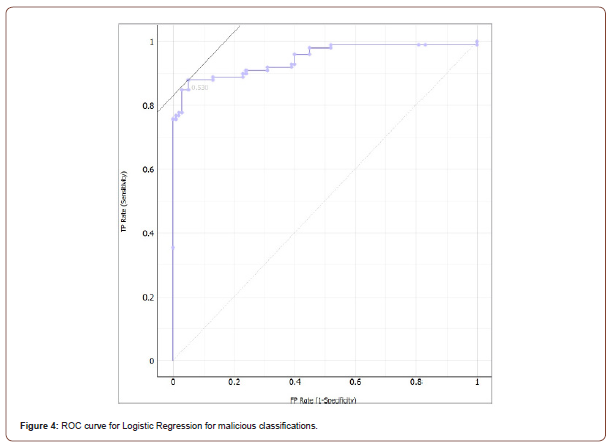
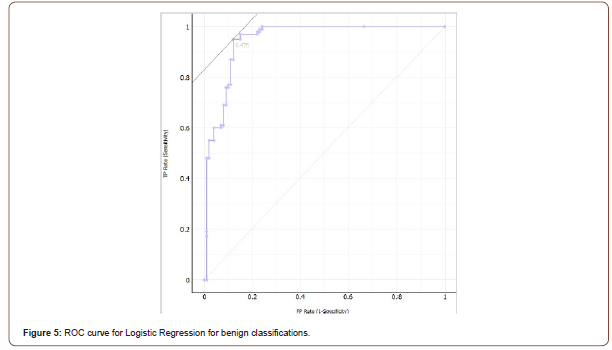
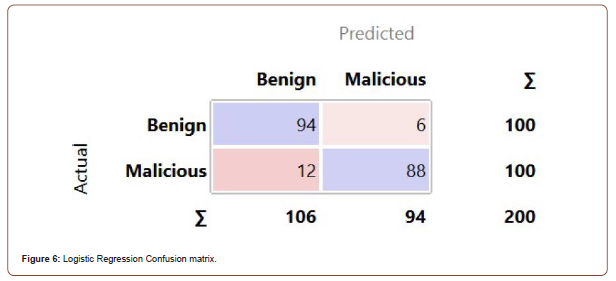
Table 7:Evaluation Results for Logistic Regression.

Table 8:Evaluation Results for Naive Bayes.

The next algorithm tested with the data was Naive Bayes [13]. Naive Bayes assumes that the attributes used for prediction are always independent from the classes, and that there are no underlying factors that will alter the predictions. Like Logistic Regression, Naive Bayes calculates the probabilities that a test instance is part of a class. The Bayes’ Theorem is used to determine if a test instance x being a member of a class c. Let X be the vector that contains all predictor attributes, x represents the values of each attribute that particular test instance has, and C be the vector that contains the classification variable (Table 8).

Because the prediction attributes are conditionally independent from the class, Equation 12 is obtained.

Equation 12 only calculates the probabilities of discrete attributes. The probabilities for continuous attributes are given by Equation 13. c p(C = c)

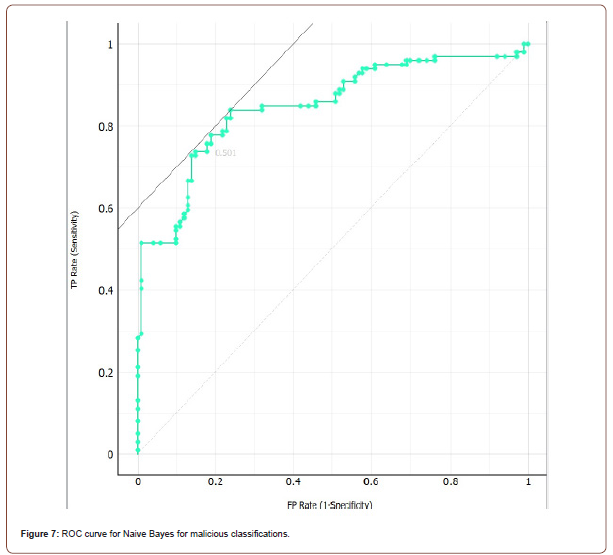
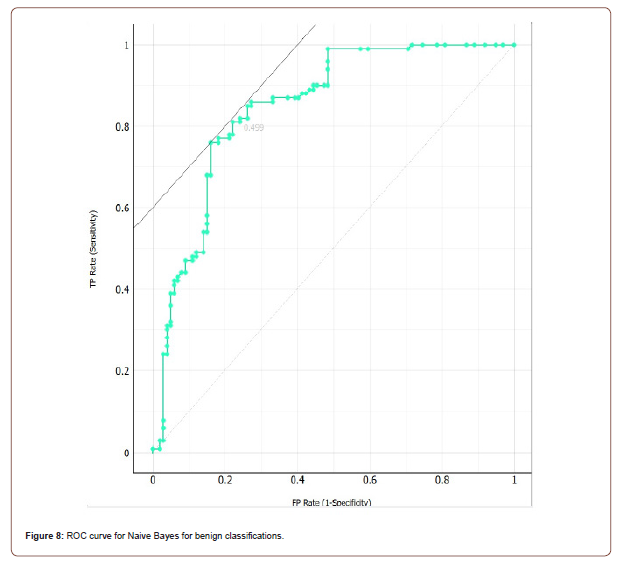
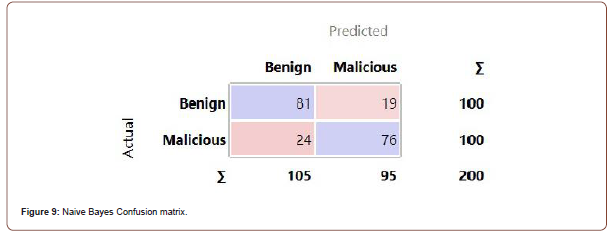
and are the standard deviations and mean respectively of the continuous attribute. Once the probabilities are calculated, the algorithm simply selects the class that has the highest probability. With Naive Bayes, we achieved the best results using 20-fold cross validation. Naive Bayes was the least accurate algorithm in our testing with a classification accuracy of 78.5%. The ROC curves for both classes are shown below in g. 6 and 7, and Table 9 presents the confusion matrix.
Table 9:Evaluation Results for kNN.

Naive Bayes has 0.852 area under the ROC curve. The results are shown in Table 9 (Figure 8 & 9).
The last algorithm tested was the kNN algorithm. It is an instance- based k-nearest neighbor’s algorithm [14]. An instance is a single APK with the predictor attributes being the number of permission requests and the malignancy score, and the category attribute being the true classification of the application. The training of this algorithm could be considered as storing instances into a set with their classifications known. When the algorithm is done training, it compares an instance with an unknown classification to the stored instances. The similarity between two instances x and y with n predictor attributes is calculated with a distance formula. The default formula is a basic Euclidean distance shown in Equation 14.

The similarity can also be calculated using a Manhattan, Chebyshev, or Mahala Nobis distance formula. The Manhattan distance formula is shown below in Equation 15 and was used in this research.

Once all the similarities are calculated, the next step is to classify the unknown instance. The classification of instance is dependent on the popular classification of k smallest similarities. kNN was the most accurate classification algorithm with a classification accuracy of 92.0% with k set to 1, and the distance parameter set to Manhattan. The ROC curve for both classes is represented in Figures 10 and 11, and the confusion matrix is shown in Figure 12. The full evaluation results for kNN are shown in Table 9 [15].
From these results, clearly kNN is the algorithm that should be used in our malware detection process [16-19].
Conclusion
With smartphones becoming ever popular devices and Android being the dominant operating system within the field, the battle of keeping these devices secured against malware has become equally more important. In this paper, we have discussed the problems with static signature-based malware detection methodologies and proposed a new dynamic algorithm-based framework instead that keeps power consumption concerns in mind.
Thus, our proposed method brings together the best of both worlds: the lightweight properties of signature-based detection and the effectiveness of other more in-depth, resource heavy methodologies. To accomplish this, we reverse engineer the Android APKs, parse thro’ the Android Manifest for permission requests and intent actions. Then apply Logistic Regression, kNN, and Naive Bayes algorithms. In doing so, we were able to provide a general framework to dynamically classify Android malware, in which classification algorithms can be ne-tuned to any existing data points to provide more accurate results, providing a lightweight and effective solution to malware detection.
Acknowledgement
We thank Cyber Florida for funding this research work with grant #3910-1004-00-D.
Conflict of Interest
Conflict of Interest: The authors declare that they have no conflict of interest. This research does not involve Human Participants and/or Animals.
References
- (2014) Billion Consumers to Get Smart (phones) by 2016. eMarketer Inc.
- "IDC - Smartphone Market Share - OS." IDC: The Premier Global Market Intelligence Company.
- Zhou, Yajin, Xuxian Jiang (2012) Dissecting Android Malware: Characteristics and Evaluation. IEEE Symposium on Security and Privacy.
- https://koodous.com/
- Ashish B (2016) Android Malware. github.
- https://www.virustotal.com/gui/home/upload
- Google Play Store. https://play.google.com/store=en
- https://ibot.github.io/Apktool/
- Minimal DOM implementation.
- https://developer.android.com/guide/
- Demsar J, Curk T, Erjavec A, Gorup C, Hocevar T, et al. (2013) Orange: Data Mining Toolbox in Python. Journal of Machine Learning Research 14: 2349-2353.
- Le Cessie S, van Houwelingen JC (1992) Ridge Estimators in Logistic Regression. Applied Statistics 41(1): 191-201.
- George H John, Pat Langley (1995) Estimating Continuous Distributions in Bayesian Classifiers. Eleventh Conference on Uncertainty in Artificial Intelligence, San Mateo, 338-345.
- D Aha, D Kibler (1991) Instance-based learning algorithms. Machine Learning 6: 37-66.
- Takamasa Isohara, Keisuke Takemori, Ayumu Kubota (2011) Kernel-based Behavior Analysis for Android Malware Detection. Seventh International Conference on Computational Intelligence and Security, China, pp. 1011-1015.
-
Kanwalinderjit Kaur*, Jesal Patel, Alex Kiss and Michael Walen. Malicious Android Applications’ Classification using Machine Learning. Glob J Eng Sci. 9(4): 2022. GJES.MS.ID.000720.
-
APK, repackaging, Android Manifest, Smali, Dex, Dalvic executable, Google play store
-

This work is licensed under a Creative Commons Attribution-NonCommercial 4.0 International License.


