 Research Article
Impact of Climate Change and Anthropic Activity on The Water Quality of Babar Dam in Algeria
Aissam Gaagai*, Hani Amir Aouissi, Salah Eddine Maalam and Mostefa Ababsa
Scientific and Technical Research Center on Arid Regions (CRSTRA). Biskra, 07000, Algeria
Aissam GAAGAI, Scientific and Technical Research Center on Arid Regions (CRSTRA). Biskra, 07000, Algeria..
Received Date: September 22, 2020; Published Date: November 04, 2020
Abstract
The quality of surface water has deteriorated in recent years, mainly due to climate change. The objective of this work is to assess the impact of a long drought and anthropic action on the water quality of a dam in eastern Algeria, called Babar. To achieve this objective, a study of the water composition of this dam, using the trend method was carried out. The results demonstrated that the waters have a sulfate-calcium to magnesium facies. They show also that most of the parameters follow negative trends, with the exception of K (41.56%), NO2 (5%) and NO3 (35.62%). The use of potassium fertilizers and the dumping of village waste directly into the basin of the dam without any prior treatment, leads to an increase in K. The increase in NO3 is mainly due to the contribution by fertilizers and the nitrification of the ‘ammonium (-61%) which was accompanied by the drop in dissolved oxygen levels (-7.5%). The drop-in orthophosphate content (-80%) is due to its low mobility on the first hand, and to the elimination of phosphorus on the other hand, by mechanical erosion processes from adsorption of the latter by soil colloids. This approach has shown that drought and anthropogenic action have a negative impact on the quality of surface water
Keywords: Dam; Trend method; Anthropic; Nitrification; Algeria
Introduction
Given the climate change that has hit the world in recent years, the quality of surface water has deteriorated significantly due to agricultural, urban and industrial development. Many variables in water quality are subject to large fluctuations in space and time and understanding these fluctuations in the environment can be a difficult task [1]. The natural influence factors can be due to changes in precipitation, erosion, weathering of the earth’s crust materials or they are due to anthropogenic action such as urban, industrial and agricultural activities as well that the excessive exploitation of water resources [2]. These factors work together to create a type of water whose chemical composition varies in space and time [3]. In addition, in river monitoring, it is often necessary to determine whether a variable should be assigned to natural or anthropogenic causes [4,5], knowledge of the geochemical evolution of water qual ity could lead to efficient management of water resources. Water quality is just as important as quantity. Several studies around the world [6-10]. As for Algeria [11-16] are reported on the effects of agricultural, industrial and urban effluents on the quality of surface water. Oued El Arab controlled by the Babar dam, was built for the supply of drinking water and the supply of industrial and irrigation water. The water stored in the basin of this dam experiences a deterioration in its quality due to different types of pollution, in addition to the natural processes of erosion and leaching of various toxic elements. A program of physico-chemical analyzes which made it possible to establish a database, which should be analyzed, and to detect significant trends. This study therefore presents details on the fluctuations in the chemical composition of the water in the Babar dam between January 2013 and March 2016. This work makes it possible both to understand the hydrochemical behavior of the surface waters of the dam reservoir. The trend analysis applied here is determined by linear regression, using the following least squares method to the time series of water quality parameters, it is a fairly simple and easy to implement method.
Material & Methods
Study area
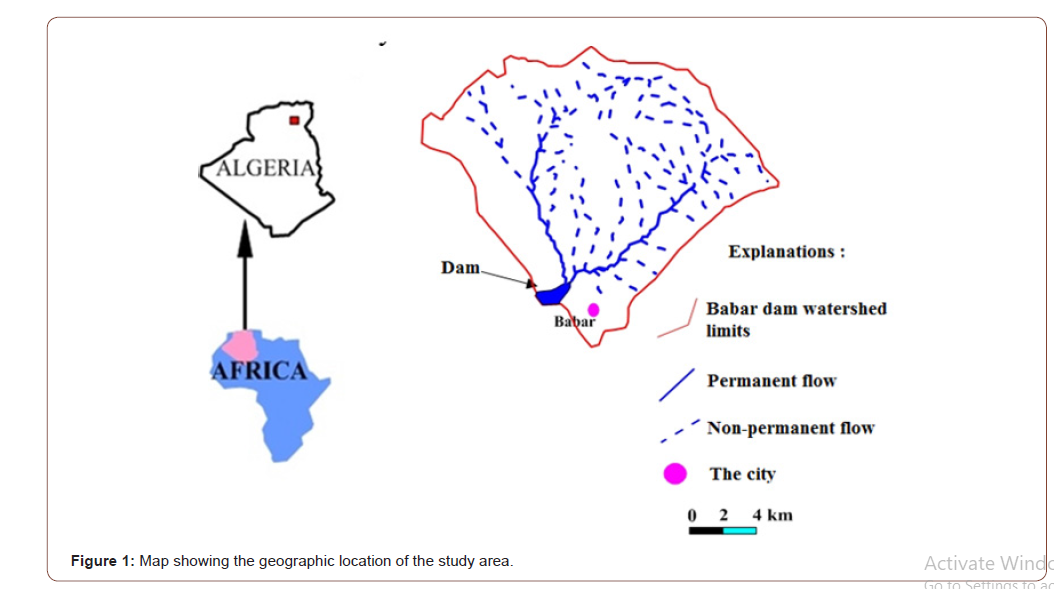
The study area is located in southeastern Algeria, in the eastern reaches of the Saharan Atlas and precisely at the level of the Djebel Djehfa mountain range belonging to the Nememtcha mountains. Most of the inhabitants (more than 20,000 inhabitants) are concentrated in the city of Babar. The surface of the sub watershed is 567 km2, the Babar dam has a capacity of 42 Mm3, built to retain the waters of Oued Tamagra in the West and Oued El Htiba in the East. The Babar dam is located at 35° 10 ‘10’’N and 7° 01’41’’E and the city of Babar is located at 35° 10’4’’N and 7° 06’7’’E (Figure 1). An increase in population and inadequate domestic sewage systems have the potential to influence the quality of the dam water. Oued El Arab provides water for neighboring towns and irrigates thousands of hectares of agricultural land. The increased demand for water at the development stage, including agriculture, could lead to a bleak future for the water quality of the dam.
Analytical methods
The trend method was applied to the data from the physico- chemical analyzes of the surface waters of the Babar dam during the period spanning 39 months, in this case from January 2013 to March 2016. This method allows acquire representative data on the spatial and temporal variability of the surface water quality of the Babar dam on Oued El Arab. For this, we used the data from physico- chemical analyzes, carried out by the National Agency for Water Resources (ANRH) of Constantine.
The measured parameters are determined by the ANRH, such as:
pH, suspended matter (MES), electrical conductivity of water (CE), temperature of surface water in the Babar dam reservoir (Teau), turbidity (gross), organic matter (MO), calcium (Ca2+), magnesium (Mg2+), sodium (Na+), potassium (K+), chlorides (Cl-), sulfates (SO42-), bicarbonates (HCO3-), nitrates (NO3-), nitrites (NO2-), ammonium (NH4+), orthophosphates (PO4 3-). Biological oxygen demand in five days (BOD5), chemical demand in oxygen (COD), dissolved oxygen (O2dis), the variation of the water reserve at the level of the reservoir (Vr).
This technique was applied to the instantaneous monthly physico- chemical data from the Babar dam, during the period from January 2013 to March 2016 using Excel 2007, which constitute a time series of 39 analyzes and 21 variables (Table 1).
In this study, we will effectively present the trends in physico- chemical parameters using a linear regression method. It is a model based on linear trend least squares equations. Whatever the case, three classes of trends have been defined: ‘+’ if a positive trend is detected; ‘0’ if no significant trend is detected; and ‘-‘ if a negative sible to highlight the possible effects of pollution of anthropic origin in the long term [17]. This goal is also achieved using the moving average which makes it possible to make a smoothing which removes seasonality and to reduce background noise as much as possible. The method in question will consist in calculating the moving averages by choosing as length the period of the seasonal variations, so that they will disappear.
Results & Discussion
Characterization of dam water
Table 1:Statistical characteristics of the Babar Dam chemical data in the long term.
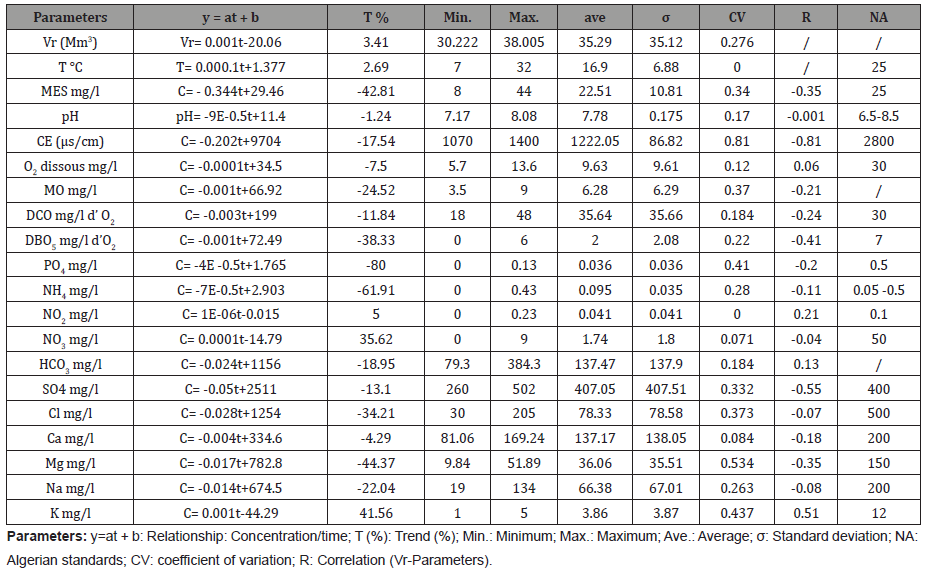
Examination of the standard deviation and the coefficient of variation shows that (Table 1):
• Twater, pH, DCO, NO2, NO3, HCO3, Ca et O2dis are affected by a small variation (< 20%);
• MES, MO, DBO5, NH4, SO4, Cl et Na show a variation around the mean oscillated between 20 and 40%.
• The rest of the elements (Turbidity, CE, PO4,, Mg et K) show a large variation around the average (> 40%).
These strong variations resulting from effluents and leaching of land following torrential precipitation, poorly distributed especially over time.
Examination of these data also shows that the concentrations of the various elements are below Algerian standards with the exception of:
• SO4 where 66.6% of the data exceeds the standard during the study period.
• NO2 where 5.12% of the data exceeds the standard.
• Turbidity where 36.46% of the data exceeds the standard. With maximum values recorded during the year 2013.
• MES where 35.89% of the data exceeds the standard. It has a similar evolution as turbidity.
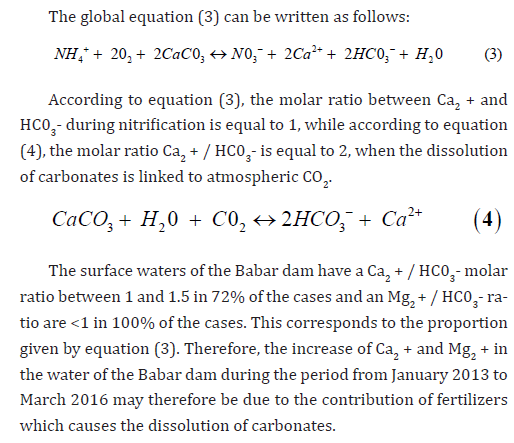
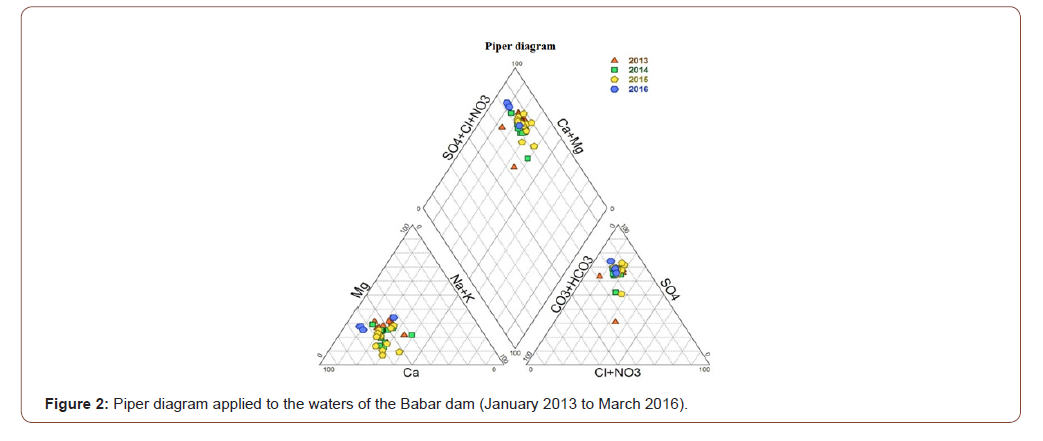
The Piper diagram applied to these waters shows that the samples have a sulfate-calcium to magnesium facies (Figure 2). The first thing noticed between the first campaign (October 2007 to April 2008) and the second campaign (January 2013 to March 2016), no change was seen in the chemical characteristics of the dam waters. According to [18] and [19], calcium can come from nitrogen fertilizers, which participate in the dissolution of carbonates according to the equations 1 and 2 [20].

Variation in the chemistry of the dam water
The linear trend was determined using instantaneous concentrations and time (Table 1). The initial and final average values for the period considered made it possible to calculate these variations. We notice that for most parameters, the slope differs significantly from zero with the exception of pH, O2dis, T° C, Ca and NO2, where the slope is respectively equal to -1.24, -7.5, + 2.69, +5 and -4.29. All the other parameters display a positive slope which varies between +10 and + 108%.
The temperature trend line is stable with a very slight slope of 2.96%. This small increase is probably due to climate change. The slope of the pH trend line is slightly negative (-1.24%). This reflects the presence of low concentrations of organic matter, where the increase in CO2 pressure leads to a decrease in pH according to the formula proposed by Kempe (5). The salinity of the water represented by the electrical conductivity, it registers a negative trend of (-17.57%), this is due to the increase in the volume of water in the dam during the sampling period.

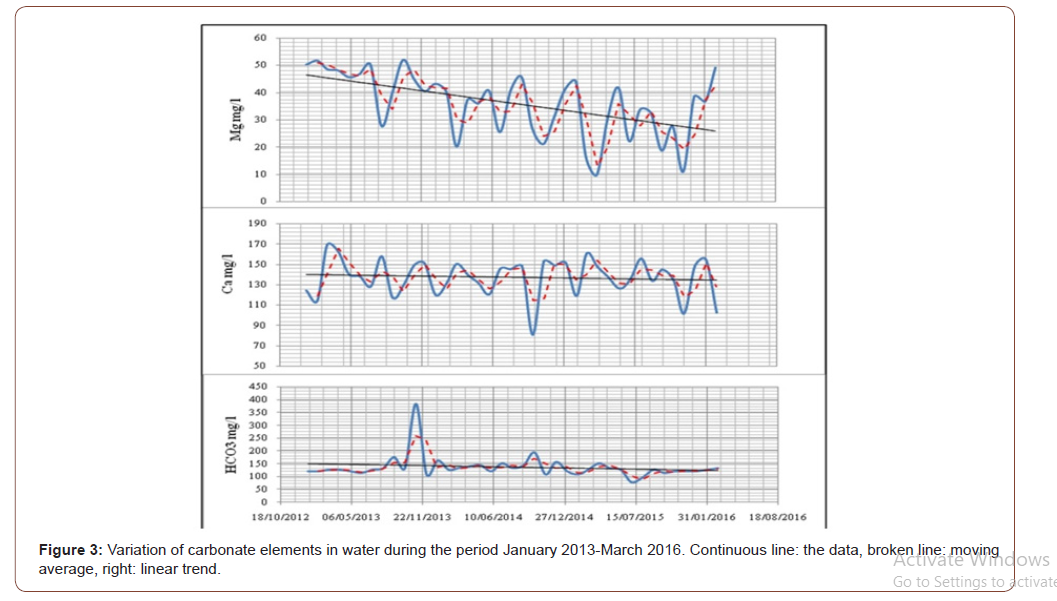
The carbonate elements have a slope, which differs significantly from zero. They recorded negative trends ranging from -4.29% for (Ca2 +), -18.95% for (HCO3-) and - 44.37% for (Mg2+). These trends are related to the equilibrium state of the various minerals in the water and the increase in the volume of water in the dam. These variations in the carbonate parameters contributed to the drop in overall salinity (EC) by -17.57% and a drop in pH by -1.24% (Figure 3).
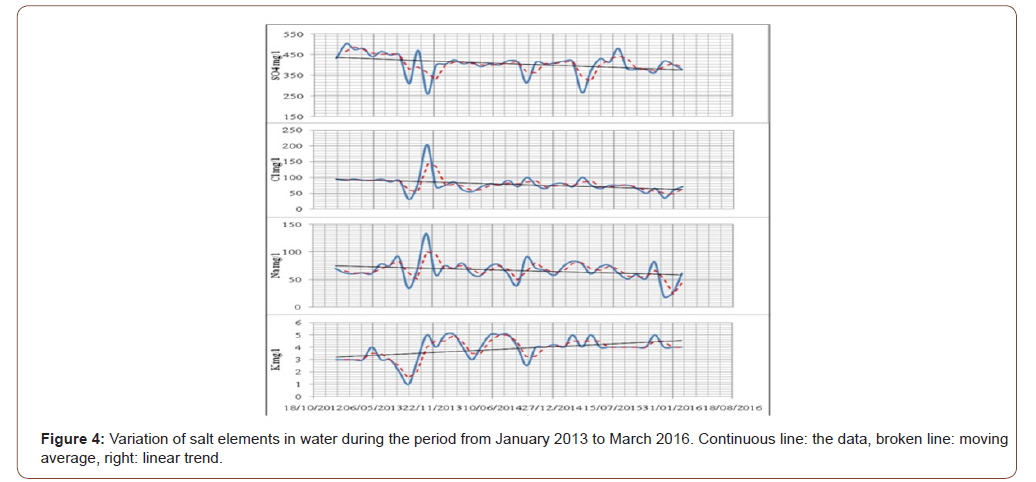
For most of the salt elements, the trend analysis showed a negative slope ranging from -34.21% for (Cl-), -22.04% for (Na+2), -13.10% for (SO4-2). On the other hand, a positive trend was recorded for the K+ (+ 41.56%) (Figure 4). These trends are related to the increase in the volume of water in the dam, which allows the different chemical elements to be diluted. On the other hand, the use of potassium fertilizers and the discharge of village wastewater discharges directly into the main river, lead to an increase in K+.
The salinity of water is represented by the electrical conductivity and the variation of this parameter makes it possible to follow the evolution of the overall salinity and of the chemistry of the water. In the long term, there was a decrease of -17.54%, following the increase in the volume of water in the dam. Salinity can have two origins, either carbonate or saliferous. To determine this origin, we established the Ca2 + + Mg2 + + HCO3- / Na + + Cl- + SO42- vs CE ratio. The Ca2 + + Mg2 + + HCO3- / Na + + Cl- + SO42- <1 ratio. This reflects the influence of salt minerals on salinity (Figure 5). The increase in the content of salt elements allows the increase in salinity. This resulted in a negative trend in the relationship Ca2 + + Mg2 + + HCO3- / Na + + Cl- + SO42- vs CE.

The electrical conductivity of the different samples shows a good correlation with the elements (Na, Ca, Mg, SO4, Cl) with a respective correlation coefficient of (0.34, 0.27, 0.43, 0.68, 0.4). These strong correlations indicate the direct contribution of these elements in the salinity of the surface water of the dam. In contrast, potassium (R = -0.1) and bicarbonates (-0.11) do not seem to influence the salinity of the water too much. The dissolution of carbonated and evaporated minerals takes place according to reactions (6 to 11) [21].


Analysis of the data shows a positive trend for NO3- (35.62%), NO2- (5) (Figure 7). This is mainly due to the development of agricultural production intensively upstream of the dam and urban discharges [23] into the main river without any prior treatment. Furthermore, this gradual increase in the concentration of NO3-, corresponds to the yield of nitrification, in the presence of oxygen aerobically according to reactions (14) and (15) [24]. This oxidation resulted in a decrease of oxygen of -7.5%.

This positive trend is also related to the use of fertilizers on these agricultural soils, this has been highlighted throughout the world by [25,26] and in Algeria by several authors such as [15]. Indeed, the form of nutrient is very toxic for both humans and the aquatic world. This explains why the release of nitrogen in this form constitutes a potential risk for the environment [27].
The phosphorus trend (-80%) does not follow the same trend as nitrates and nitrites, this situation can be explained by the immobility of this element on the one hand, and on the other hand, the elimination of phosphorus by mechanical erosion processes starting from adsorption of the latter by soil colloids [20]. It can also relate to the regulation of phosphorus concentrations in wadis waters by several biogeochemical processes such as precipitation in the form of apatite [(PO4)3 (F, Cl, OH) Ca5] [28] and consumption by aquatic plants [29].
Principal without any prior treatment. Furthermore, this gradual increase in the concentration of NO3-, corresponds to the yield of nitrification, in the presence of oxygen aerobically according to reactions (14) and (15) [24]. This oxidation resulted in a decrease of oxygen of -7.5%.
Influence of water volume
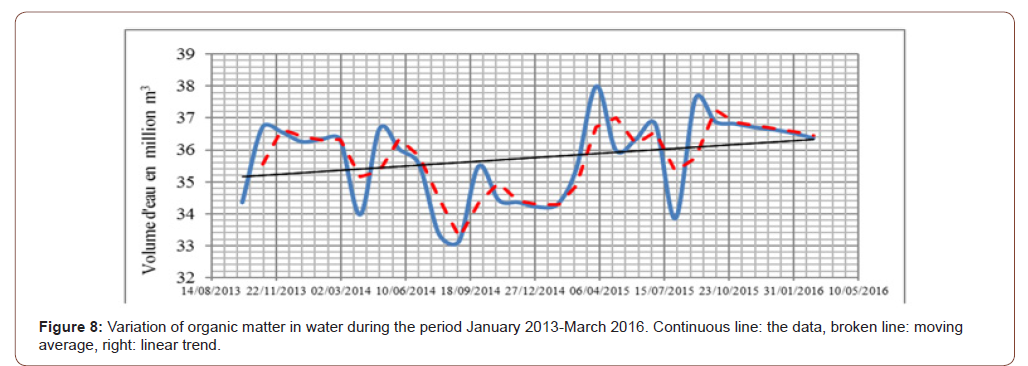
Examination of the trend line shows a positive trend (+3.41%), since the inputs represented by precipitation are greater than the outputs represented by evaporation (Figure 8). Analysis of the evolution of the water volume according to the different hydrochemical parameters highlights a very significant linear correlation between the water volume and the parameters with a stronger negative bond (-0.35 to -0.81) for: (MES, CE, BOD5, SO4, COD, Mg), a weak negative bond (-0.001 to -0.21) for (pH, MO, NO3, Na, Ca, NH4, PO4, Cl). In addition, for the rest we have recorded positive bonds such as HCO3 (0.129), NO2 (0.22), K (0.51), O2 (0.06).On this basis, we note that most of the bonds are significant at the 10% threshold, except (pH, NO3, Na, O2) which highlights either a phenomenon of dilution or concentration depending on the case.
Conclusion
In this case study, the trend method was used to assess the temporal variations of surface water in the Ouel El Arab watershed controlled by the Oued El Arab dam. Sources of water pollution in this watershed could derive from industrial and urban wastewater, irrigation activities and inclement weather. The temporal evolution of the physico-chemical parameters was followed during the period of 39 months. The results obtained showed that most of the parameters followed negative trends, with the exception of K (41.56%), NO2 (5%) and NO3 (35.62%). The use of potassium fertilizers and the dumping of village waste directly into the basin of the dam without any prior treatment, leads to an increase in K. The increase in NO3 is mainly due to the contribution by fertilizers and the nitrification of the ‘ammonium (-61%) which was accompanied by the drop in dissolved oxygen levels (-7.5%). The drop-in orthophosphate content (-80%) is due to its low mobility on the one hand, and the elimination of phosphorus on the other hand, by the processes of mechanical erosion from adsorption of this the latter by soil colloids.
Acknowledgement
None.
Conflict of Interest
No conflict of interest.
References
- Zarei H, Bilondi MP (2013) Factor analysis of chemical composition in the Karoon River basin, southwest of Iran. Appl Water Sci 3: 753–761.
- Sheela AM, Letha J, Joseph S, Chacko M, Sanalkumar SP, et al. (2012) Water quality assessment of a tropical coastal lake system using multivariate cluster, principal component and factor analysis. Lakes & Reservoirs: Research and Management 17: 143–159.
- Guler C, Thyne, GD, McCray JE, Turner AK (2002) Evaluation of graphical and multivariate statistical methods for classification of water chemistry data. J Hydrogeol 10: 455–474.
- Razmkhah H, Abrishamchi A, Torkian A (2010) Evaluation of spatial and temporal variation in water quality by pattern recognition techniques: a case study on Jajrood River (Tehran, Iran). J Environ Manage 91: 852–860.
- Hamzaoui Azaza F, Ketata M, Bouhlila R, Gueddari M, Riberio L (2001) Hydrogeo-chemical characteristics and assessment of drinking water quality in Zeuss–Koutine aquifer, southeastern Tunisia. Environmental Monitoring and Assessment 174: 283-298.
- Widory D, W Kloppmann, L Chery, J Bonnin, H Rochdi, et al. (2004) Nitrate in groundwater: an isotopic multi-tracer approach. Journal Contamination Hydrology 72: 165-188.
- El Ghachtoul Y, Allaoui Mhamdi M, Gabi H (2005) Eutrophisation des eaux des retenues des barrages Smir et Sahla (Maroc) : causes conséquences et consignes de gestion. Rev Sci Eau 18/Spécial, pp. 75-89.
- Liu A, J Ming R, O Ankumah (2005) Nitrate contamination in private wells in rural Alabama, United States. Sciences Total Environmental 346: 112–120.
- Rao N (2006) Nitrate pollution and its distribution in the groundwater of Srikakulam district, Andhra Pradesh, India. Environmental Geology 51: 631-645.
- Guillaud JF, Bouriel L (2007) Relation concentration-débit et évolution temporelle du nitrate dans 25 rivières de la région Bretagne (France). Rev Sci Eau 20(2): 213-226.
- Bouguerne A (2001) Etude comparative par analyse hydrologique et hydrochimique des eaux de surface des bassins versants de oued Bousselem et Oued Rhumel. Mémoire de Magister Dép. Hydrau Univ Batna, 252 p.
- Tiri A, Belkhiri L, Boudoukha A, Lahbari L (2011) Characterization and evaluation of the factors affecting the geomistry of surface water of KoudiatMedouar basin, Algéria. African Journal of environmental Science and Technology 5(5): 355-362.
- Guerraiche Z, Boudoukha A, Rachid Benkadja (2016) Variation of the chemical composition of Grouz dam waters, Eastern Algeria. Desalination and Water Treatment 57: 4878-4887.
- Belhadj MZ, A Boudoukha, L Mezedjri (2011) Qualité Des Eaux De Surface et Leur Impact Sur L'environnement Dans la Wilaya de Skikda (Nord-est de l'Algérie). (Contamination Naturelle Par le Mercure). European Journal of Scientific Research 56(2): 204-211.
- Boudoukha A, Boulaarak M (2013) Pollution des eaux du barrage de Hammam Grouz par les nutriments (Est algérien). Bull Serv Géol Nat 24(2).
- Gaagai A, Boudoukha A, Boumezbeur A, Benaabidate L (2017) Hydrochemical characterization of surface water in the Babar watershed (Algeria) using environmetric techniques and time series analysis. International Journal of River Basin Management 15(3): 361-372.
- Etchanchu D, Probst JL (1988) Evolution of the chemical composition of the Garonne River water during the period 1971-1984. Journal des Sciences Hydrologiques 33(3): 243-256.
- Faurie G (1977) Etude in vitro du rôle de la nitrification sur la lixiviation du calcium dans les sols calcaires. Science du Sol 4: 204-218.
- Durand R (1978) La pédogénèse en pays de craie dans le Nord-Est de la France. Thèse de Doctorat. Univ Louis Pasteur Strasbourg.
- Boudoukha A, Bouguerne A, Mebarkia A (2014) Impact du changement climatique et de l’activité anthropique sur la qualité des eaux du barrage Ain Zada. Algérie. International journal for environnent & global climat change 2(3): 74- 85.
- Appelo CAJ, Postma D (1993) Geochemistry, groundwater and pollution. Journal of Hydrology 155(1-2): 295-296.
- Kempe S (1982) Long-term records of the C07 pressure fluctuations in fresh water. Miditerreen GeololyPalaontologyInstitut 52: 91-332.
- Queneau P, Hubert J (2009) Place des eaux minérales dans l’alimentation. Rapport de l’académie national de médecine. Société française de l’hydrologie et climatologie médicale. France. Pp. 175- 220.
- Martin G (1979) Le problème de l’azote dans les eaux. Technique et Documentation. Paris éd. 279 p.
- El achheb A (2002) Essai de bilan des flux azotés percolant vers les eaux souterraines sous climat semi-aride (cas des périmètres irrigués des Doukkala, Maroc). Revue française de Géotechnique 101: 105-111.
- Fischer JC, Boughriet A, Ouddane B, Bodineau L (2000) Comportement des polluants métalliques et de la matière organique en Manche. Revue Océans 23(1): 89-111.
- Metahri MS (2012) Elimination de la pollution azotée phosphatée des eaux usées traitées, par des procédés mixtes, cas de la STEP Est de la ville de TiziOuezou. Thèse de Doctorat, univTizi Ouezou.172p.
- Golterman HL, Meyer ML (1985) The geochemistry of two hard water rivers, the Rhine and the Rhone: Part 4: The determination of the solubility product of hydroxy apatite. Hydrobiologia 126: 25-29.
- Johnson AH, Bouldin DR, Goyette EA, Hedges AM (1976) Phosphorus loss by stream transport from a rural watershed: quantities, processes and sources. Environmental Journal Quality 5(2): 148-157.
-
Aissam Gaagai, Hani Amir Aouissi, Salah Eddine Maalam, Mostefa Ababsa. Impact of Climate Change and Anthropic Activity on The Water Quality of Babar Dam in Algeria. Glob J Eng Sci. 6(4): 2020. GJES.MS.ID.000643.
-
Dam, Trend method, Anthropic, Nitrification, Algeria
-

This work is licensed under a Creative Commons Attribution-NonCommercial 4.0 International License.


