 Review Article
Fossil Fuel Consumption Trend and Global Warming Scenario: Energy Overview
Swapan K Ghosh1* and Bablu K Ghosh2
1Department of Industrial Engineering, National Institute of Technology, Ibaraki College, Hitachinaka, Japan
2Electrical & Electronic Engineering Program, University Malaysia Sabah (UMS), Kota Kinabalu -88400, Sabah, Malaysia
Swapan K Ghosh, Department of Industrial Engineering, National Institute of Technology, Ibaraki College, Hitachinaka shi, Ibaraki 312- 8508, Japan.
Received Date: March 30, 2020; Published Date: April 17, 2020
Abstract
Global warming is directly related to the consumption of fossil fuel and corresponding CO2 emission in the atmosphere. We have analyzed available data from various sources for energy consumptions, CO2 emissions, and Earth’s average atmospheric temperature during the period 1970 to 2018. We also analyzed the projected energy consumption data during 2018 to 2050. It is found that human industrial activities between 1970 and 2018 have consumed 385 Gtoe of fossil fuel and emitted1143 Gt of CO2 into the Earth’s atmosphere. As a result, the Earth’s average atmospheric temperature has increased 0.90? between 1970 and 2018. It is found that the projected world total fossil fuel consumption during 2018 to 2050 is 378 Gtoe. We estimate that this 378 Gtoe fossil fuel consumption emits 1122 Gt of CO2 into the Earth’s atmosphere resulting in about another1 °C increase in the Earth’s average atmospheric temperature. We suggest that the global warming is advancing more rapidly, and International communities, scientists and engineers must take appropriate rapid action to save the Earth from devastating consequences.
Keywords:Global warming; Primary energy; Fossil fuel; Carbon dioxide emission; Renewables; Solar energy
Introduction
Harnessing energy is an indicator of the advancement of human civilization. Archeological evidences suggest that early hominids acquired skills of making and controlling fire about 100,000 years ago that enabled them to move out of Africa and to colonize colder environments [1]. Modern human started using coal based fossil fuel energy as far back as 4000BC in China, which was the only available fossil fuel source until 1860s when the consumption of crude oil began [2]. Large scale application of various forms of fossil fuel energy was established during the second half of the 19th century when most of the science based industries, including electric power generation, emerged. These new industrial and technological innovations and consumptions of various forms of fossil fuels would enhance the concentration of carbon dioxide (CO2) in the Earth’s atmosphere forever which remained roughly constant below 287 ppm [3] for millions of years. The 20th century world experiences a large diversification of energy consumption including fossil fuels (oil, natural gas and coal), nuclear energy, hydroelectric and modern renewables.

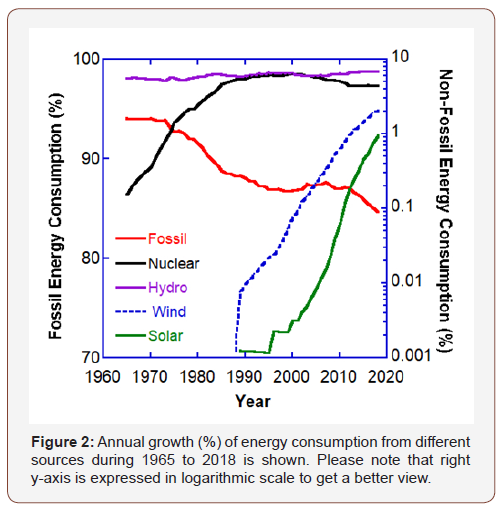
Statistical data given in BP Statistical review of world energy [4] show that mankind has burnt 404 gigatonnes oil equivalent (Gtoe) fossil fuel during the period of 1965 to 2018, and emitted about 1204 gigatonnes (Gt) of CO2 into Earth’s atmosphere during this time (Figure 1). With the development of new technologies to harness energy from diverse resources (such as, nuclear, hydropower, wind and solar) share of fossil fuel energy consumption has declined slightly since 1980 as shown in Figure 2. However, the most alarming news is the world’s total annual CO2 emission is estimated to have risen by more than+2% in 2018 and likely to have reached an all-time high [4-6]. This increase in CO2 emission in the recent past is attributed to the increasing use of fossil fuels in some countries for their economic benefit.
In this review, we qualitatively analyzed the world energy consumption trend, CO2 emission and global warming scenario during 1970 to 2018 and 2018 to 2050. Based on the fossil fuel consumption trend, we have estimated projected CO2 emission and relevant average atmospheric temperature rise.
Data Analysis and Results
The world total consumption of energy in 2018 from fossil fuel (oil, gas and coal) sources is 84.7%; whereas from all other sources (such as, nuclear, hydropower, solar, wind, others) is 15.3% (Figure 2).
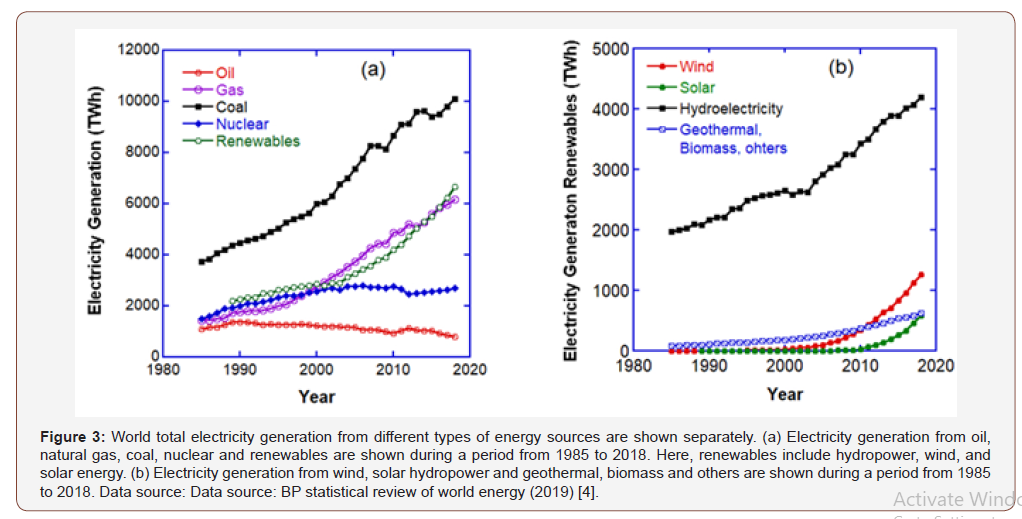
Total fossil fuel consumption is rising every year (Figure 1a) and the chances of finding new reserves are becoming harder. Considering these factors, it is estimated that if the current rate of production continues oil reserves will run out in 50 years, natural gas in 50.9 years and coal in 132 years [4].The world total primary energy consumption in 2018 was 13864.9 Mtoe [4], which is simply equivalent to 161,248 Terawatt hours (TWh) of electricity. If the efficiency (about 38%) of a modern power station is considered, it is possible to generate only about 61,274 TWh of electricity with this total primary energy. However, the world total electricity generation and consumption is increasing every year as it is shown in Figure 3. The world total electricity generation in 2018 from all available sources was 26,614.8 TWh [4]. In which, 802.80 TWh (3.02%) is from oil, 6182.8 TWh (23.23%)is from natural gas, 10,101 TWh (37.95%) is from coal, 2701.4 TWh (10.15%) is from nuclear, 4193.1 TWh (15.75%) is from hydropower, 1270 TWh (4.78%) is from wind, 584.60 TWh (2.20%) is from solar, 625.80 TWh (2.35%) is from geothermal, biomass, etc., and 153.8 TWh (0.58%) is generated from other sources. These data are shown in Figure 4.
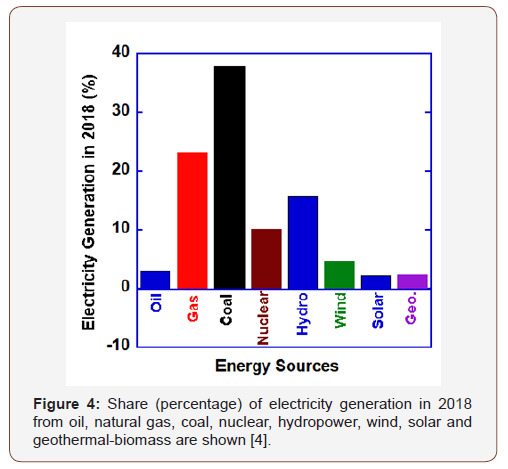
Hence, it may be concluded that currently about 6,048 TWh of electricity is generated from renewables (hydro, wind, solar). Therefore, we summarize that as of 2018 roughly 64.2 % of world total electricity is generated from fossil fuels (oil, natural gas and coal), and about 22.7% is generated from renewables (hydro, wind, solar).
From this analysis, we find that human civilization is now capable to harness only less than one percent (0.95%) of total world primary energy consumption directly from solar energy (Figure 2); and only a tiny fraction of about 2.2% of world total electricity is generated from solar energy. This energy scenario clearly suggests that current technology to capture, store and distribute solar energy is very primitive. Scientists and engineers must achieve a major scientific breakthrough in the area of solar technology. There is a little optimistic sign. As of 2018, the annual growth rate of electricity generation from solar is 28.9% [4]. It is clear that before we exhaust the oil and gas reserve as narrow time window of about 50 years is available for scientists and engineers to invent new technology to harness solar energy in an efficient and cost effective method to meet future world energy demand.
Recent projection of U.S. Energy Information Administration [7] suggests that world total energy consumption increases roughly 50% between 2018 and 2050.Thus, world total primary energy consumption, which is 13864.9 Mtoe [4] in 2018 is estimated to be about 20797 Mtoe in 2050. Various forms of primary energy consumptions in 2018 and projected primary energy consumptions in 2050 are shown in Figure 5. Hence, we find that the total fossil fuel energy consumption in 2050 is expected to be about 14172 Mtoe, which was 11744 Mtoe in 2018. Consumption of fossil fuel is mainly responsible for carbon dioxide emission. It is found that although electricity generation from renewables will grow significantly by 2050, the world total fossil fuel consumption will increase roughly 21% between 2018 and 2050. This is a serious environmental concern.
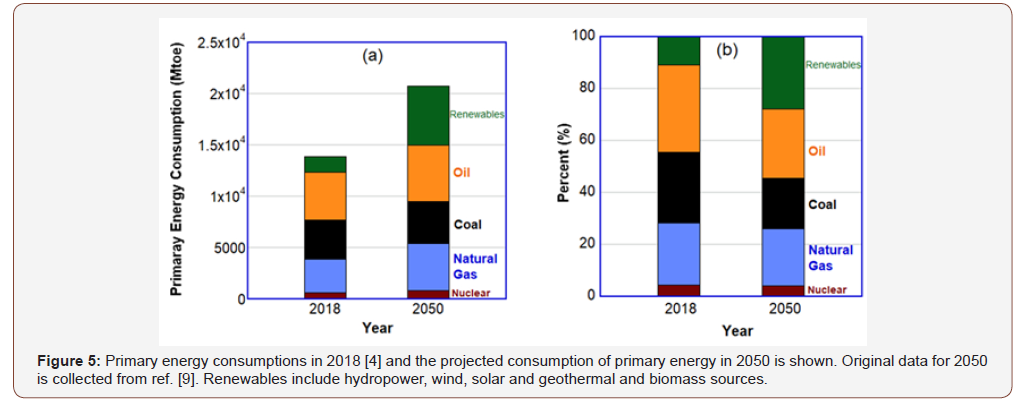
World total electricity generation increases every year, and it will increase nearly 70% by the year 2050 [7]. Thus, the total electricity generation in 2050 is predicted to be 45,000 TWh. Renewables (hydro, wind and solar) are projected to be the fastest growing energy source of electricity generation during the period 2018 to 2050, and by the year 2050, renewables will become the leading source of primary energy consumption. As of 2018, about 22.7% of the world total electricity generation is from renewable (hydro, wind and solar) sources. Whereas, it is predicted that 50% of the world total electricity would be generated from renewables by the year 2050 [7]. Therefore, projected electricity generation from renewables (hydro, wind and solar) by the year 2050 would be about 22,500 TWh.
Our analysis shows that, the world total electricity generation in 2018 from renewable (hydro, wind, solar) is 6,048 TWh. In which the major contributor is hydropower. As of 2018, 69.3%electricity is generated from hydropower, 21% is generated from wind, and only 9.7% is from solar energy. However, the annual growth rate of electricity generation by hydropower is very low comparing with solar energy and wind power. As global warming is continuing, ice-melt occurs at an increasing rate. The shortage of water flow in the upstream will hinder the growth of further hydropower electricity generation. Therefore, it is assumed that projected growth of electricity generation from hydropower is only little and insignificant. The two fastest growing future renewable contributors are solar energy and wind power during 2020 and 2050. Therefore, scientists and engineers must invent new and efficient technology in this field.
Results and Discussions
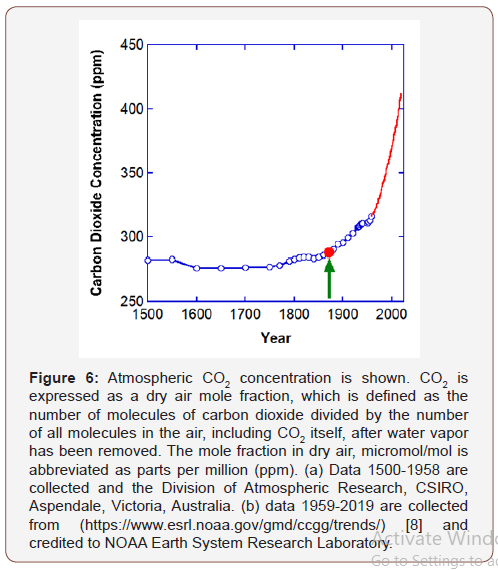
Anthropogenic carbon emissions in the atmosphere include burning fossil fuels, deforestation, land structure changes, constructions and livestock that result in the net increase in carbon dioxide concentration. Among these carbon sources fossil fuel is the most dangerous enemy of environment. A part of the atmospheric carbon dioxide is naturally absorbed by the ocean and land surface (including green vegetation), and the rest of CO2 remains in the atmosphere for a long time between300 to 1000 years. The amount of CO2 that 7.7 billion humans is generating today will affect the Earth’s environment for next thousands of years. In the beginning of the industrial age the atmospheric CO2 concentration was about 287 ppm, and it has risen to 412 ppm between 1870 to 2019 [indicated by red solid circle and green arrow in Figure 6]. Although scientists and engineers have invented carbon dioxide capture and sequestration (CCS) technology to reduce atmospheric CO2 concentration, its long term effectiveness and worldwide usefulness is not clear yet.
Industrial development and fossil fuel consumption are directly linked to the atmospheric CO2 concentration in the past. Carbon dioxide emission by the consumption of fossil fuel is directly responsible for global warming. Advancement of human civilization requires more energy. The more we harness the energy the more we enhance the global warming. However, the most alarming news for mankind is the ever rapid increase in the atmospheric CO2 concentration, which has increased about 30%, since 1960, as shown in Figure 6.
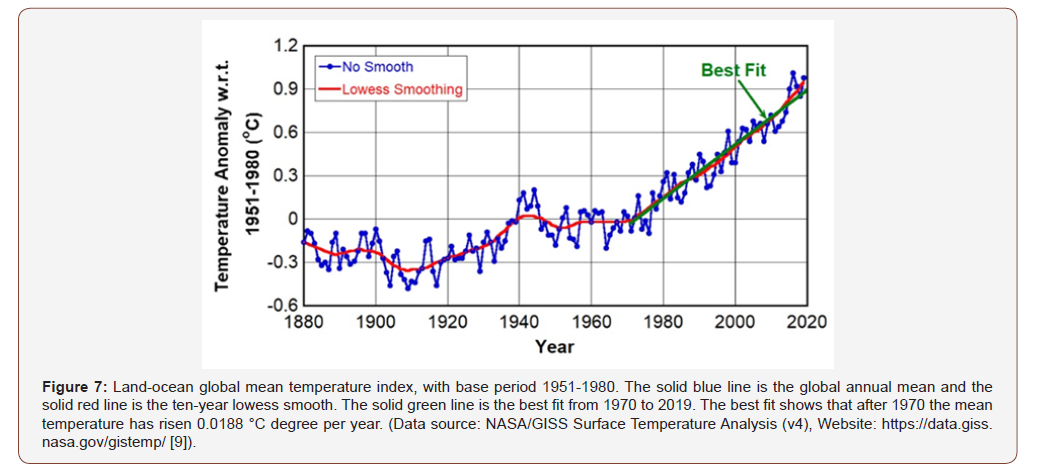
From Data [4] we find that modern industrial development, transportation and other human activities have consumed 385 Gtoe fossil fuel during 1970 to 2018; and emitted about 1143 Gt of CO2 into the Earth’s atmosphere during this time. As a result, the atmospheric CO2 concentration has risen from 326 ppm to 409 ppm during this time. It is found that Earth’s average atmospheric temperature has risen about 0.90 °C between 1970 to 2018 (Figure 7) [9]. The best fit (green straight line) to the data in Figure 7 from 1970 to 2019 shows that the average temperature has risen about 0.0188 °C per year.
In the previous section we mentioned that the world total fossil fuel consumption is projected to be increasing roughly 21% between 2018 and 2050 [7]. Hence, it is estimated that for global industrial development, transportations, constructions and for other human activities the world total fossil fuel consumption would be about 378 Gtoe between 2018 to 2050. Based on the relation between fossil fuel consumption and CO2 emission data between 1970 to 2018 [4], we estimate that 378 (Gtoe) of fossil fuel consumption between 2018 to 2050 results in the emission of 1122 Gt of CO2 during 2018 to 2050. Continuing worldwide deforestation due to agriculture, constructions, building new industries and unexpected large scale forest fire (such as, Amazon forest fire in 2019 and Australia forest fire in 2020) are making the matter worse. Large scale forest fire causes a huge amount of additional CO2 emission in the atmosphere and the deforestation slows down the absorption rate of atmospheric CO2.This large amount (378 Gtoe) of fossil fuel consumption in a comparatively shorter span of time (32 years) would expedite the global warming more rapidly and the average atmospheric temperature may rise about another 1 °C between 2018 and 2050. The advancement of rapid global warming may cause more frequent forest fire, flood, drought, cyclone, tornedo, etc., which may jeopardize global environment more rapidly.
In the absence of any appropriate actions from international communities, human civilization may face irreversible catastrophic consequences due to this ever rapid global warming. To save the mother Earth international communities, scientists and engineers must take appropriate rapid action to switch to new energy technology and to new approach to meet future energy demands.
Conclusion
Global warming is directly related to the consumption of fossil fuel and corresponding CO2 emission in the atmosphere. We have analyzed various energy consumption trend and CO2 emission data since 1965. We find that human industrial activities during the last 48 years (from 1970 to 2018) have burnt about 385 (Gtoe) of fossil fuel and emitted 1143 (Gt) of CO2 into the Earth’s atmosphere. During this time the Earth’s average atmospheric temperature has risen about 0.90? We further investigated the projected world energy consumption trend during 2018 to 2050. We find that the projected world total fossil fuel consumption is about 378 (Gtoe) during this time, which may emit 1122 Gt CO2 in the atmosphere resulting in an another 1 °C increase in Earth’s average atmospheric temperature. This ever increasing fossil fuel consumption in a shorter period of time advancing global warming more rapidly and may have irreversible catastrophic consequences.
Acknowledgement
We sincerely acknowledge that for this review we collected (1) energy consumption data from http://www.bp.com/ statisticalreview, (2) projected energy data from https://www. eia.gov/ieo/, (3) atmospheric CO2 concentration data from web sources: https://www.co2levels.org and www.esrl.noaa.gov/gmd/ ccgg/trends/ and (4) atmospheric mean temperature data from https://data.giss.nasa.gov/gistemp/.
Conflict of Interest
No conflict of interest.
References
- Juli G Pausas, Jon E. Keeley (2009) A Burning Story: The Role of Fire in the History of Life. BioScience 59(7): 593-601.
- Hannah Ritchie, Max Roser (2020) Fossil Fuels.
- Atmospheric CO2
- (2019) Statistical review of world energy. BP.
- Corinne Le Quéré, Robbie M. Andrew, Pierre Friedlingstein, Stephen Sitch, Judith Hauck et al. (2018) Global Carbon Budget 2018. Earth System Science Data 10(4): 2141-2194.
- Christiana Figueres, Corinne Le Quéré, Anand Mahindra, Oliver Bäte, Gail Whiteman et.al (2018) Emissions are still rising: ramp up the cuts. Nature 564: 27-30.
- International Energy Outlook (2019) U.S. Energy Information Administration.
- Atmospheric CO2 data (a) 1500-1958 are collected from website https://www.co2levels.org, which is credited to DM Etheridge, LP Steele, RL Langenfelds, RJ Francey and the Division of Atmospheric Research, CSIRO, Aspendale, Victoria, Australia; and (b) data 1959- 2019 are collected from (www.esrl.noaa.gov/gmd/ccgg/trends/) which is credited to Pieter Tans, NOAA/ESRL and Ralph Keeling, Scripps Institution of Oceanography (scrippsco2.ucsd.edu/).
- NASA/GISS Surface Temperature Analysis (v4).
-
Swapan K Ghosh, Bablu K Ghosh. Fossil Fuel Consumption Trend and Global Warming Scenario: Energy Overview. Glob J Eng Sci. 5(2): 2020. GJES.MS.ID.000606.
-
Global warming, Primary energy, Fossil fuel, Carbon dioxide emission, Renewables, Solar energy
-

This work is licensed under a Creative Commons Attribution-NonCommercial 4.0 International License.


