


 Research Article
Fatigue Strength and Life Estimation Methods Using Critical Distance Stress Theory
Received Date: June 26, 2019; Published Date: July 08, 2019
Abstract
Generally, the critical distance stress theory was applied for the fatigue limit estimation of general structures. In this method, it needs only two parameters, fatigue limit of smooth specimen (σw0), and threshold stress intensity factor range (ΔKth). In this paper we extended this method for the estimation of low cycle fatigue life too. In this improvement we define the critical distance (rc’) on static strength conditions, which is calculated using ultimate tensile strength (σB) and fracture toughness (KIC), in addition to the critical distance on fatigue limit condition (rc). Then the critical distances of any low cycle fatigue conditions can be calculated by interpolation of critical distance on fatigue limit (rc) with critical distance on static strength (rc’). By unifying these low cycle fatigue life estimation methods with high cycle fatigue limit estimation method, we can estimate the full range fatigue life easily. And to confirm the availability of this estimation method we perform the fatigue test for circle hole specimens, sharp V notch specimens and fretting fatigue specimens.
Keywords:High cycle fatigue; Low cycle fatigue; Fatigue life; Critical distance stress theory; Threshold of stress intensity factor range; Fracture toughness
Introduction
In general, the critical distance stress theory (point method and line method) were used for estimation of fatigue limit with any shape structures [1]. In this method the fatigue limit can be obtained using typical material strength parameters such as the fatigue limit of smooth specimen σw0 and the threshold stress intensity factor range ΔKth of the cracked specimen. In the case of point method, the fatigue failure supposed to occur when the stress range at specific length rc from maximum stress point reach Δσw0.
In this paper we extended this method to the low cycle fatigue regions. Then I will explain this development in detail. Firstly, the critical distance in low cycle fatigue region is derived by interpolating between critical distance in fatigue limit rc as shown in above and critical distance in static strength rc’. This static strength critical distance rc’ can be derived using ultimate strength of smooth specimen σB and the fracture toughness KIC of the cracked specimen.
To confirm the validity of this critical distance approach we applied this method on full range cycle (including both high cycle and low cycle range) fatigue life estimation of circle hole specimens and fretting fatigue specimens. These estimated full range S-N curves coincided well with the experimental results.
Outline of Critical Distance Stress Theory
In the critical distance stress method, the fatigue limit of the target structure can be obtained using typical material strength parameters such as the fatigue limit of smooth specimens σw0 and the threshold stress intensity factor range ΔKth of the cracked specimens as shown in Figures 1&2. In the case of point method, the fatigue failure supposed to occur when the stress range at specific length rcp from maximum stress point reach Δσw0, and in the case of line method the fatigue failure supposed to occur when the mean stress range between maximum stress point and specific length point rcl reach Δσw0. Each rcp and rcl can be derived as follows.

For point method, 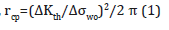
And for line method, 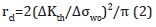

Development of Critical Distance Stress Theory to the Low Cycle Fatigue Analysis
In this paper we extended this method to the low cycle fatigue regions. Then I will explain this development in detail. Firstly, the critical distance in low cycle fatigue region is derived by interpolating between critical distance in fatigue limit as shown in above and critical distance in static strength. This static strength critical distance can be derived using ultimate tensile strength of smooth specimen σB and the fracture toughness KIC of the cracked specimen as shown in Eq. (3) & (4).
For point method, 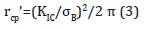
And for line method, 
In this section we use only the point method.
The critical distance in each stress level is calculated by interpolation of critical distance on fatigue limit (rc, estimated using σw0 and ΔKth) with critical distance on static strength (rc’, estimated using σB and KIC) as shown by chain line in Figure 3 (right). The critical distance on objective conditions (structure, load) can be estimated by reflecting the stress distributions of objective structure as shown by dotted line in Figure 3 (right). The low cycle fatigue life in this objective condition can be estimated by applying this reference stress σ at critical distance r on S-N curve of smooth specimens as shown in Figure 3 (left upper).

To confirm the validity of this critical distance approach we applied this method on low cycle fatigue life estimation of circle hole specimens. Smooth specimen and circle hole specimen used on this test are shown in Figure 4, and material properties of SS400 steel are shown in Table 1.S-N curve of the smooth specimens is shown in Figure 5. And Critical distance on fatigue limit rc and on static strength rc’ are estimated using Eq. (1) & (1)’ and (3) & (3)’ as 0.077mm and 1.24mm respectively and shown in Figures 6-9 by ●points. By interpolating these two points the critical distances on arbitrary conditions are estimated as straight line in Figures 6-9. The critical distance of circle hole and sharp V notch specimens on each loading condition can be estimated as the cross point of these stress distributions lines on each loading conditions with interpolation line (straight line) as shown in Figures 6-9. And by reflecting the stress σ on this cross point on S-N curve of smooth specimens we can estimate the fatigue life on each loading condition of each circle hole and sharp V notch specimens. By repeating this estimation, we can estimate the S-N curve of each circle hole and sharp notch specimens as shown in Figures 10-13 by solid line.


Application on Low Cycle Fretting Fatigue Life Analysis
As mentioned in previous papers, in general the fretting fatigue accidents were dominated by high cycle fatigue failure, and so many fretting fatigue strength and life analysis were carried out especially on high cycle region [2-18]. But, recently in accordance with the increase of daily start stop operations in such as the turbine machinery (as shown in Figure 14) the increase of low cycle fretting fatigue failure can be observed in industrial fields.
Then we will apply this extended critical distance theory on the fretting fatigue life prediction. In Figure 15 (left upper) the S-N curve of Ni-Mo-V steel smooth specimen in complete reversed loading conditions (R=-1), and in Figure 15 (left under) the crack propagation characteristic of cracked specimen is shown. From these material characteristics we can obtain the critical distance rc as 0.011mm and rc’ as 2.13mm as shown in Figure 15 (right). The stress distributions in fretting conditions were calculated using FEM model as shown in Figure 16. The calculated example of stress distribution near the contact edge is shown in Figure 17. The mean contact pressure σp and mean axial stress σa in this case are 200MPa and 100MPa respectively.


The critical distance on each loading conditions can be estimated by reflecting these stress distributions on Figure 15 (right) as shown by dotted line. The low cycle fretting fatigue life in this loading condition (σa is 200MPa) can be estimated by applying this stress level at critical distance (cross point σ=490MPa) on S-N curve of smooth specimens as shown in Figure 15 (left upper). By connecting these fretting fatigue lives on each stress level, we can estimate the fretting fatigue S-N curve as shown in solid line in Figure 18.
Comparison with the Experimental Results
To confirm the validity of this fretting fatigue life estimation method we compare the estimated results with the experimental results. The fretting fatigue test apparatus is shown in Figure 19. The specimen material is Ni-Mo-V steel. The contact pressure between specimen and pads is set as 200MPa by screw. The contact pressure and crack initiation at the contact edges are monitored by the strain gage A and strain gage B Respectively. The experimental results of fretting fatigue tests are shown in Figure 15 by symbol ○. The estimated results of low cycle fretting fatigue life using critical distance theory is shown by dotted line in Figure 18. The estimated results of high cycle fretting fatigue life considering fretting wear process which was presented in previous paper [17,18] is shown by dash line in Figure 18. And the estimated fretting fatigue limit (142MPa) without considering fretting wear which was presented in previous paper [13] is shown by two points of dot-dash line in Figure 18. We can see that these three kinds of fretting fatigue strength and life prediction results coincided well with the experimental results in each stress and life level. And we can confirm the validity of these fretting fatigue strength and life estimation methods.


Conclusion
• We developed the total region fatigue strength and life estimation method by modifying the critical distance stress theory, which mainly applied on high cycle fatigue analysis, in order to make applicable for low cycle fatigue analysis.
• This modified critical distance stress theory was applied on fatigue strength and life estimation of hole specimens and sharp V notch specimens, and the estimated S-N curves coincided well with the experimental results.
• Low cycle fretting fatigue strength was estimated using the developed critical distance theory, .and this estimated results coincided well with the fretting fatigue test results And we can confirm the availability of these fretting fatigue strength and life estimation methods as the standardized fretting fatigue S-N curve estimation method.
Acknowledgement
None.
Conflict of Interest
No conflict of interest.
References
- Taylor D (1999) Geometrical Effects in Fatigue: A Unifying Theoretical Model. Int J Fatigue 21(5): 413-420.
- Gassner E (1967) The value of surface-protective media against fretting corrosion on the basis of fatigue strength tests. Laboratorium fur Betriebsfestigkeit TM19/67.
- Buch A (1977) Fatigue and fretting of pin-lug joints with and without interference fit. Wear 43(1): 9-16.
- Hattori T, Kawai S, Okamoto N, Sonobe T (1981) Torsional fatigue strength of a shrink- fitted shaft. Bulletin of the JSME 24(197): 1893.
- Cornelius EA, Contag D (1962) Die Festigkeits-minderung von Wellen unter dem Einflu β von Wellen-Naben- Verbindungen durch Lotung, Nut und Pa β feder, Kerbverzahnungen und Keilprofile bei wechselnder Drehung, Konstruktion 14(9): 337.
- Hattori T, Sakata S, Ohnishi H (1983) Slipping behavior and fretting fatigue in the disk/blade dovetail region. Proceedings, Tokyo Int Gas Turbine Cong, pp. 945.
- Johnson RL, Bill rc (1974) Fretting in aircraft turbine engines. NASA TM X-71606.
- Hattori T, Nakamura M, Watanabe T (1984) Fretting fatigue analysis by using fracture mechanics 31(1): 100-107.
- King RN, Lindley TC (1980) Fretting fatigue in a 3 1/2 Ni-Cr-Mo-V rotor steel. Proc ICF5, pp. 631.
- Okamoto N, Nakazawa M (1979) Finite element incremental contact analysis with various frictional conditions. Int J Numer Methods Eng 14: 377.
- Hattori T, Sakata H, Watanabe T (1988) A stress singularity parameter approach for evaluating adhesive and fretting strength. 6: 43
- Hattori T, Nakamura N (1994) Fretting fatigue evaluation using stress singularity parameters at contact edges. Fretting Fatigue ESIS Publication 18: 453.
- Hattori T, et al. (1988) Fretting fatigue analysis using fracture mechanics. JSME Int J Ser l 31: 100.
- Hattori T, Nakamura M, Watanabe T (2003) Simulation of fretting fatigue life by using stress singularity parameters and fracture mechanics. Tribology International 36: 87.
- Suresh S (1998) Fatigue of Materials 2nd Cambridge University Press, p. 469.
- Goryacheva IG, Rajeev PT, Farris TN (2001) Wear in partial slip contact. ASME J of Tribology 123(4): 848.
- Hattori T, Yamashita M, Nishimura N (2005) Fretting fatigue strength and life estimation in high cycle region considering the fretting wear process. JSME International Journal 48(4): 246-250.
- Hattori T, Nakamura, Nishimura N, Yamashita M (2006) Fretting fatigue strength estimation considering the fretting wear process. Tribology International 49: 1100-1105.
-

This work is licensed under a Creative Commons Attribution-NonCommercial 4.0 International License.


