 Research Article
Adaptation and Management Practices of Communities Vulnerable to Gully Erosion in Anambra and Imo States, Nigeria
Igbokwe T1, HO Nwankwoala2* and Orluchukwu JA3
1Institute of Natural Resources, Environment and Sustainable Development, University of Port Harcourt, Nigeria
2Department of Geology, University of Port Harcourt, Nigeria
3Department of Crop and Soil Science, University of Port Harcourt, Nigeria
HO Nwankwoala, Department of Geology, University of Port Harcourt, Nigeria.
Received Date: March 07, 2022; Published Date: March 24, 2022
Abstract
This study is aimed at evaluating the adaptation and management practices of communities vulnerable to gully erosion in Anambra and Imo States, respectively. The study employed qualitative research methods involving a cross sectional research design using questionnaire survey and interviews. The information for the causes of gully erosion among sampled communities showed the following distribution: 13.1% respondents believed that it has been caused by deforestation; 25.2% of the respondents indicated infrastructural development causes; 20.5% of the sampled respondents indicated poor farming systems; 31.8% of the respondents were of the opinion that the misuse of land contributes more to the causes of gully erosion in the study area; while the remaining 9.4% of the respondents indicated mining as one of the causes of gully erosion in the study area. The distribution revealed that majority of sampled respondents indicated land misuses as a prominent factor leading to gully erosion formation in the study area. The study therefore noted that gullies have impact on depletion of the soil through constant action of erosion and these have several implications for food production which is the primary economic activity engaged on by the majority of residents in the study area. Thus, adaptive capacities of residents in affected gully erosion areas in Anambra and Imo States have not been effective. This will definitely lead to increased socio-economic effects which have several implications on their potential for growth and development in the study area.
Keywords: Gully erosion; Vulnerability; Land use; Soil erosion; Adaptation; Remediation
Introduction
Gully erosion is the process by which gullies are formed. Hillsides are more prone to gully erosion when they are cleared of vegetation, through deforestation, over-grazing or other means [1]. The eroded soil is easily carried by the flowing water after being dislodged from the ground normally when rain falls during short, intense storms such as during thunderstorms. A gully may grow in length by means of head ward (i.e. upstream) erosion at a Knick point. This erosion can result from interflow as well as surface runoff. Gullies reduce the productivity of farmland where they incise into the land and produce sediment that may clog downstream water bodies [2,3]. Thus, because of this, much effort is invested into the study of gullies within the scope of geomorphology, in the prevention of gully erosion, and in restoration of gullied landscapes [4]. The total soil loss from gully formation and subsequent downstream river sedimentation can be sizeable [5].
This study is limited geographically to Anambra and Imo states, Nigeria. Thus, the two states were the study areas whereby imageries of each state were used to perform geospatial analysis in relation to the objectives of the study. The scope of the research conducted in Anambra and Imo states therefore covers land use/land cover analysis; vegetation index (for crop management analysis); mean annual rainfall (mm); soil texture/particle size composition; elevation and contour surface analysis; analysis of soil loss (t/year) estimate and percentage erosion.
The perceived problems, challenges and management practices of communities vulnerable to gully erosion in Anambra and Imo states were also examined. Therefore, the questionnaire instrument was employed for data collection in this regard. Thus, copies of the questionnaire were administered at household level in communities vulnerable to gully erosion to obtain information concerning the challenges of gully erosion and their adaptations and management strategies overtime. That is, these communities are found in areas of depressions indicating strong gully sites (areas experiencing gully erosion overtime) due to their respective elevation.
Description of the Study Area
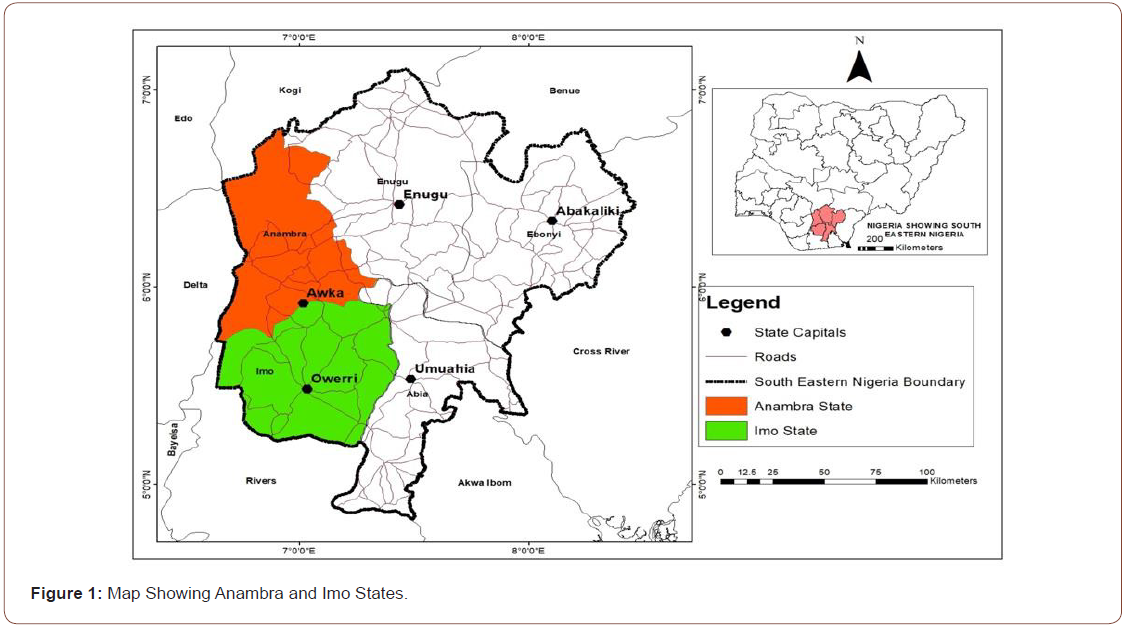
The study area is located geographically within latitudes 4° 47’ 35‟N and 7° 7’ 44‟N, and longitudes 7° 54‟ 26‟E and 8° 27‟ 10‟E (Figure 1) in the tropical rain forest zone of Nigeria, and is made up of Anambra and Imo States. The area covers about 29095 km2 which is about 3.19 % of the total area of Nigeria [6].
Topography and geology
The area lies in the Anambra and Niger River basins. The Anambra River Basin is a NE-SW trending syncline that is part of the Central African Rift System which developed in response to the stretching and subsidence of major crustal blocks during a lower Cretaceous break-up phase of the Gondwana super-continent [7]. The tectonic movements for the formation of the Anambra Basin and the other areas were reactivated by further plate activity in lower Tertiary soon after the intermittent Upper Cretaceous rifting [7]. The separation of the African and South American plates left the Benue Trough as an Aulacogen. Geologic formations such as hills that elongate in the north east to south westerly directions include Missions hill and Abakaliki hill. The hills are generally of volcanic rocks and sandstones. It is found that from these hills that a number of streams that recharge the rivers that drain the area originated. In Ebonyi, the outcrops of folded Cretaceous limestone and shale are found in so many places [8].
The Geology of the area is a major factor in gully erosion causation and massive landslides that occur in several communities. The sandy members of the Ajalli Sandstone, Ameki Formation and Nanka Sands are very prevalent to denudation where they become exposed as sandy outcrops. Sometimes these sandy Formations have overlying and underlying shaley members that may bind the sandy units together [9]. These Geologic Formations contain saturated groundwater members or aquifers whose pore water pressures enhance groundwater flows and movement of sedimentary materials. Sedimentary units of these Formations sometimes form escarpments or cuestas that may be folded and faulted with fractures of joints and faults all of with planes of weaknesses which facilitate the incidences of gully erosion and landslides. Blocks of sedimentary units of rocky sands and shales may break out and slide downslope into the gully valleys [9].
Drainage
The area is well drained. The notable lakes, rivers and streams that are found draining the area in this zone include Rivers Niger, Imo, Nike Lake, Anambra, Idemili, Njaba, Oguta Lake, Nkisi, Ezu, Oji etc. [9]. The River Niger Basin forms part of the almost north-south trending River Niger that catches up with the tributary dissections of the Anambra, Idemili and Njaba Rivers as well as their distributaries that flow from east to the west as they forcefully-empty into the River Niger that flows southwards into the Atlantic Ocean. Similarly, in the eastern area, the Imo and Cross Rivers together with their tributaries flow southwards and discharge their waters into the Atlantic Ocean [10].
The natural flow patterns of the rivers and their tributaries form dendritic kind of drainage pattern in the area [10]. The waters of these rivers, lakes, tributaries and distributaries together with their groundwater components, their flows and fluxes contribute immensely to the origins, growth and dynamics of gullies and landslides all over southeastern Nigeria [9].
Vegetation
The forest flora in the southeastern part of Nigeria is the richest and very diverse, with many families in it being represented by small numbers of species. In the grassland flora the majority of species belong to a few well-represented families. The transition zone vegetation is poorest in species but in other respects intermediate between the forest and the grassland [11]. However, by way of classification, the vegetation in the southeastern states consists mainly of rain forest and woodland and tall. Thus, geographically, Imo state as one of the states is located within the rainforest zone while the remaining states fall under the wood land and tall grass zone [12].
Population, Urbanization & Socio-economy
The population figures for Anambra and Imo according to the 2006 population census were 4,182,032 and 3,934,899 respectively. Anambra State with a landmass of 4,844km2 has the highest population density (863 people per km2). As more rural areas in the Southeastern Nigeria acquire urban status, there is generally improved standard of living, job opportunities and increased literacy level, exposure to people from different parts of the world and improved medical facilities which orchestrate rural-urban migration. However, urbanization results in high cost of living, environmental pollution, deforestation, high population density, high crime rate, impersonality, high rate of accidents and a host of other socioeconomic problems. The increase in demographic growth in population and urbanization put a lot of stress on the system that may result in some of the environmental disasters of floods, soil and gully erosion, landslides, environmental pollution and contamination all compounded by the incidence of global climate change [9].
Methods of Study
The study employed qualitative research methods involving a cross sectional research design using questionnaire survey and interviews. Cross sectional research design aim to provide data on the entire population under study. Cross-sectional studies involve information obtained at a specific time. It may also describe the characteristics of a particular population under study, like the frequency of a particular case study, or it might be based on outcomes of a relationship between phenomenon [13]. Thus, the cross sectional sample of the population was targeted for questionnaire survey for data collection as regards the perceived problems, challenges and management of gully erosion in the study area.
The questionnaire instrument was employed for data collection in this regard. Thus, copies of the questionnaire were administered at household level in selected communities vulnerable to gully erosion. That is, these communities are found in areas of depressions indicating strong gully sites (areas experiencing gully erosion overtime) due to their respective elevation characteristics.
Population of the Study
The population of the study for questionnaire survey involved all communities in the selected states facing the menace of gullies in their environment. However, due to the difficulty in sampling the entire population from communities facing gully erosion challenges; the study therefore systematically obtained a sample size for the questionnaire survey. Thus, based on classifications by areas of depressions and vulnerability analysis conducted for the study, five (5) LGAs for Anambra State and four (4) LGAs for Imo State were carved out (Table 1). From the 5 LGAs under Anambra state 9 communities with high vulnerability to gullies were delineated while 8 communities were delineated under the 4 LGAs in Imo state (Table 1) [14].
Table 1: Study Areas in Anambra and Imo States.

*Selected Communities
Sample size determination
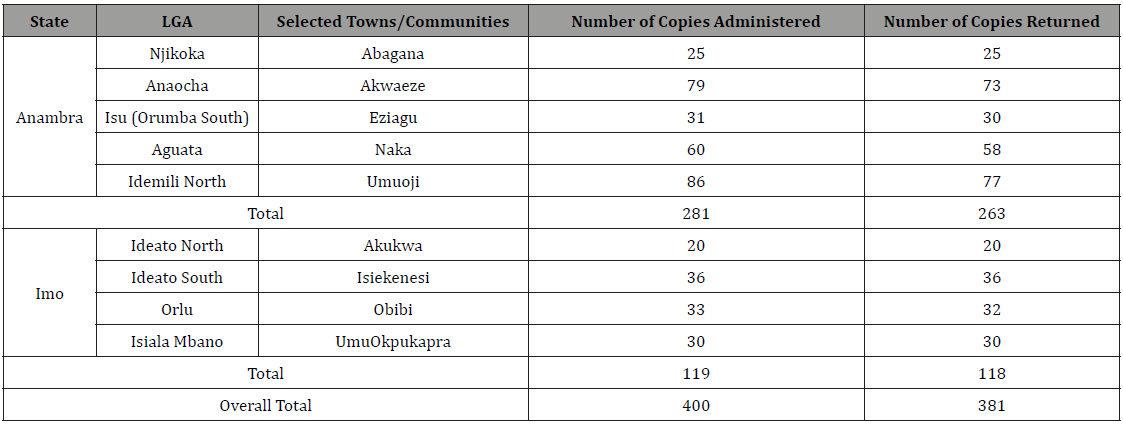
The sample size for the study was determined from the total population of the nine (9) LGAs selected purposively for the study. The population figures projected in year 2019 by National Bureau of Statistics (NBS) as projected from the population figure from the National Population Commission (2006) for each LGA was utilized (Table 2). A total population of 32654 from 9 communities selected for the study was subjected to Yamane (1967) formula for reducing large population sizes. The Yamane (1967) formula is expressed as follows:
Table 2: Details of Sample Size Determination for the Study.

Where,
n = sample size required
N = total population
1 = constant
e = level of significance (0.05)2
That is;
N = 32654; e = 5% = 0.05
When substituted in the equation;
n = 32654 / 1 + 32654 (0.05)2
n = 32654 / 1 + 32654 (0.0025)
n = 32654 / 1 + 81.635
n = 32654 / 82.635
n = 395.169 = 396 (approx.)
Therefore, the sample size of 396 was rounded up to 400 and
this was proportionally distributed among selected communities
using the respective projected population figure for each Town/
community in the study area [15].
Sampling Procedure
The study employed multistage sampling techniques for questionnaire administration. First, purposively the areas of high vulnerability to gully erosions were grouped into clusters of LGAs whereby one community was selected for each LGA for questionnaire survey. Thereafter, random sampling technique was employed for questionnaire administration to respondents for the study. The respondents were household heads who are either a male or female representative at the time of sampling [16]. That is, a male or female head that is economically responsible for his/her household in the study area or an over aged persons or individuals who also occasionally contribute to the income of that household. The characteristics of respondents are mostly farmers and others like traders and artisans (preferences were given to farmers to ensure their participation and contribution to the research).
Sampling Techniques
The sampling techniques employed for the study were purposive and random sampling techniques. The study purposively delineated LGAs mostly affected by gullies and selected one community from each for questionnaire administration. The study employed random sampling technique to administer 400 copies of the questionnaire among targeted respondents in the study area. The random sampling techniques was carried out by administering copies of the questionnaire based on land use types like farmland, residential, transportation and commercial/business areas in the study area. This was done to ensure that the respondents for the study are representation of the study population and have equal chances of being selected for sampling/field survey exercise [17].
Results and Discussion
Socio-economic Characteristics of Sampled Respondents
The information for the socio-economic characteristics of sampled respondents was presented on Table 3. The distribution revealed that 65.9% respondents were male while the remaining 34.1% were females. Therefore, most respondents for the study were males. The age status of sampled respondents for the study showed that 25.7% of sampled respondents falls between 35-40 years of age, 36.0% respondents were between 41-45 years of age; 26.5% of the respondents falls between 46-50 years of age; while the remaining 11.8% were 51 years and above. The information for the level of education for the sampled respondents showed that 39.6% respondents had primary education; 49.9% respondents had secondary education; while the remaining 10.5% respondents have tertiary education [18].
Table 3a: Socio-economic Characteristics of Sampled Respondents.
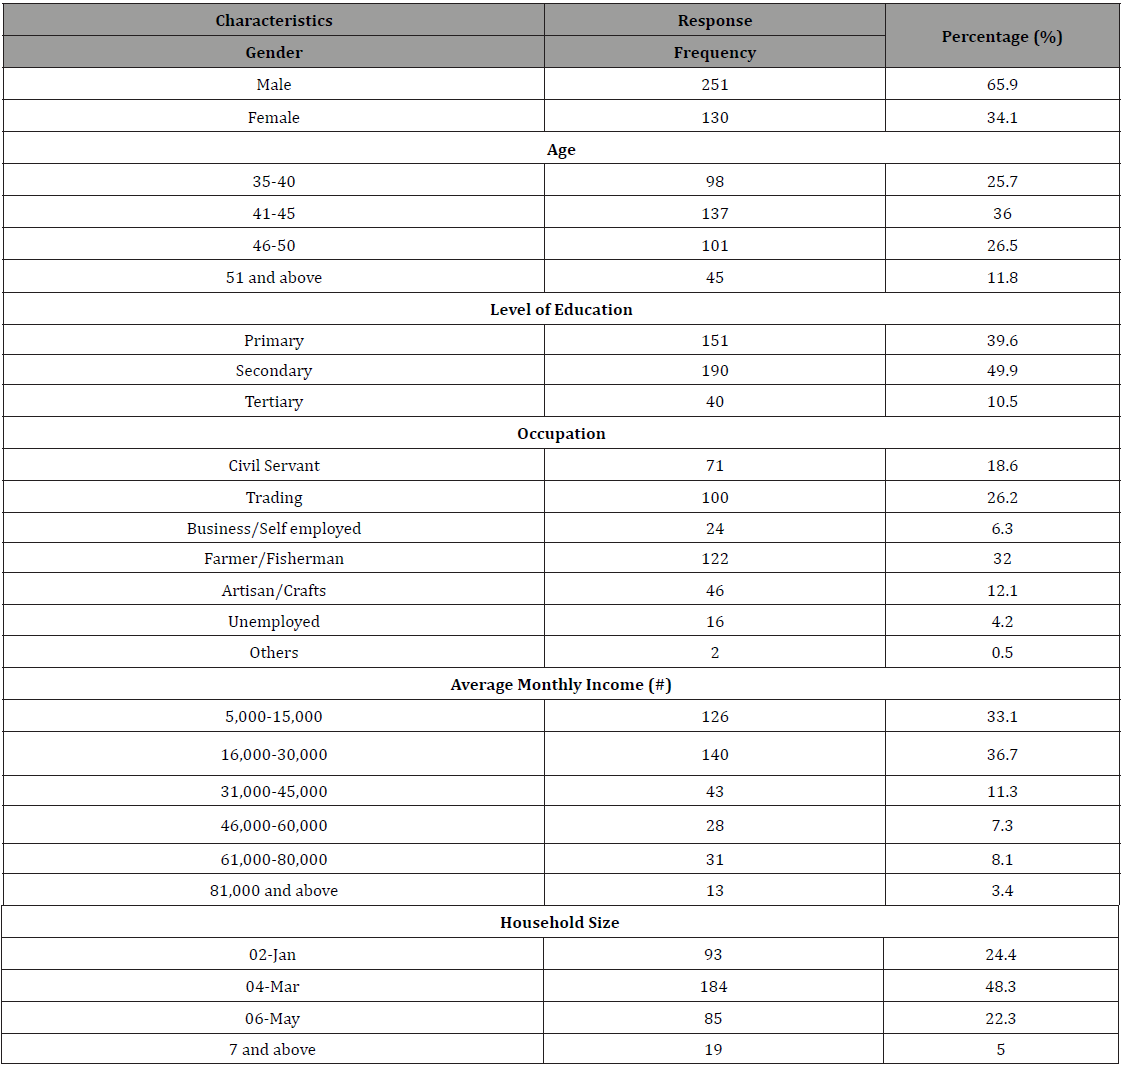
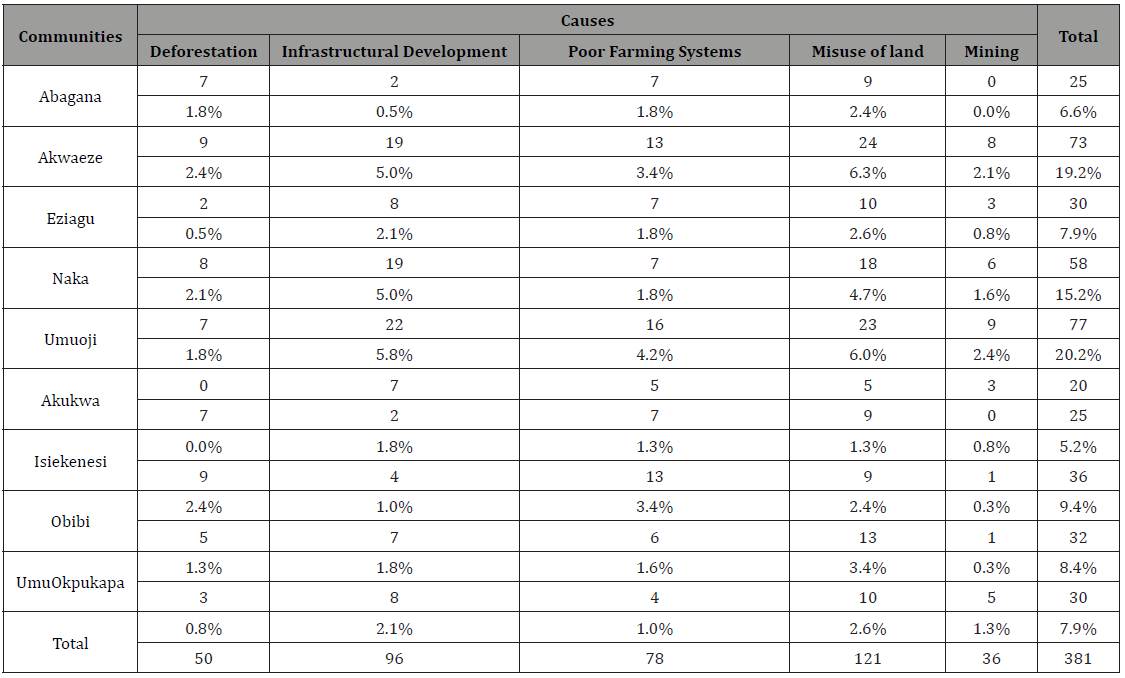
The occupational status of sampled respondents revealed that 18.6% of sampled respondents were civil servants; 26.2% respondents are into trading; 6.3% of respondents are into business or are self - employed; 32.0% of the respondents are farmers and fishermen; 12.1% of respondents are into crafts or artisanship; 4.2% of sampled respondents are unemployed, while the remaining 0.5% respondents are into other forms of business like commercial driving. The survey revealed that most of the respondents for the study were farmers. The information for the average monthly income of respondents showed that 33.1% respondents earns between #5,000 and #15,000; 36.7% respondents earns between #16,000 and #30,000 on the average per month; 11.3% respondents earns between #31,000 and #45,000 averagely per month; 7.3% respondents claimed they earn between #46,000 and #60,000; 8.1% of sampled respondents earn between #61,000 and #80,000; while the remaining 3.4% of the sampled respondents earn between #81,000 and above on the average monthly. The information for the household sizes among sampled respondents indicated that 24.4% of the respondents have household size between 1 and 2. It was also revealed that 48.3% of the respondents have household sizes between 3 and 4; 22.3% of the respondents have household sizes between 5 and 6; while the remaining percentage of the respondents of 5.0% have household sizes of 7 and above in the study area. The causes of gully erosion in the area is shown in Table 3b.
Table 3b: Causes of Gully Erosion.
Effects of Gully Erosion among Sampled Communities
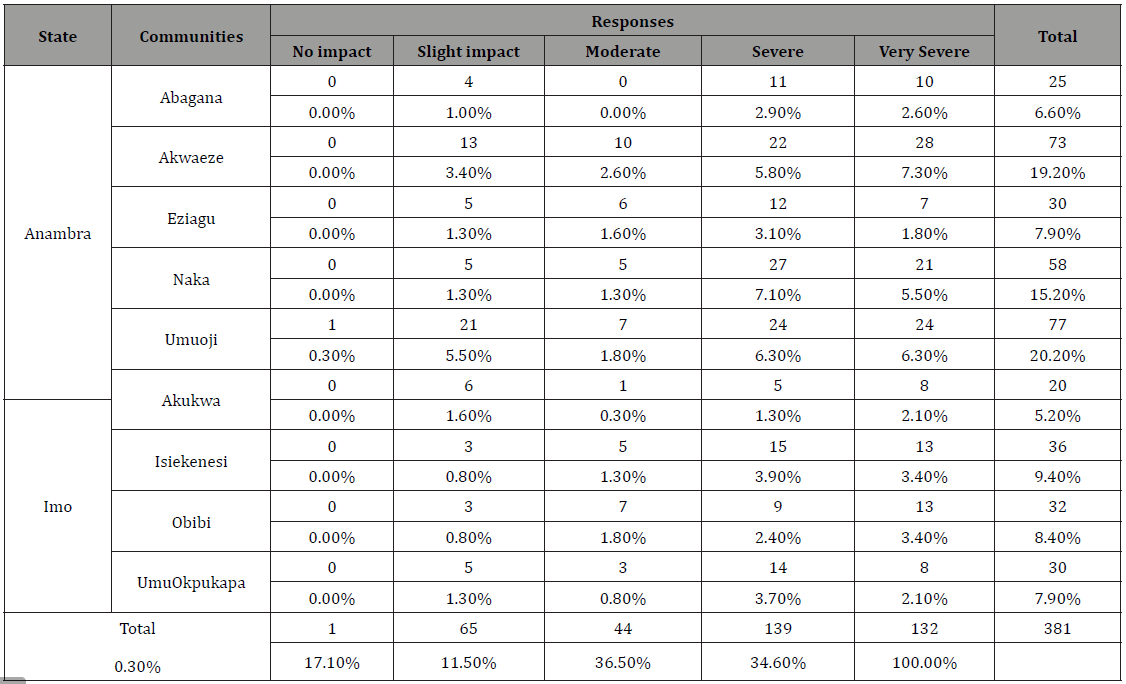
The information for the causes of gully erosion among sampled communities in the study area is displayed on Table 4. The distribution showed that 13.1% respondents believed that it has been caused by deforestation; 25.2% of the respondents indicated infrastructural development causes; 20.5% of the sampled respondents indicated poor farming systems; 31.8% of the respondents were of the opinion that the misuse of land contributes more to the causes of gully erosion in the study area; while the remaining 9.4% of the respondents indicated mining as one of the causes of gully erosion in the study area. The distribution revealed that majority of sampled respondents indicated land misuses as a prominent factor leading to gully erosion formation in the study area.
Table 4: Effects of Gully Erosion.
Gully Erosion as a Threat
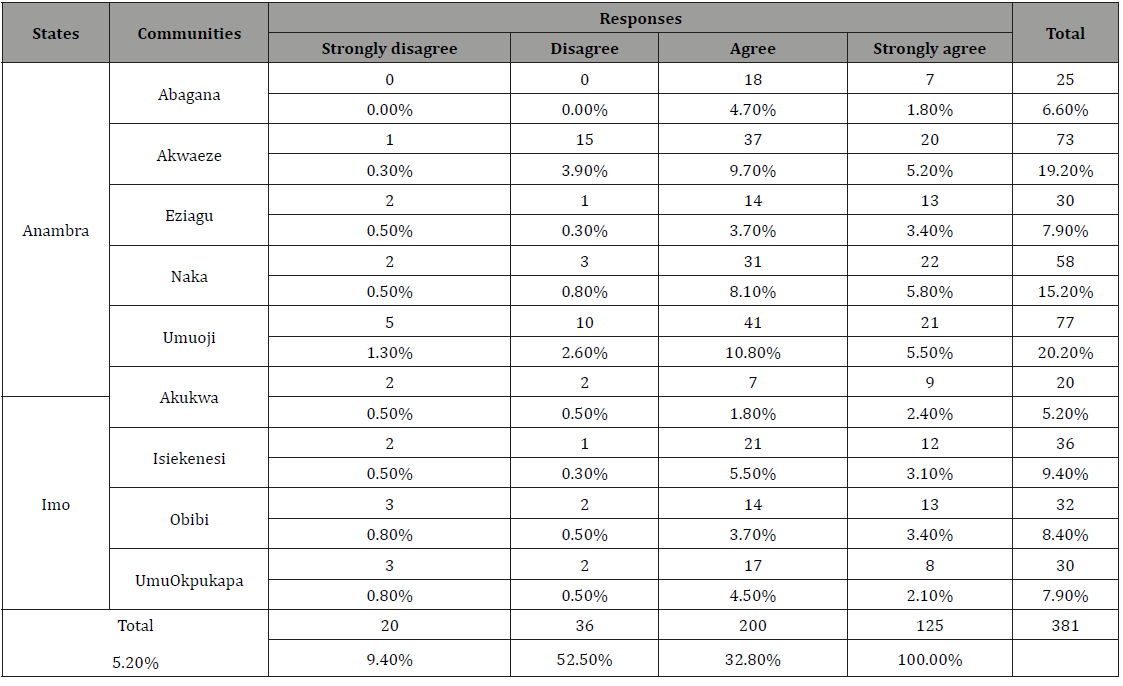
The information for the percentage number of respondents that perceived gully erosion to be a threat is displayed on Table 5. It was revealed that 85.3% of the sampled respondents for the study agreed that gully erosion is a threat to their existence; while the remaining 14.7% of the respondents did not agree that they are threatened by gully erosion. Thus, majority of the respondents are threatened by gully erosion in the study area.
Table 5: Perceived Number of People seeing Gully Erosion as a threat
Direct Impacts of Gully Erosion
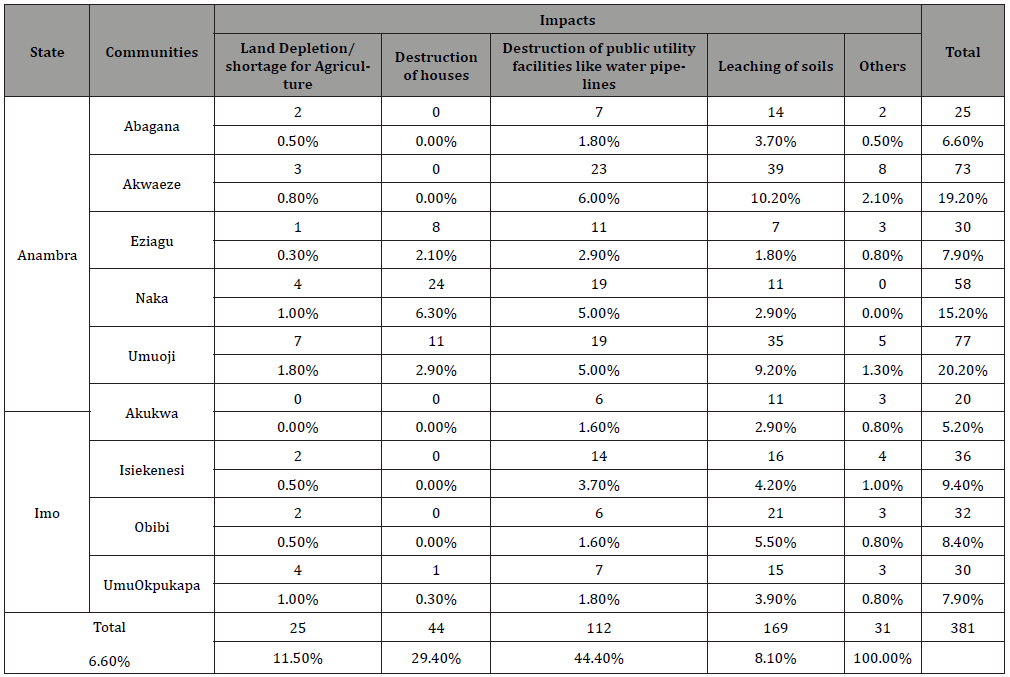
The direct impacts of gully erosion in the study area are displayed on Table 6. It was revealed that 6.6% respondents with indicated land shortage and depletion; 11.5% respondents indicated the destruction of buildings; 29.4% of respondents indicated the destruction of public facilities; 44.4% of the respondents have also indicated the impacts as leaching of the topsoil’s exposing the land for further degradation. The others which were 0.8% have indicated other types of worries created by gully erosion impacts. The study therefore noted that gullies have impact on depletion of the soil through constant action of erosion and these have several implications for food production which is the primary economic activity engaged on by the majority of residents in the study area (Table 6).
Table 6: Direct Impact of Gully Erosion.
Knowledge of Time period for Gully Erosion Experience
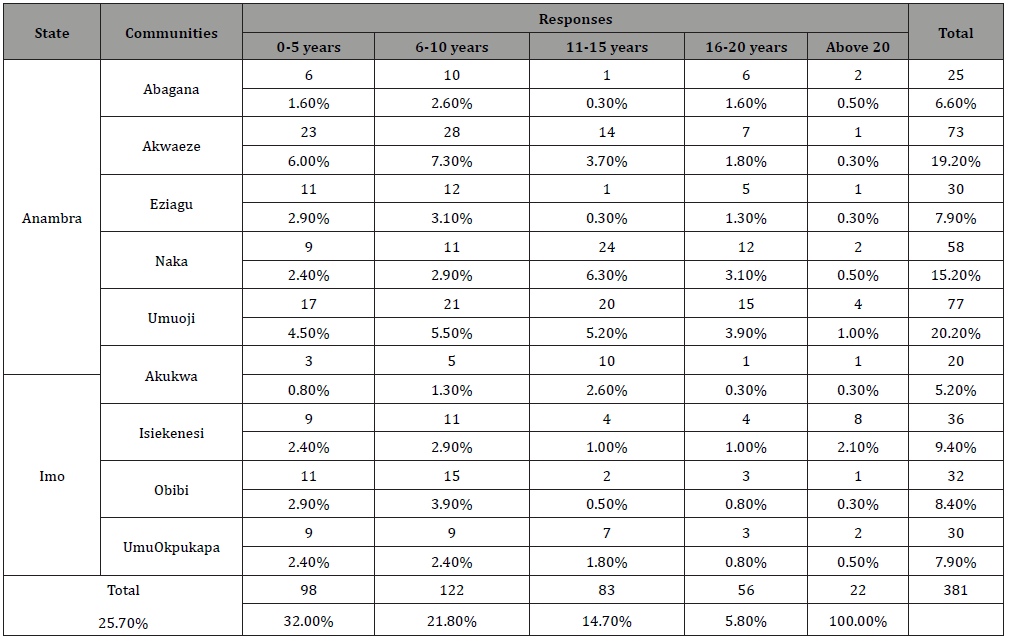
The menace of gully erosion has been evident overtime. However, the knowledge of time period varied among sampled respondents. The results showed that 25.7% of sampled respondents have been experiencing the menace of gully erosion for a period of at least 5 years; 32.0% have been noticing it for at least 10 years. 21.8% of sampled respondents have been battling with it for a period between 11 years and 20; 14.7% of sampled respondents claimed evidence of the menace of gully erosion for at least 20 years while the remaining 5.8% respondents have 20 years and above experience of gully erosion (Table 7). Therefore, majority of respondents have experienced gully erosion for at least 15 years in the study area.
Table 7: Knowledge of Time Period Respondents have been Experiencing Gully Erosion.
Socio-economic Impacts of Gully Erosion
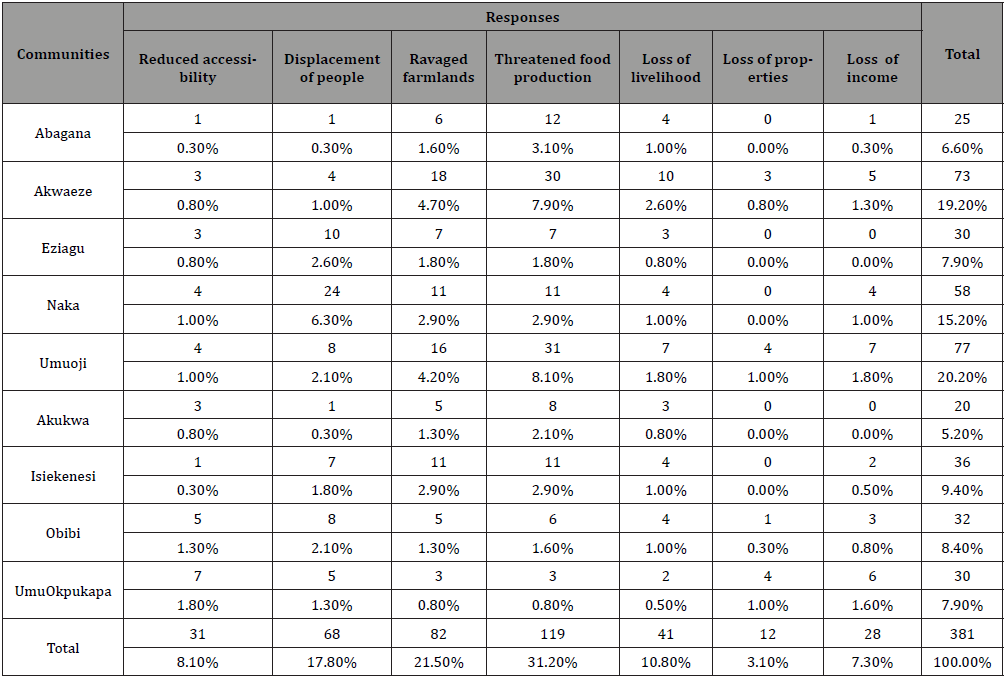
The information for the socio-economic impacts of gully erosion is presented on Table 8. The identified impacts as perceived by respondents were reduced accessibility (8.1%); displacement of people (17.8%), ravaged farmlands (21.5%); threatened food production (31.2%); Loss of livelihood (10.8%); loss of properties (3.1%); and loss of income (7.3%). However, majority of sampled respondents indicated threatened food production as the major socio- economic impact of gully erosion in the study area.
Table 8: Socio-economic Impacts of Gully Erosion in the Study Area.
Agent of Support
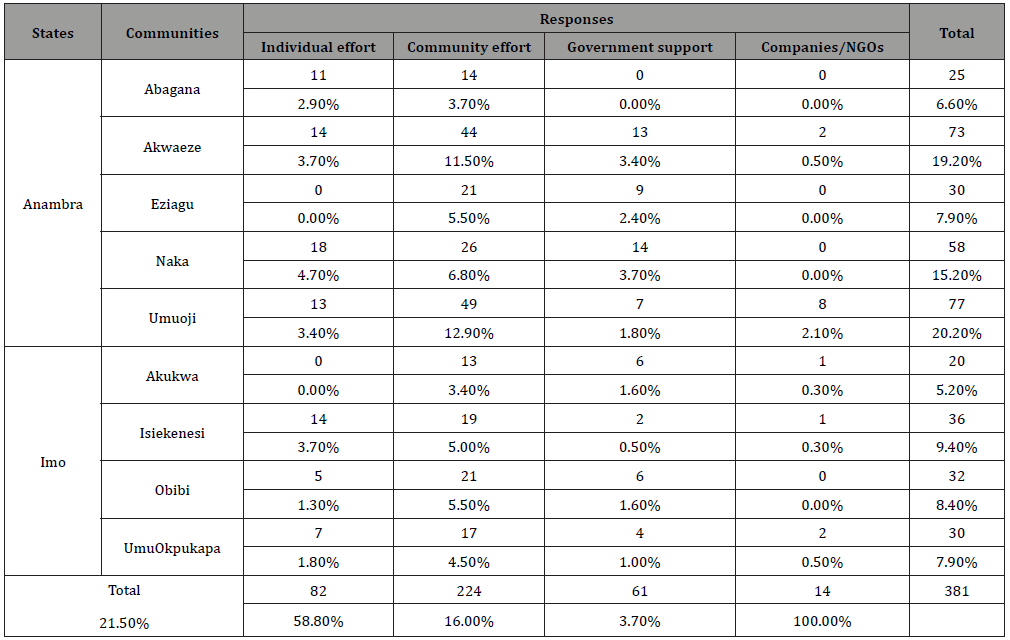
The information for the agent of support for employed remediation measures are displayed on Table 9. It revealed that individual (21.5%) and community (58.8%) efforts are the major agents of support for employed remediation measures to manage gully erosion in the study area. However, only 16.0% of sampled respondents indicated that they received efforts from the government and another 3.7% of sampled respondents claim they receive efforts from the companies and non-profit organizations. The study therefore concludes that community efforts were the most received efforts in combating the menace of gully erosion in the study area.
Table 9: Agent of Support for Employed Measures.
Adaptive/Remediation Measures Employed to manage Gully Erosion Problems in the Study Area
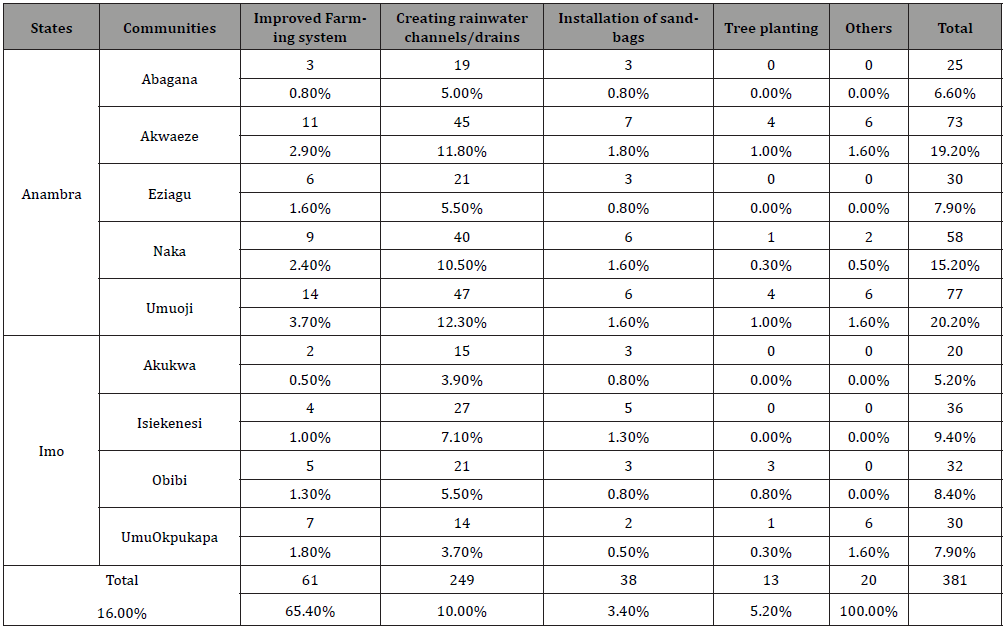
The remediation measures employed by sampled residents in the study area are displayed on Table 10. The information for the remediation measures employed indicated that 16.0% of the respondents have improved their farming systems; 65.4% of the respondents have created rain water channels/drains; 10.0% of the respondents have installed sandbags; 3.4% of respondents are into planting of trees while 5.2% are engaged in other measures like construction of fences and sand filling of gully channels. The study discovered that majority of sampled respondents are creating drains to help manage water flow movements in the study area.
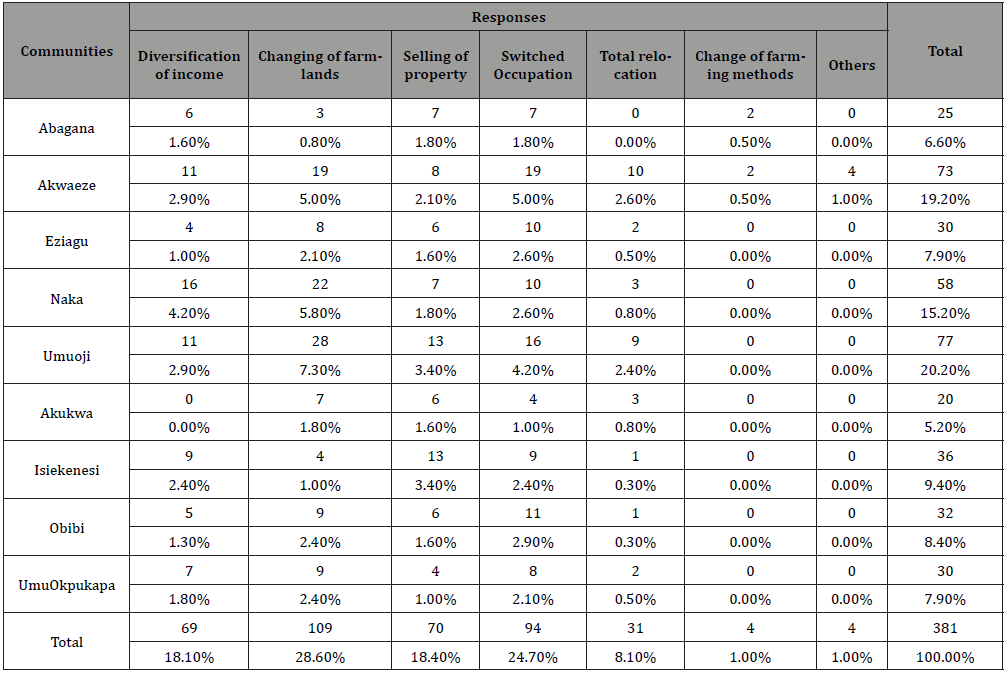
The information for the adaptive measures employed by sampled community residents to cope with gully erosion is displayed on Table 11. The diversification of income was indicated by 18.1% of sampled respondents; changing of farmlands was indicated by 28.6% of respondents; selling of property was indicated by 18.4% of sampled respondents; 24.7% of respondents switched occupation; 8.1% of respondents have faced total relocation; 1.0% are practicing change in farming methods; while other respondents (1.0%) have claimed they abandoned their lands or left it to fate.
The implication for all the highlighted measures are the drastic changes it will cause among residents especially on their socio-economic livelihood; loss of income, and most importantly reduction in food production. For example, this means that farmers especially with ravaged farmland will have no farmlands to cultivate and might incur more on their spending when they reach for new farmlands.
Table 10: Remediation Measures Employed for Gully Erosion Management.
Level of Effectiveness of Adaptive Capacities
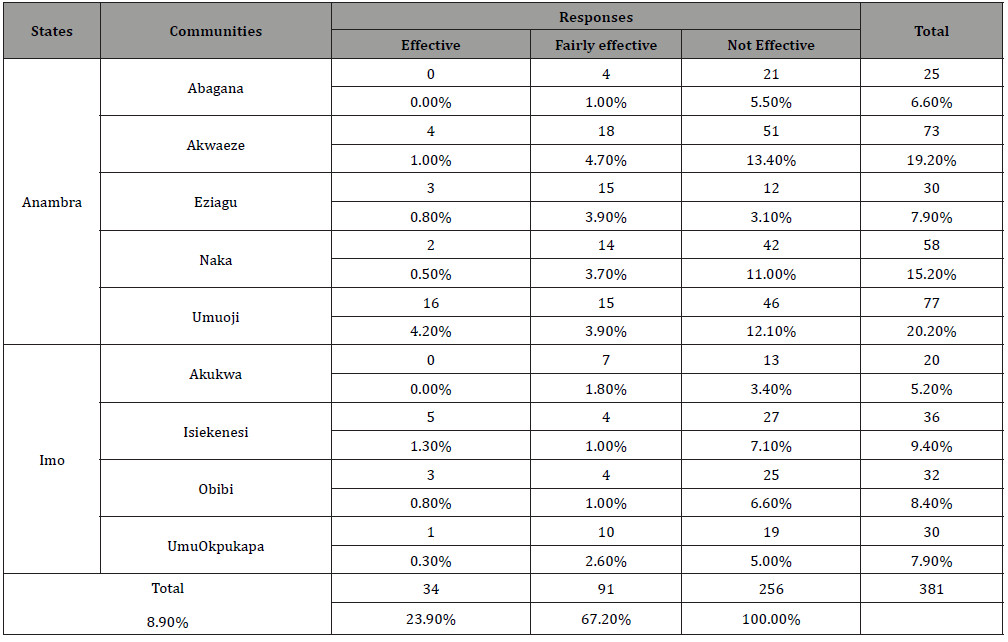
The level of effectiveness of adaptive capacities of communities to gully erosion is displayed on Table 11. The measures employed by residents were not effective as majority of sampled respondents (67.2%) indicated; however, 23.9% of sampled respondents rated it as fairly effective; while the remaining 8.9% of respondents believed their employed measures to be effective. Thus, adaptive capacities of residents in affected gully erosion areas in Anambra and Imo States have not been effective. This will definitely lead to increased socio-economic effects which have several implications on their potential for growth and development in the study area.
Table 11: Adaptive Measures Employed by Communities to Cope with Gully Erosion.
Constraints to Level of Effectiveness of Adaptive Measures Employed
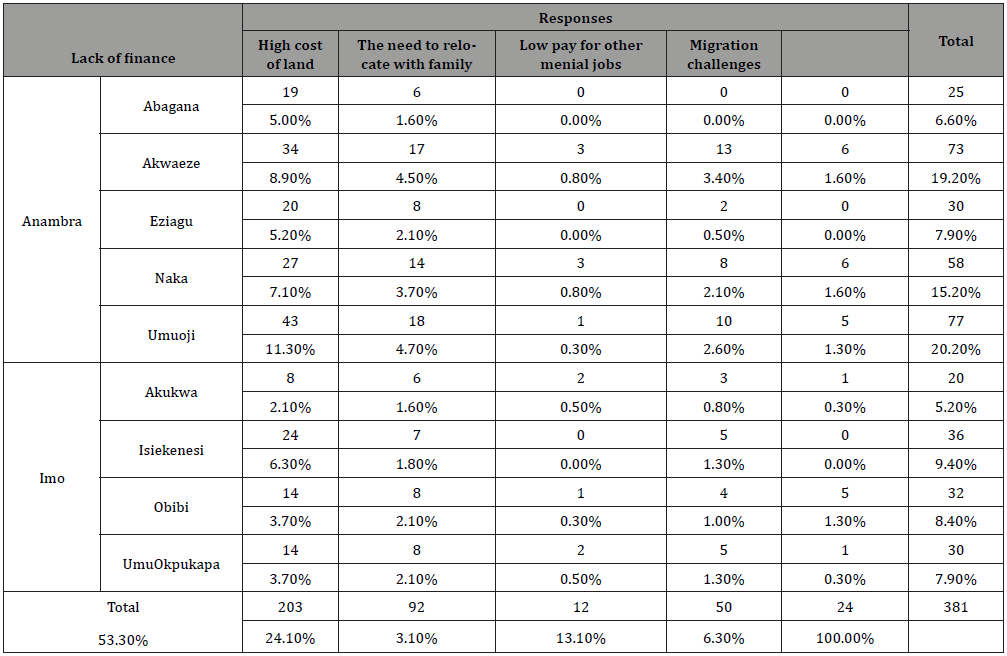
The information for the constraints or reasons for level of effectiveness of employed adaptive measures are displayed on Table 12. The distribution showed that 53.3% of sampled respondents indicated the lack of finance; 24.1% of sampled respondents indicated high cost of land; 3.1% of sampled respondents indicated the need to relocate; 13.1% of sampled respondents indicated low pay for other menial jobs; while the remaining 6.3% of sampled respondents indicated migration problems. Thus, lack of finance is a major constraint affecting level of effectiveness of employed adaptive measures to cope with the challenges of gully erosion in the study area.
Table 12: Level of Effectiveness of Adaptive Capacities of Communities to Gully Erosion.
Summary and Conclusion
This study revealed that the remediation measures employed indicated that 16.0% of the respondents have improved their farming systems; 65.4% of the respondents have created rain water channels/drains; 10.0% of the respondents have installed sandbags; 3.4% of respondents are into planting of trees while 5.2% are engaged in other measures like construction of fences and sand filling of gully channels. The study discovered that majority of sampled respondents are creating drains to help manage water flow movements in the study area (Table 13).
Table 13: Constraints to Level of Effectiveness of Employed Adaptive Measures.
The diversification of income was indicated by 18.1% of sampled respondents; changing of farmlands was indicated by 28.6% of respondents; selling of property was indicated by 18.4% of sampled respondents; 24.7% of respondents switched occupation; 8.1% of respondents have faced total relocation; 1.0% are practicing change in farming methods; while other respondents (1.0%) have claimed they abandoned their lands or left it to fate.
The implication for all the highlighted measures are the drastic changes it will cause among residents especially on their socio-economic livelihood; loss of income, and most importantly reduction in food production. For example, this means that farmers especially with ravaged farmland will have no farmlands to cultivate and might incur more on their spending when they reach for new farmlands.
The level of effectiveness of adaptive capacities/measures employed by residents were not effective as majority of sampled respondents (67.2%) indicated; however, 23.9% of sampled respondents rated it as fairly effective; while the remaining 8.9% of respondents believed their employed measures to be effective. Thus, adaptive capacities of residents in affected gully erosion areas in Anambra and Imo States have not been effective. This will definitely lead to increased socio-economic effects which have several implications on their potential for growth and development in the study area.
Acknowledgement
None.
Conflict of Interest
No conflict of interest.
References
- Christensen PR (2003) Formation of recent martian gullies through melting of extensive water-rich snow deposits. Nature 422 (6927): 45–58.
- Amangabara GT (2014) Understanding Effective Gully Control Measures in Imo State, Nigeria. Canadian Open Soil and Erosion Journal 1(1): 1-9.
- Nwankwo C, Nwankwoala HO (2018a). Gully erosion susceptibility mapping in Ikwuano Local Government Area of Abia State Using GIS Techniques. Earth Sciences Malaysia 2(1): 08-15.
- Nwankwo C, Nwankwoala HO (2018b) Analysis of a 36-Year Rainfall Data (1980-2015) for Erosivity Potential in Ikwuano Local Government Area of Abia State, Southeastern Nigeria. The Nigerian Journal of Cartography and GIS 12(1&2): 87-101.
- Malin MC, Edgett KS (2000) Gully erosion. Science 288: 2330–2335.
- Anejionu OCD, Nwilo PC, Ebinne ES (2013) Long term assessment and mapping of erosion hotspots in Southeastern Nigeria. FIG working week, environment for sustainability Abuja 19p.
- Ogala JE, AO Ola Buraimo, IM Akaegbobi (2009) Palynologicaland Palaeoevironmental study of the Middle-Upper Maastrichtian Mamu Coal facies in Anamabra Basin, Nigeria. World Applied Science Journal 7(12): 1566-1575.
- Nwankwo GI, Udoka PU, Egboka BC, Opara AI (2015) The Mechanics of Civil –Works Induced Gully Erosion: Applications to Development of Preventive Measures in Southern Eastern Nigeria. Applied Ecology and Environmental Sciences 3(2): 60-65.
- Egboka, BCE, Orji AE, Nwankwoala, HO (2019) Gully Erosion and Landslides in Southeastern Nigeria: Causes, Consequences and Control Measures. Glob J Eng Sci 2(4).
- Igbokwe JI, JOB Akinyede, BT Dang, TMN Alaga, MN Ono et al. (2008) Mapping and Monitoring of the impact of gully erosion in southeastern Nigeria with satellite remote sensing and geographic information system. The International Archives of the Photogrammetry. Remote Sens Spat Inf Sci 37: 865–871.
- Hall SB, Medler, JA (1975) Highland vegetation in south-eastern Nigeria and its affinities. Vegetation 29: 191-198.
- CANUK (2011) About the Country Nigeria. Archived from the original on 16 March 2011.
- Schmidt AO, Kohlmann T (2008) When to use the odds ratio or the relative risk? Int J Public Health 53(3): 165–167.
- Costard F, Forget F, Mangold N, Peulvast JP (2002) Formation of recent martian debris flows by melting of near-surface ground ice at high obliquity. Science 295: 110–113.
- Igbokwe T (2018) Geotechnical analysis and catchment management of gully erosion in Agulu Nanka, Anambra State. Unpublished MSc thesis submitted to the Institute of Natural Resources, Environment and Sustainable Development, University of Port Harcourt, Nigeria, pp.152.
- National Bureau of Statistics (2019). Statistical Operations in Nigeria.
- National Population Commission (NPC) (2006). Anambra State in Nigeria.
- Yamane T (1967) Statistics: An Introductory Analysis, 2nd Harper and Row, New York.
-
Igbokwe T, HO Nwankwoala, Orluchukwu JA. Adaptation and Management Practices of Communities Vulnerable to Gully Erosion in Anambra and Imo States, Nigeria. Glob J Eng Sci. 9(2): 2022. GJES.MS.ID.000714.
-
Poverty alleviation, National student source credit student loan policy, Poverty alleviation without returning to poverty, Rural revitalization
-

This work is licensed under a Creative Commons Attribution-NonCommercial 4.0 International License.
- Abstract
- Introduction
- Description of the Study Area
- Methods of Study
- Population of the Study
- Sampling Procedure
- Sampling Techniques
- Results and Discussion
- Effects of Gully Erosion among Sampled Communities
- Gully Erosion as a Threat
- Direct Impacts of Gully Erosion
- Direct Impacts of Gully Erosion
- Knowledge of Time period for Gully Erosion Experience
- Socio-economic Impacts of Gully Erosion
- Agent of Support
- Adaptive/Remediation Measures Employed to manage Gully Erosion Problems in the Study Area
- Level of Effectiveness of Adaptive Capacities
- Constraints to Level of Effectiveness of Adaptive Measures Employed
- Summary and Conclusion
- Acknowledgement
- Conflict of Interest
- References


