 Research Article
Load-Settlement Behavior of a Shallow Foundation in Saturated Clay Assessed from Geophysical Shear Wave Velocity
Gary Norris*, Horng-Jyh and Sherif Elfass
Civil and Environmental Engineering, University of Nevada, Reno, USA
Gary Norris, Civil and Environmental Engineering, University of Nevada, Reno, USA.
Received Date:March 15, 2024; Published Date:April 12, 2024
Abstract
method for the preliminary evaluation of the load-settlement response of a shallow foundation based on the soil’s shear wave velocity (Vs) was presented at the 71st Highway Geology Symposium. That presentation was meant to provide for the planning of a more detailed assessment following the response established from the geophysical data obtained during an information gathering phase of the project that would include collecting publicly available geologic, soil survey and well drilling information. The 71st Highway Geology Symposium presentation provided separate assessments for drained c- soil and undrained saturated clay c strength soil. The current presentation is a more complete treatment of the saturated clay soil case than that based on the evaluation of the Standard Penetration Test (SPT) N60 blow count from an average of the N60 vs Vs relationships found in the literature. The current assessment builds on the background provided by Skempton, Peck-Hanson and Thornburn, Teng, Reese, Schmertmann and Sowers. While not needed, the evaluation of the Standard Penetration Test (SPT) blow count from the shear wave velocity is also explored. Such determination allows comparison of the Vs based N60 value with that obtained if the project proceeds to SPT testing and sampling, accompanied by grain size distribution, Atterberg limits (LL, PI) and soil classification assessment.
Introduction
A method is presented for preliminary assessment of the load versus settlement and bearing capacity of a footing to be situated in a saturated clay. The analysis is based on the shear wave velocity (Vs) assessed from a geophysical survey of the prospective site. The undrained shear strength (c or Su) of the clay is obtained from a derived relationship based on the shear wave velocity. The initial tangent shear (Go) and Young’s (Ei) moduli are assessed from the shear wave velocity at the geophysical field test strain of 1 x 10⁻⁶. The secant Young’s modulus (E) and strain (ε) at a specified stress level (SL) are determined from a modulus reduction relationship after Ashour and Norris [1] that is a function of the strain, ε50, at the stress level (SL) of 50% of the unconfined compressive strength (qu =2 Su). The ε50, in turn, is obtained from a relationship based on the Reese (1980) plot of ε50 versus Su. With strain, ε, as a function of SL(ε=SLe3.707SLε50 /λ ) used at the peak of the Schmertmann et al. [2] strain triangle, the immediate settlement (ρ) then becomes the area of the triangle (e.g., ρ = ε B for a square foundation). The net bearing capacity, qnet, equal to c Nc, is assessed knowing the footing width (B), length (L), embedment depth (D) and the soil’s undrained shear strength (c = Su), with the bearing capacity factor, N, a function of L/B and D/B. The mobilized bearing pressure, qnet,m, at the specified SL (corresponding to strain, ε and settlement, ρ) is SL qnet. By varying SL, a plot of applied/mobilized pressure, qnet,m, versus immediate settlement, ρ, can be generated. The foundation column load is just this pressure times the footing area, BL. The proposed method yields the immediate settlement, to which consolidation settlement is to be added.
Methodology
From the geophysical field test’s shear wave velocity (Vs), the initial shear (Go) and Young’s (Ei) moduli are assessed corresponding to the field shear strain of 1 x 10⁻⁶, i.e.

where g is the value of gravity, 32.2 ft/sec2, and γ is the unit weight of the soil (in lb/ft3 or pcf) within the width (B) below the base of the intended foundation. Poisson’s ratio, ν is taken equal to 0.5 for undrained response of the saturated clay.
Based on the established stress-strain relationship [1,3,4,5]

where ε is the axial strain in the standard undrained triaxial test; SL (= sd/sdf) is the stress level, equal to the ratio of the current to failing deviator stress; ε50 is the strain at SL = 0.5 and λ is the fitting parameter that varies with stress level (Eq. 2b). From this relationship, it follows that Young’s modulus at any stress level is

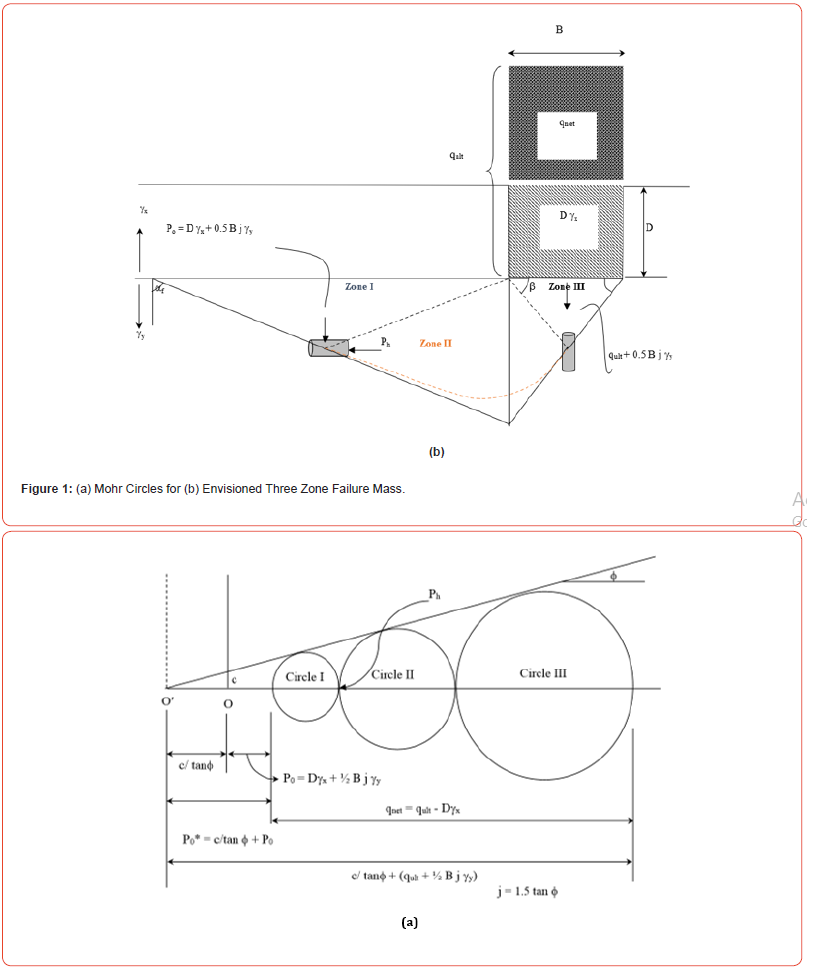
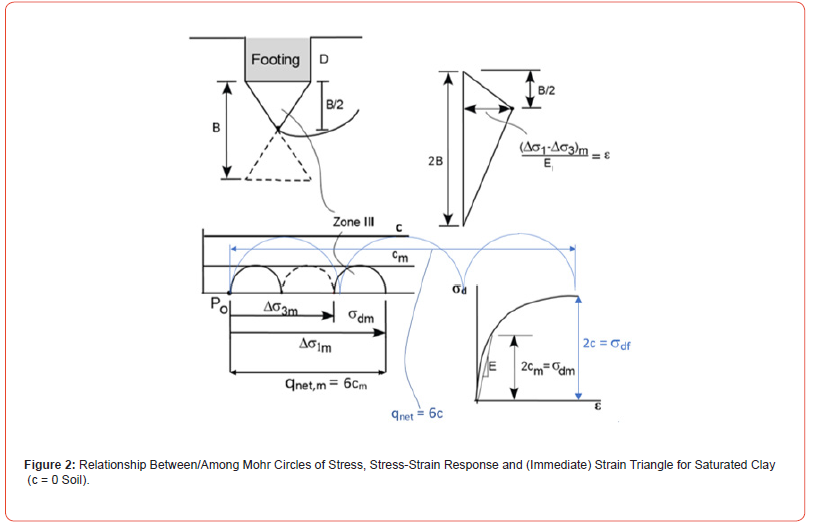
The three-zone failure mass envisioned for bearing capacity analysis [3] of a c-φ soil is pictured in Figure 1. The stress state and the associated Mohr-Coulomb failure envelope for the undrained soil mass is pictured in Figure 2, where friction, φ, is zero. Note in Figure 2, the pictured strain triangle after Schmertmann et al. [2] and the relationship of the strain at its peak at B/2 depth below a square footing, corresponding to the average element in Zone III of Figure 1b, and the mobilized deviatoric stress (sd) and secant Young’s modulus (E) from an undrained triaxial test of the saturated clay. The ratio of the net mobilized pressure, qnet,m, applied to the footing, compared to the net bearing capacity, qnet, in Figure 2, is the same ratio as the corresponding deviatoric stress (sd) to the deviatoric strength (sdf = 2 Su) in each of the three zones of the ensuing failure mass. This ratio is the stress level (SL) of Eq. 2. This same ratio of (qnet,m / qnet) is the pressure level, PL. Therefore, PL and SL are the same for undrained, saturated clay. (This is not the case for a c-φ strength soil.)
Note that the traditional safety factor (SF) relative to bearing capacity failure is given by the ratio of pressures, net ultimate to the applied/mobilized pressure,

which is, therefore, the reciprocal of the SL (and PL).
The immediate settlement of the footing, ρ, is the integration of the strain in Zone III directly beneath the foundation with depth. Such integration is the area of the Schmertmann strain triangle; but the strain triangle changes with SL because the ε at its peak changes with SL. The area of the triangle of Figure 2 is

The above pictured response in Figure 1 and Figure 2 correspond to a square foundation (L = B). The horizontal distance between the lower end of failure circle I and upper end of failure circle III (for SL = PL = 1 in the soil) represents the net bearing capacity, i.e. qnet = 6c. Since qnet = c Nc from traditional bearing capacity theory for the square footing at the soil surface (D = 0), the bearing capacity factor, Nc, is 6, the number of radii of the 3 circles, while qnet,m = cmNc = 6cm (since cm = SL c). The same square footing, when embedded (i.e. D > 0), yields an Nc that is greater than 6, as shown in Figure 3a. Such variation in Nc from 6 to 9 with D/B can be expressed as equal to 6 times an embedment factor (given in Figure 3b). The variation of embedment factor with D/B of Figure 3b is just the variation in Nc with D/B divided by 6. Note that at D/B = 4, where Nc = 9, qnet and qnet,m would correspond to 9 radii of c and cm circles, had they been plotted in Figure 2.
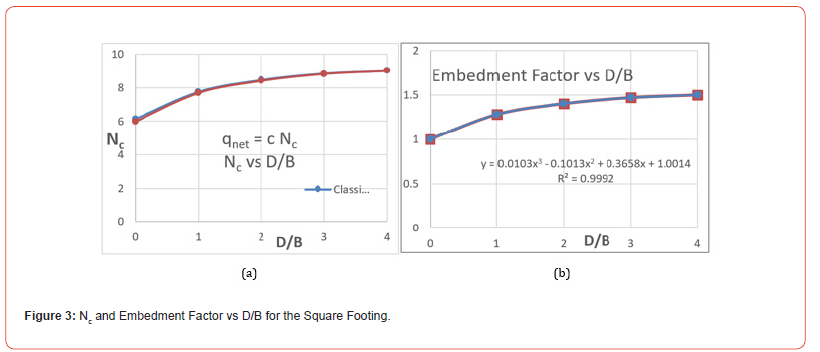
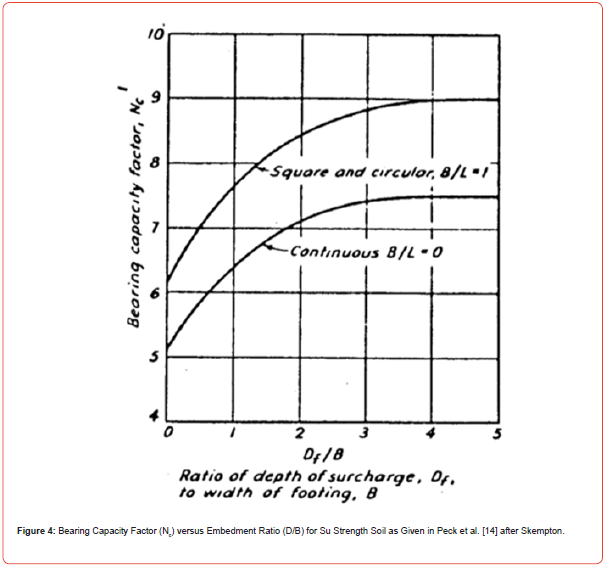
The variation in Nc of a strip footing (L/B = ∞) with D/B is shown as the lower curve in Figure 4. Its Nc varies from 5 at D/B = 0 to 7.5 at D/B =4. Teng (1962) provides the simple expression, Nc = 5 (1 + 0.2 B/L) (1 + 0.2 D/B), for D/B ≤ 2.5, for all B/L. The component, 5 (1 + 0.2 B/L), is the means of assessing the change in Nc with foundation shape from 5 at B/L = 0, to 6 at B/L = 1, and values of Nc between for other B/L values. However, a better characterization of embedment than Teng’s (1 + 0.2 D/B) would be the use of the variation expressed in Figure 3b, which applies equally to the strip footing.
For L/B = ∞, the Schmertmann strain triangle of Figure 2 grows deeper, with its peak (i.e. strain, ε occurring at depth equal to B. The triangle for the strip/continuous footing (B/L = 0) diminishes to zero at a depth of 4B. The effect of the change in the shape and area of the strain triangle on the immediate settlement, ρ, for L > B, can be expressed as follows:

Assessing Su and ε50 From Sear Wave Velocity
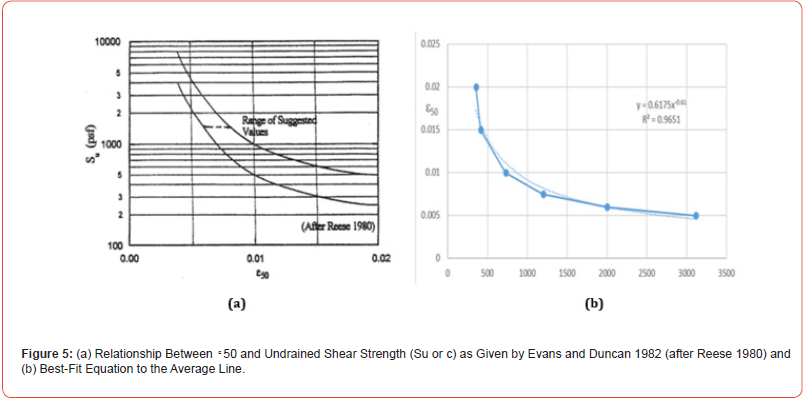
All of the aforementioned analysis applies once the value of ε50 has been established. Fortunately, ε50 can be expressed as a function of the undrained shear strength, Su (i.e. c), if an equation can be furnished for an average line that plots midway through the range shown in Figure 5a as it appears in Ashour et al. [6]. An equation representing such a line, rearranged to express ε50 as a function of Su, as shown in Figure 5b, is

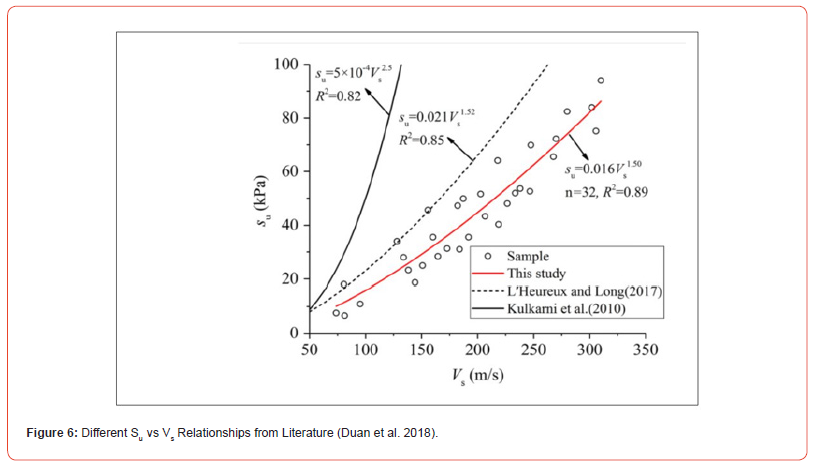
It is the geophysical survey’s assessed shear wave velocity (Vs) that is the mechanism by which Su and then ε50 are obtained. But rather than adopt one of the Su - Vs relationships from the literature, as represented for instance, in Figure 6, consider the following derivation.
If Ei, as assessed from Vs as given in Eq. 1, and Ei, based on the stress strain formulation of Eq. 3, i.e.



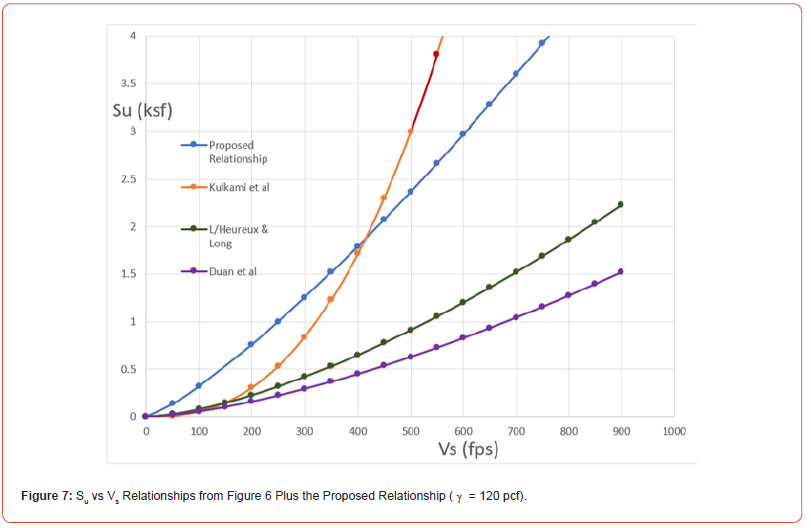
with Su in lb/ft2 (psf) and Vs in ft/sec (fps). Note that Eq. 9b plots as shown in Figure 7 relative to the curves of Figure 6 expressed in units of kips/ft2 vs ft/sec. Based on Eq. 9b, ε50 can then be assessed from Eq. 6 for the corresponding shear wave Vs value.
Tabulation and Plot of Pressure/Load Versus Settlement
spreadsheet can be established, that, for a column of SL values, computes in successive columns, the triaxial test deviatoric stress (sd = SL·2 Su), λ (Eq. 2b), ε (Eq. 2a), E (= sd / ε), qnet,m [= SL 5 Su (1 + 0.2 B/L) · Embedment Factor], SF (=1/SL), PL (= SL), ρ [= εB (0.9 + 0.1 L/B) ≤ 2εB] and Column Load (= qnet,m BL). The input required for the column computations is B, L, D and, γ and Vs, to compute Su (Eq. 9b) and ε50 (Eq. 6).
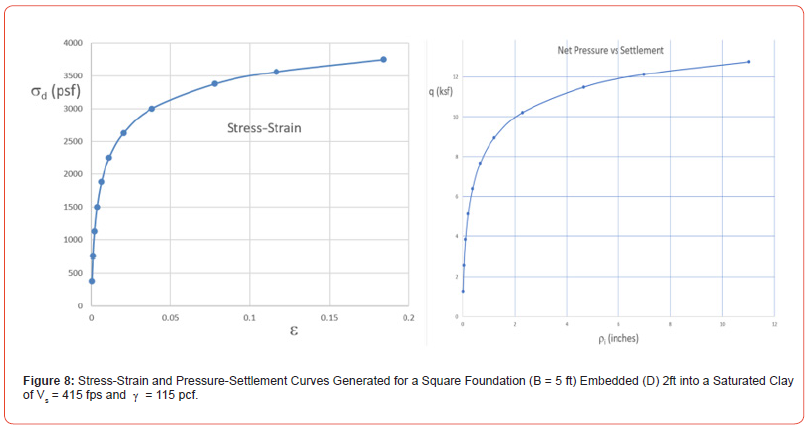
If a shear wave velocity of Vs = 415 ft/sec and a unit weight of γ = 120 lb/ft3 are assumed, the proposed relation (Eq. 9b) yields a Su of 1.88 ksf, which matches the Kulkami et al. equation (Figure 6) value in converted units (kPa value converted to ksf for m/s expressed in fps). This velocity (Vs) of 415 fps is where Kulkami et al. and the proposed curves cross in Figure 7. Figure 8 is a plot of the triaxial test stress-strain, and the pressure-settlement curves generated from the spreadsheet assessment described above. The pressure-settlement curve shown represents a square foundation of width B equal to 5 ft.
It is to be understood that if a different relationship, other than the proposed one (Eq. 9b), is used to assess the undrained shear strength, Su, this will yield an inconsistency. If Su from a different Vs relationship is employed, then, if in succession, ε50 (Eq. 6), ε50 (= Su / ε50), and Ei (Eq. 3 reversed) are calculated, the value of Vs from a reversed Eq. 7a will not match the value employed to get Su. Furthermore, other Vs – Su relationships for clay are not necessarily for a saturated clay, in which case the strength relationship will be a c-φ relationship, not a Su one.
Relationship Of Standard Penetration Blow Count N60 to Vs
While not needed for the aforementioned analysis, it is possible to employ the above approach to establish a relationship between the Standard Penetration Test (STP) blow count, N60, and shear wave velocity, Vs, for saturated clay. Such determination will allow comparison of the Vs based N60 value, so obtained, with that if the project proceeds to SPT testing, and accompanied grain size analysis, Atterberg limits (LL, PI) evaluation and soil classification. Reasonable agreement would then yield credence to the predicted load-settlement response.
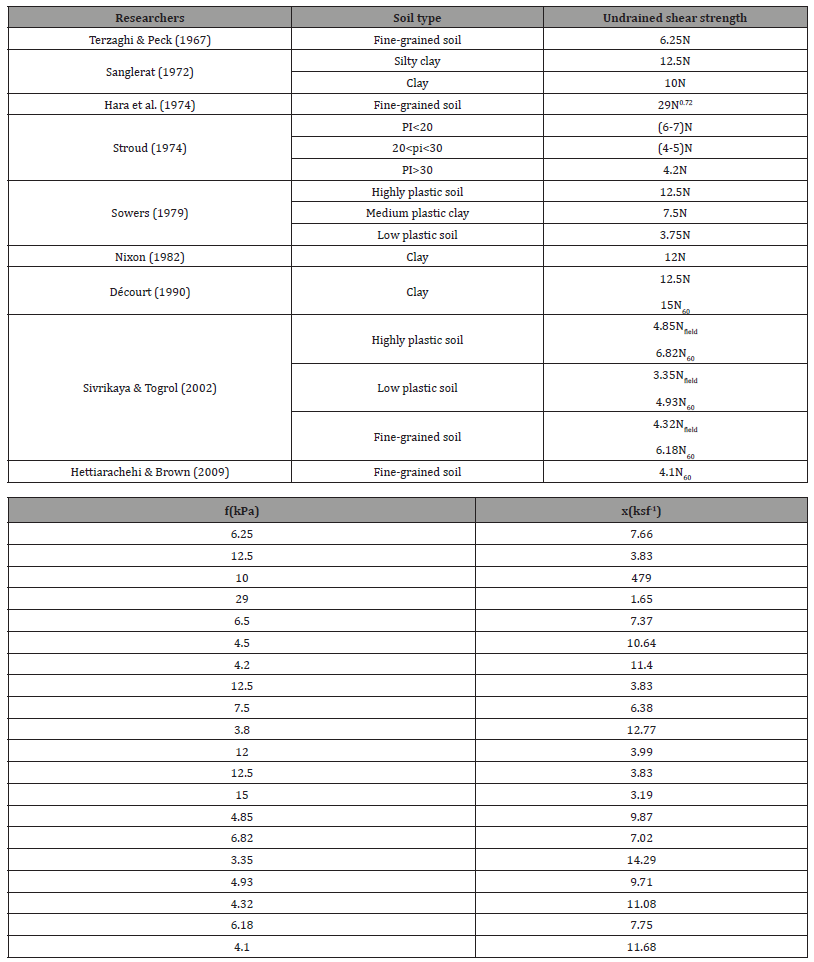
Singh, et al. [7] list relationships shown in Table 1 of Vs versus N60 for clay provided by various researchers. However, it is the intent here to use the relationship of undrained shear strength, Su, to Vs (Eq. 9b), to develop a geotechnically argued relationship.
Table 1:Correlation between undrained shear strength (Su) and SPT(N).
The unconfined compressive strength, qu (= 2 Su) of saturated clay in tons/ft2 (tsf), and therefore, Su in kips/ ft2 (ksf) is shown related to N60 in geotechnical literature as seen in Figure 9 from DM 7.1 [8]. Another version of this relationship with rotated axes is shown in Figure 10. The Terzaghi and Peck line in Figure 9 is generated from Table 2, taken from DM 7.1 [8].
Lines shown in Figure 9 can be represented by the relationship,

or its reciprocal

relative to Figure 10. The value x is the slope in Figure 9 while f (=1/x) is the slope in Figure 10.
What is interesting in comparing the Terzaghi-Peck Table 2 relations with the Terzaghi-Peck line in Figure 9, is that x is actually 8 for N60 values 8 and lower, and 7.5 for N60 values 15 and higher. Therefore, the Terzaghi-Peck line of Figure 9 is actually a broken line.
Another version of the Sowers lines of Figure 10, after McGregor & Duncan [8], is shown in Figure 11. The slope values of the two lines in Figure 10 and Figure 11 are the reciprocals of x, i.e. f; therefore, from the slope values of Figure 11 (0.15 and 0.075), x = 6.666 for the medium to high plasticity (or Sowers “medium plasticity”) and 13.333 for the low plasticity lines of Figure 9. Had Sowers’ high plasticity line of Figure 9 been shown in Figure 11, its slope in Figure 11 would be 0.25 or the slope x = 4 in Figure 9.
It is argued here that x is a function of Plasticity Index, x = f (PI), as indicated by Sowers lines of described “low, medium and high plasticity”. Sowers [9] reports ranges in PI values he attributes to his descriptive terms of nonplastic, slight (i.e. low), medium and high plasticity clays as given in Table 3.
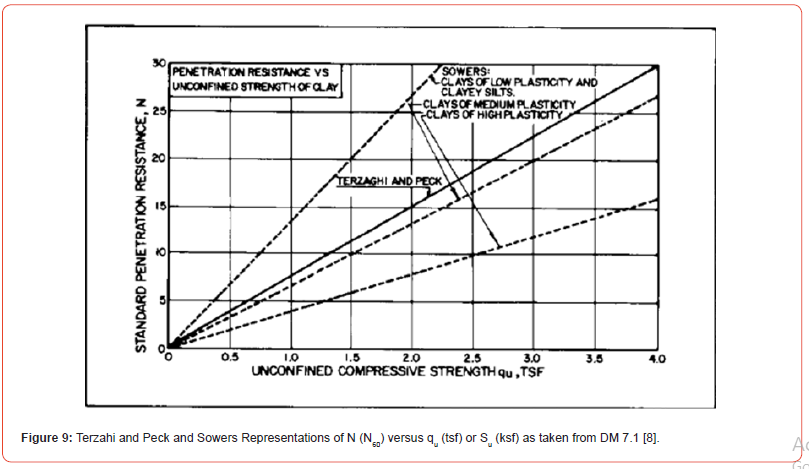
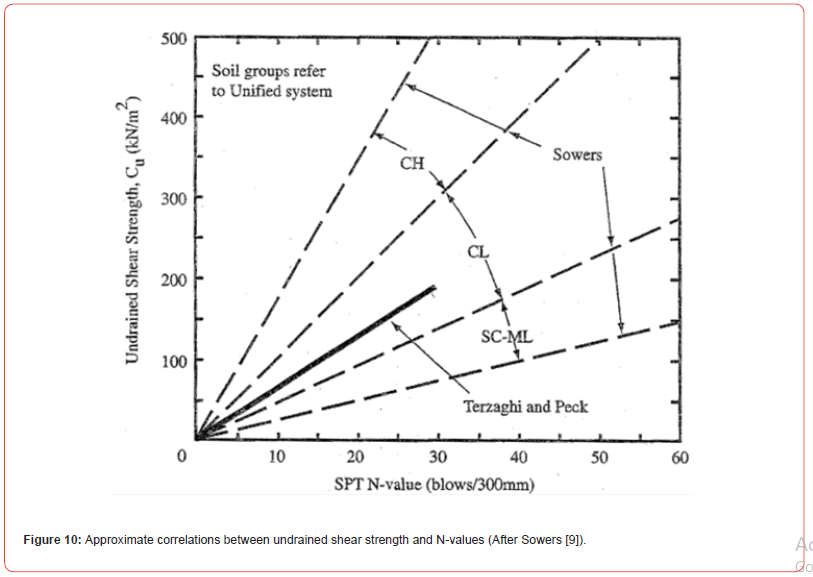
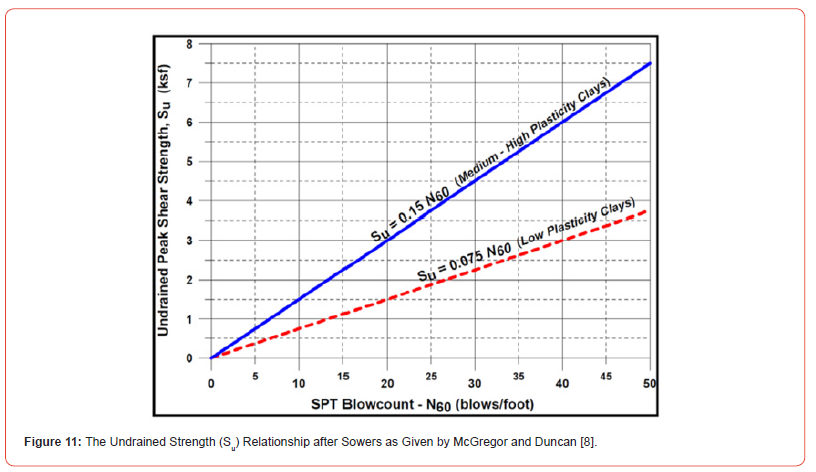
Table 2:Stiffness (Hardness) of (Cohesive) Fine Grained Soils from Standard Penetration Test (SPT) Blow Count N.
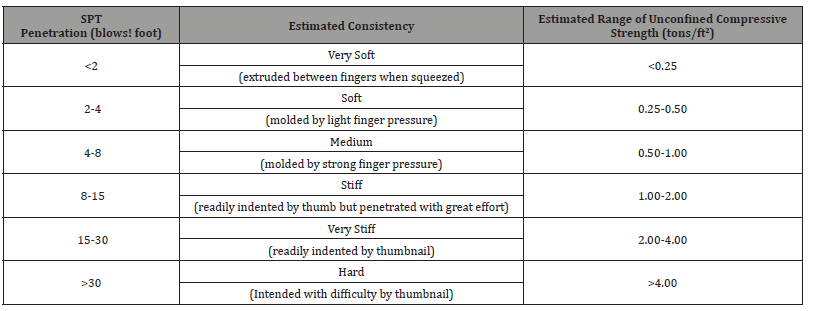
Table 3:Plasticity Table Taken from Sowers [9].

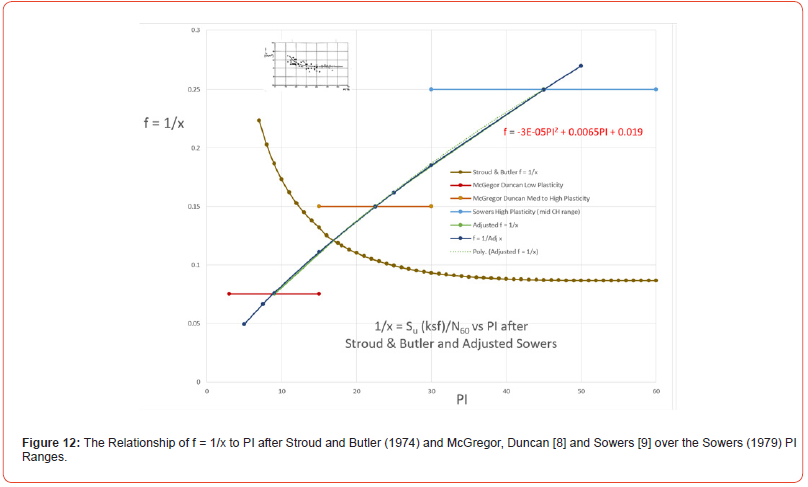
Figure 12, in the form of f = 1/x versus PI, shows a variation given by Stroud and Butler, 1974 (in the insert to Figure 12 in units of kPa converted to ksf) and the McGregor and Duncan values (f = 0.075 and 0.15) presented as straight lines over the Sowers PI ranges for low and medium plasticity, and the Sowers high plasticity value (f = 0.25) for a PI range from 30 to 60. An “Adjusted Sowers” curve drawn through the midpoint of each of the McGregor/Duncan and Sowers ranges yields the equation shown in Figure 13. A best fit equation to the reciprocal of this equation for f is
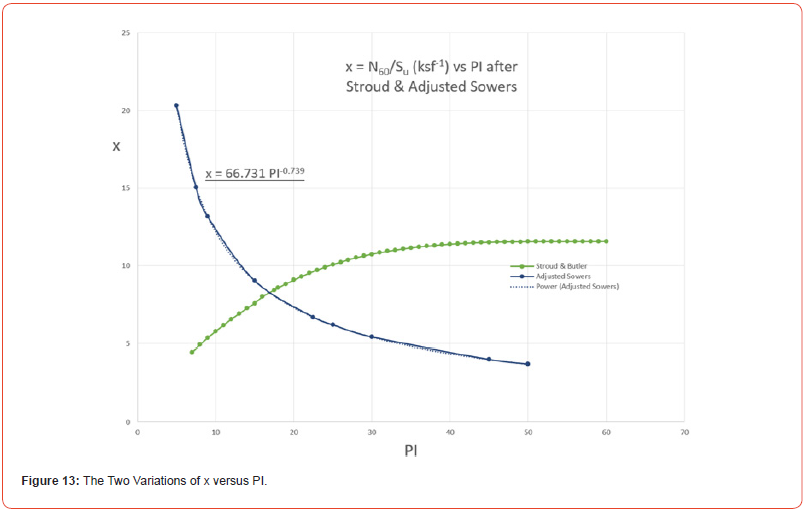

The range in f and x values might be compared with the fixed f and x values associated with the N versus Vs equations of researchers listed in Table 1. The x values of Table 1 in ksf-1 are shown to the side of the table opposite their f values in kPa.
Substituting for x (in ksf-1) from Eq. 11 and Su (in ksf) from Eq. 9b in Eq. 10a, N60 as a function of unit weight, γ (in pcf), PI and shear wave velocity, Vs (in fps), N60 becomes

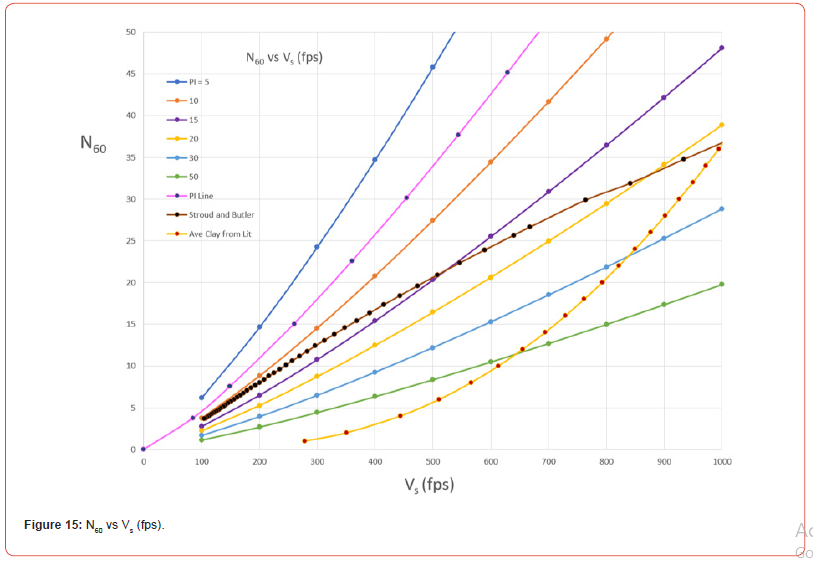
Evaluating Su (Eq. 9b) and N60 (Eq. 12) for a fixed value of γ versus a variation in Vs for different values of PI provides a plot such as shown in Figure 14. Beside the PI lines of 5, 10, 15, 20, 30, 50 and an x line set for PI = 7.5, the Stroud and Butler variation is shown for comparison. This figure can be compared directly with Figure 9 given that qu in tsf in Figure 9 is identically Su in ksf in Figure 14. Note the x values for the various PI lines will not change irrespective of the unit weight of γ employed.
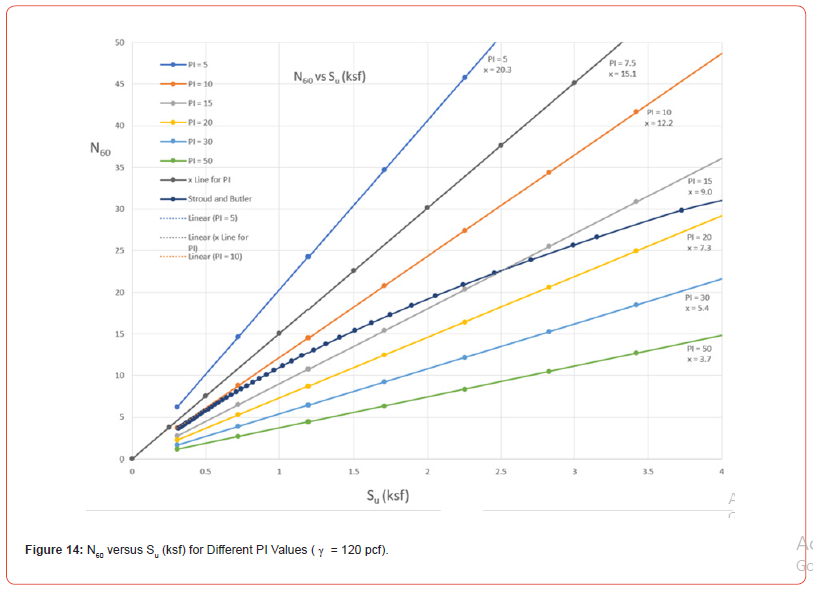
Figure 15 is a plot of the corresponding Su (ksf) vs Vs (fps) lines for the same set of PI’s and γ (120 pcf). Different from Figure 14, the lines are affected by a change in unit weight.
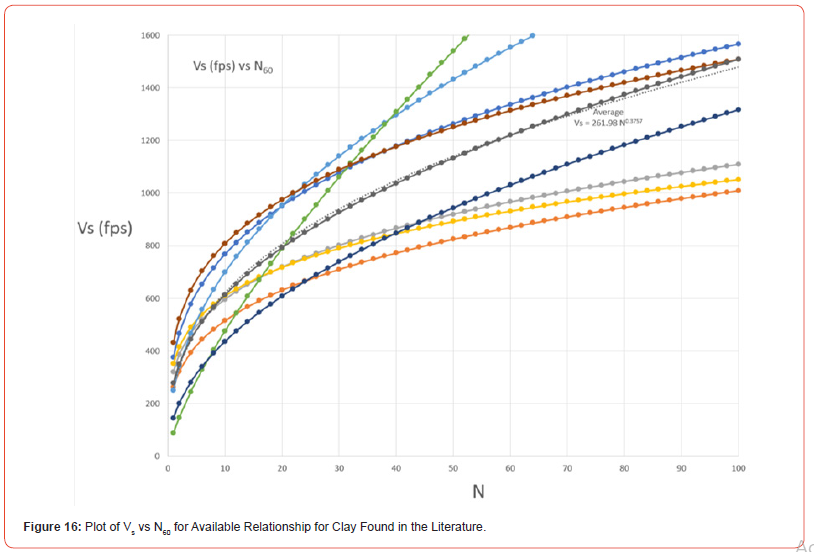
Superposed on the figure is the Stroud and Butler variation. In addition, a curve representing the average of “clay” curves from the literature (shown in Figure 16) is added. Note that the N value of these clay curves is assumed to be our N60. Furthermore, these clay curves do not distinguish PI or γ and may not be saturated and thus be a c-φ material.
Discussion/Conclusion
An expression has been offered relating the undrained strength (Su) of a saturated clay to the shear wave velocity (Vs) obtained in the exploratory assessment of a proposed site. Further, the means for assessing, on a preliminary basis, the load-settlement response of a footing to be placed at the site has been outlined. Such loadsettlement response is the immediate settlement behavior, to be followed by time dependent consolidation settlement. The corresponding bearing capacity and safety factor for the proposed load is the short-term value. Drained, long-term behavior would still need to be considered.
The relationship can also be used to assess the corresponding N60 value of the material if a Plasticity Index is assumed. A Soil Conservation Service (USDA NRCS) report for the area can be accessed to obtain soil data to a depth of 5 ft, including the soil classification, grain size data and PI. While not specifically needed for the aforementioned analysis, its determination will allow comparison with values obtained if the project proceeds to SPT testing and sampling that then yield blow counts, grain size distribution, Atterberg limits (LL, PI) and soil classification.
It is noted that the proposed method employing shear wave velocity (Vs) relates to the saturated Su strength (Eq. 9b) of a fine grain soil. The bearing capacity and settlement assessed reflect the short-term, end of construction condition [Again, long term consolidation settlement and drained bearing capacity (if significant unloading, i.e. excavation, at the site is anticipated) need to be considered.]
The published relationships from the literature for determining undrained strength, Su, and N60 values from shear wave velocity of clay do not necessarily reflect the saturated condition considered here. If one of the relationships is used to assess Su for instance, carried back through the analysis, it will not yield a Vs value that agrees with the one used. If the reader suspects the soil is not saturated and, therefore, a c-φ strength soil, the authors have provided a separate analysis procedure [10] for its preliminary assessment of load-settlement behavior based on the shear wave velocity.
Lastly, an attempt to establish the relationship between N60 and Su and N60 and Vs has been made, one that involves a dependence upon the PI and saturated unit weight of the clay [11-15].
Acknowledgement
None.
Conflicts of Interest
No conflict of interest.
References
- Ashour M, Norris G (1999) Liquefaction and Undrained Response Evaluation from Drained Formulation. Journal of Geotechnical and Geoenvironmental Engineering, ASCE 125(8): 649-658.
- Schmertmann J Hartman, J, Brown P (1978) Improved Strain Influence Factor Diagrams. Journal of Geotechnical Engineering, ASCE 104: 1131-1135.
- Elfass S, Norris G, Vimalaraj P (2007) A Simple Bearing Capacity Equation. GeoDenver 2007, ASCE, New Peaks in Geotechnics. In: Advances in Shallow Foundations, GSP 171: 1-10.
- Nimeri M, Elfass S, Norris G (2017) Load–settlement Response of Shallow Foundations Resting on Granular Soil. Innovative Infrastructure Solutions, 2(33).
- Norris G, Elfass S, Vimalaraj P, Lofty A (2011) A Simple Method for Assessing Load Vs. Settlement of a Shallow Foundation up to Bearing Capacity Failure. 1st Congress on Transportation Infrastructure 1st CITRANS, Costa Rica.
- McGregor JA, Duncan JM (1998) Performance and Use of the Standard Penetration Test in Geotechnical Engineering Practice. Virginia Polytechnic Institute and State University.
- Singh N (2017) Applicability of Standard Penetration Tests to Estimate Undrained Shear Strength of Soils of Imphal. International Journal of Engineering Technology Science and Research, IJETSR 4(3): 250-255.
- (1986) Naval Facilities Engineering Command. Soil Mechanics, Design Manual 7.01.
- Sowers G (1979) Introductory Soil Mechanics and Foundations Fourth Edition. Macmillan, New York.
- Norris G, Elfass S, Yang H (2022) Shallow Foundation Load-Settlement Behavior Assessed from Surface Geophysical Data. Proceedings of the 71st HGS, Asheville N.C.
- Bellana N, Scott J Brandenberg, Thomas Shantz (2010) Shear Wave Velocity as Function of SPT Penetration Resistance and Vertical Effective Stress at California Bridge Sites. M.S. Thesis, Soil Dynamics and Earthquake Engineering 30(10): 1026-1035.
- Evans Jr L, Duncan G (1982) Simplified Analysis of Laterally Loaded Piles. Report Number USB/GT/82-04, University of California, Berkeley.
- Farrokhzad T, Choobbasti A (2016) Empirical Correlations of Shear Wave Velocity and Standard Penetration Resistance Based on Soil Type in Baboil City. Indian Journal of Geo Marine Sciences 45(11): 1556-1577.
- Peck R, Hanson W, Thornburn T (1974) Foundation Engineering. 2nd Edition John Wiley & Sons, New York.
- Teng W (1962) Foundation Design, Prentice-Hall, Englewood Cliffs, New Jersey.
-
Gary Norris*, Horng-Jyh and Sherif Elfass. Load-Settlement Behavior of a Shallow Foundation in Saturated Clay Assessed from Geophysical Shear Wave Velocity. Glob J Eng Sci. 11(3): 2024. GJES.MS.ID.000763
-
Wave velocity, Standard penetration test, Strain triangle, Initial shear, Safety factor
-

This work is licensed under a Creative Commons Attribution-NonCommercial 4.0 International License.


