 Research Article
Integrating Safety, Land Use, and Socioeconomic Factors for Prioritizing Non-Motorized Infrastructure Gaps
Md Rezwan Hossain MS1, Hatem Abou-Senna PhD., P.E2, Essam Radwan PhD., P.E, F. ASCE3, Ayman Mohamed PhD., P.E., PTOE4 and Amr Oloufa PhD., P.E4*
1Ph.D. Candidate, Department of Civil, Environmental and Construction Engineering, University of Central Florida, Orlando, FL. 32816-2450 USA
2Associate Professor, Department of Civil, Environmental and Construction Engineering, University of Central Florida, Orlando, FL. 32816-2450 USA
3Emeritus Professor, Department of Civil, Environmental and Construction Engineering, University of Central Florida, Orlando, FL. 32816-2450 USA
4Senior Transportation Engineer / Adjunct Professor, Florida Department of Transportation - District 5 Deland, FL. 32720 USA
Amr Oloufa, PhD., P.E, Professor, Department of Civil, Environmental and Construction Engineering, University of Central Florida, Orlando, FL. 32816-2450 USA.
Received Date:May 22, 2025; Published Date:June 02, 2025
Abstract
Florida’s pedestrian sidewalks and bicycle lanes suffer from significant discontinuity, raising concerns among Florida Department of Transportation (FDOT) planners and engineers about pedestrian and bicycle safety. Building on previous research that established a correlation between sidewalk absence and increased pedestrian crashes, this paper presents a novel Sidewalk/Bike-Lane Gaps Safety Prioritization Tool (SBLPT) to systematically address these infrastructure gaps. The prioritization methodology employs multi-criterion ordinal ranking across five key modules: roadway and traffic data, socioeconomic factors, land use patterns, transit accessibility, and crash statistics. These parameters are weighted and aggregated into a single Roadway Pedestrian Safety Indicator (RPSI), allowing segments to be categorized into five priority levels. The SBLPT integrates pedestrian activity variables and proximity to generators using land use, income, and auto ownership data to provide a comprehensive assessment. Additionally, the tool generates intuitive sidewalk/bike-lane gap maps viewable in Google Earth®, enabling transportation planners to efficiently identify and address the most critical safety concerns in Florida’s pedestrian and bicycle infrastructure network.
Keywords:Pedestrian safety; Bicycle infrastructure; Gap analysis; Safety prioritization; GIS mapping; Transportation planning; Multi-criterion analysis; Sidewalk continuity; Active transportation; Vulnerable road users
Introduction
The prioritization of pedestrian and bicycle safety has become increasingly significant for governmental agencies in strategic infrastructure planning. Despite the shift toward people centric mobility approaches, standardized methodologies for measuring pedestrian incidents against statewide averages remain underdeveloped. The Florida Department of Transportation (FDOT) has established vehicular crash rate metrics based on the hypothesis that geometric design and traffic characteristics influence vehicular incident patterns. Consequently, further research is necessary to develop analogous crash rates for pedestrians, which would enable the identification of locations with above-average pedestrian incident frequencies within specific regions. Addressing pedestrian-vehicle conflicts is particularly crucial in Florida, which, according to the “Dangerous by Design” report, contains the four most hazardous pedestrian locations nationwide.
Pedestrian fatalities in the United States demonstrated a declining trend from 4,795 in 2006 to 4,109 in 2009. However, this positive trajectory subsequently reversed, with fatalities increasing to 4,302 in 2010, 4,457 in 2011, and 4,743 in 2012 [1]. National Highway Traffic Safety Administration data consistently ranks Florida among the states with the highest pedestrian crash, injury, and fatality rates [2]. Ernst et al. (2011) further identified four Florida metropolitan areas—Orlando-Kissimmee, Tampa-St. Petersburg- Clearwater, Jacksonville, and Miami-Fort Lauderdale-Pompano Beach—as the most dangerous for pedestrians nationwide, underscoring the particular urgency of pedestrian safety initiatives in Florida [3].
The discontinuity of pedestrian sidewalks and bicycle lanes throughout Florida has raised significant concerns among Florida Department of Transportation (FDOT) planners and engineers regarding potential disruptions to user flow and associated safety hazards. Prior to implementing prioritization programs for addressing these infrastructure gaps, a methodical analysis of the correlation between safety outcomes and sidewalk/bicycle-lane discontinuities is warranted. This paper presents the comprehensive data collection methodology and subsequent analysis employed to prioritize sidewalk and bicycle lane gaps within FDOT District 5. The research team integrated diverse Geographic Information Systems (GIS) datasets related to sidewalk/bicycle lane discontinuities with safety data provided by District 5. While the primary methodological focus centers on pedestrian sidewalk infrastructure and associated safety assessment tools, identical analytical approaches were applied to evaluate bicycle lane gaps.
Literature Review
There have been numerous studies that were devoted to investigate and evaluate pedestrian and bicyclist safety at the national level as well as Statewide and local levels. Several studies also attempted to identify significant factors related to pedestrian and bicycle accidents and developed a prioritization approach.
A statewide and national review to identify the current programs, procedures and best practices for addressing the prioritization of pedestrian and bicycle-lane gaps was conducted. The City of Portland was the first to develop the Pedestrian Potential Index (PPI) and the Pedestrian Deficiency Index (PDI) [4]. PPI included designation of urban activity centers, pedestrian activity variables and proximity to pedestrian generators, while PDI included several factors, such as sidewalk presence, street connectivity and traffic characteristics. ArcMap was used to combine PPI and PDI data to score pedestrian projects and rank their prioritization. Moudon, et al. (2002) also applied this method to prioritize pedestrian investments in suburban areas in the Seattle metropolitan area [5].
In 2004, New Jersey’ Department of Transportation (NJDOT) developed a master plan to address the prioritization of promising locations for pedestrian and bicycle investment [6].
They combined the suitability and demand for bicycle and pedestrian to identify priorities.
For identification of priority bicycle corridors, bicycle suitability and compatibility index analysis and bicycle demand models were used to determine level of priority. Bicycle compatibility index is calculated by lane widths, traffic volumes, speeds and other factors at a roadway link level in a GIS format. Bicycle demand model, which was developed by Alta Consulting [7], was used to estimate the total daily bicycle trip demand by census tract. For identification of pedestrian priorities, it also consisted of two parts: pedestrian barrier analysis, and pedestrian demand. Pedestrian barrier analysis was based on estimating pedestrian behavior, estimating gaps in traffic and estimating barrier severity. Pedestrian demand model used the pedestrian compatibility index (PCI), which is a further development of the pedestrian potential index (PPI) model. PPI model was developed by NJTPA [8] and it combined population and employment data. However, PCI used population and employment data and added a refined measure of transit accessibility. So the PCI could identify multimodal mobility and accessibility needs and evaluate transportation strategies [9].
Multicriteria ordinal ranking has been applied to evaluate alternatives in many research [10, 11]. Similarly, there were also few studies which focused on prioritizing pedestrian and bicycle investment [12, 13, 14].
Victoria Transport Policy Institute applied the weighted rank-order method to prioritize bicycle and pedestrian projects. A framework to select and prioritize bicycle and pedestrian safety projects for funding and implementation was developed by Victoria Transport Policy Institute [15]. The framework was divided into two parts; one was to identify hazardous locations, evaluate countermeasures and incorporate the appropriate countermeasures at the City/Country level, and the other to prioritize for funding and implementation at the State level.
There were four factors to consider when prioritizing improvements, including level of demand, degree of barrier, potential benefits, and cost and ease of improvement. Each factor can be assigned from zero (worst) to five (best), which can be completed by a small group of technical experts, a technical/public committee, or through a public survey. Then all the scores are multiplied by the criteria weights and aggregated for each project and rankings.
Another study also used the rank-order to prioritize the pedestrian implementation plan and budget proposal [13]. However, Shankar, et al. (2008) chose 15 variables to prioritize the project process, which reflected traffic safety, economy, feasibility of implementation, and support from the local community.
The literature showed several prioritization methods for addressing pedestrian and sidewalk investment projects which in cluded a lot of factors, especially geometric roadway characteristics that affect pedestrian safety. Among these factors was the presence of a sidewalk or bike lane. This paper develops a safety prioritization tool that would assist governmental agencies in the prioritization of sidewalk gaps and/or bicycle-lane gaps based on a balanced approach between safety needs, operational constraints, and fiscal assessment.
Statewide Pedestrian and Bicycle Crashes
A preliminary analysis of statewide pedestrian and bicycle crashes was conducted utilizing the Signal 4 Analytics database for the most recent 5-year period (May 2009- May 2014) [16]. The data showed a total of 61,545 pedestrian and bicycle related crashes. An average of approximately 12,300 crashes per year was observed. Further analysis for crashes per district was also conducted and separating pedestrian crashes from Bicycle crashes as shown in Table 1. As can be concluded from Table 1, District 4 has the highest number of total crashes (21%) followed by District 5 (18.4%), then Districts 7 (17.8%) and 6 (15.9%).
Table 1:Number of Pedestrian & Bicycle Related Crashes per District.

Pedestrian Safety Prioritization Tool (PSPT)
The pedestrian safety prioritization tool (PSPT) was developed primarily to prioritize the sidewalk gap locations within FDOT District Five which directly affects the safety of pedestrians along roadways. Prioritization means identifying the potential projects and ranking them most to least desirable so that the agency can develop an implementation plan and budget proposal according to the right order. Based on the analysis conducted earlier in this project, absence of sidewalks along roadways was one of the main factors that have significant impact on the expected number of pedestrian crashes at a specific location [17]. Other factors included daily traffic volumes (AADT), roadway category (ROADCAT), specifically along urban two-way divided arterials with 4-6 lanes as well as the average population within half mile radius surrounding the crash location. The developed tool takes into account the above mentioned parameters as well as other pedestrian-related activity variables and proximity to generators using land use, income and auto ownership data. The prioritization method is based on a multi-criteria ordinal ranking of the parameters of five main modules using a scoring system that combines all criteria weights then aggregates it into a single indicator. The five main modules comprise roadway and traffic data, socioeconomic data, land use data, transit and crash data. The following sections explain in greater detail the input data sources and preparation as well as a hands-on procedure.
Data Collection and Preparation
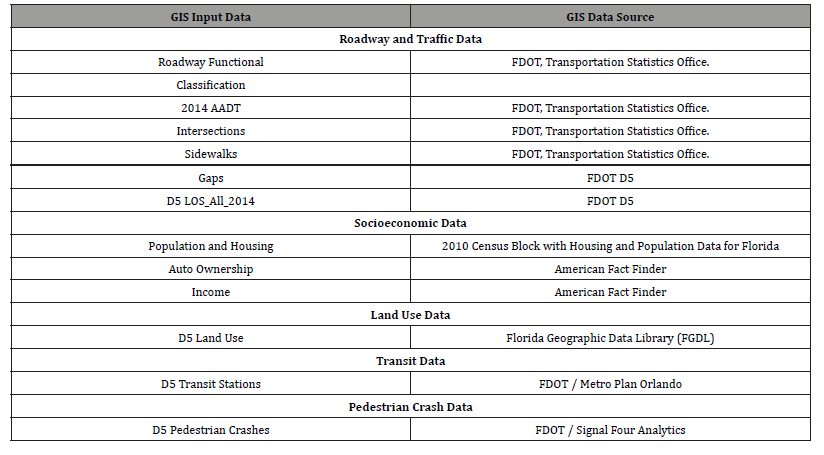
The data required for the Sidewalk Gaps Pedestrian Safety Prioritization Tool (PSPT) utilizes several statewide shape files of Geographic Information Systems (GIS) layers including roadway characteristics data, land use data, socioeconomic data, transit and safety data that were obtained from various sources. Table 2 presents the list of input layers and their sources.
Table 2:Input Layers and Data Sources.
Input Data Preparation Process
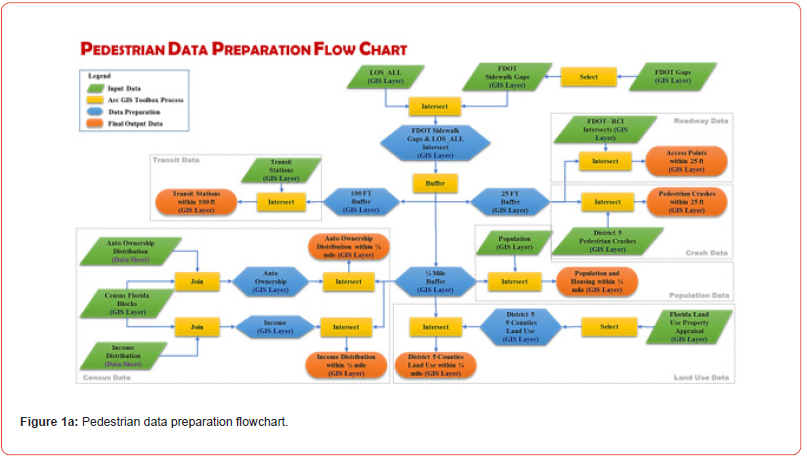
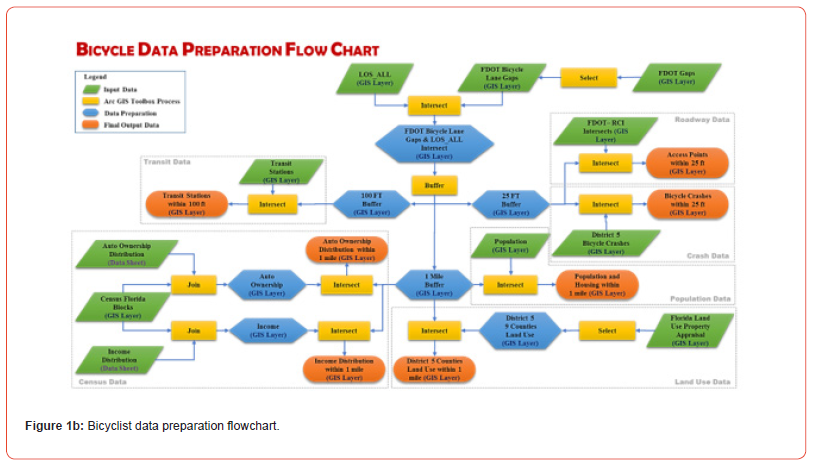
The original GIS data requires special preparation in order to be used as inputs for the 3 Sidewalk Gaps Pedestrian Safety Prioritization Tool. Several ArcMap GIS toolbox 4 processes were utilized to manipulate the original data format to extract data associated 5 with FDOT D5 roadway network and pedestrian criteria. Figures 1a and 1b illustrate the 6 overall pedestrian and bicyclist data preparation flow charts, respectively. This chart 7 demonstrates the original GIS layer data file (shown in green color), the GIS process that 8 was applied such as intersect, join, select, and/or buffer (shown in yellow color) and the 9 output layer that was used as input data for the prioritization tool (shown in Orange color). 10 The blue color represents an intermediate output layer. The dashed grey boundaries 11 represent the data input module. The following sections explain in greater detail the steps 12 needed to manipulate the original data to specific format to be used as inputs to the 13 Sidewalk Gaps Pedestrian Safety Prioritization Tool.
Input Data Coding and Modules
The Sidewalk Gaps Pedestrian Safety Prioritization Tool was coded using Visual Basic for Application (VBA) and utilizes Microsoft Excel® as the working environment. Microsoft Excel® is a package included in Microsoft Office® developed by Microsoft Corporation. The Sidewalk Gaps Pedestrian Safety Prioritization Tool was coded in module basis by separating the graphical user interface (GUI) modules and subroutines from the specific data processing and calculations. This helps in debugging, maintaining and expanding the features of the tool.
As mentioned earlier, the prioritization method is based on five main modules of input data which included roadway and traffic data, socioeconomic data, land use data, transit and crash data. Each of the output shape files generated from the data preparation process described above includes detailed information in database format “.dbf” associated with each module of the input data. The Sidewalk Gaps Pedestrian Safety Prioritization Tool connects to each of the individual database files to allocate specific data and calculates total scores for each module then aggregates it into a single indicator to rank their prioritization. The following sections describe the different parameters and variables in each module and the corresponding scoring system.
Roadway and Traffic Data Module
Roadway and traffic module included the following data:
• Sidewalk Gaps: This layer is the base layer for all five modules.
It includes all listed sidewalk gaps located in D5 roadway
network. The developed tool associates all parameters of the five
modules with each of the listed sidewalk gaps. Sidewalk gaps data
includes County, Roadway Section number, sidewalk gap beginning
and ending mile posts, State Road name, priority, gap type, Roadway
ID, traffic count station number, and beginning and ending mile
posts for the LOS roadway segment. This data is obtained from the
intersection layer between the sidewalk gaps layer and the 2014
LOS_All layer.
• Functional Class: Roadway functional classification associated
with each sidewalk gap is obtained from the functional classification
RCI GIS database file downloaded in Step 5.
• AADT: Average Annual Daily Traffic (AADT) for each traffic
count station associated with each sidewalk gap is obtained
from the Average Annual Daily Traffic RCI GIS database file
downloaded in Step 5.
• 1-Way or 2-Way: This data describes the roadway traffic directions
at the sidewalk gap if one-way or two-way direction.
This data is obtained from the 2014 FDOT D5 LOS_ALL database
file.
• Divided: This data describes if the roadway is divided or undivided
at the sidewalk gap. The letter “Y” indicates it is divided
roadway and the Letter “N” indicates it is undivided. This data is
obtained from the 2014 FDOT D5 LOS_ALL database file.
• No. of Through Lanes: This data lists the number of through
lanes at each of the sidewalk gaps. This data is also obtained
from the 2014 FDOT D5 LOS_ALL database file.
• Posted Speed: This data lists the posted speed at the each of
the sidewalk gaps. This data is obtained from the 2014 FDOT
D5 LOS_ALL database file.
• Left-Turn Bays and Right-Turn Bays: This data includes the
existence of left turn or right turn bays along the roadway at the
sidewalk gaps. The Letter “Y” indicates there 2 are turn bays,
the letter “N” indicates there are no turn bays. This data is obtained
from 3 the 2014 FDOT D5 LOS_ALL database file.
• No of Access Points: This data includes number of roadway
access points at the 5 sidewalk gap locations. This data is obtained
from the output layer identifying access 6 points within
25 feet from each of the sidewalk gaps developed in Step 4.
• Left and Right Sidewalks Percentages: This data represents
the percentage of sidewalk 8 coverage within the sidewalk gap
area. This percentage is calculated for each sidewalk 9 gap by
dividing the length of existing sidewalks by the length of the
sidewalk gap 10 length. The length of the sidewalk is obtained
from the Sidewalk Width & Separation 11 RCI GIS database file
downloaded in Step 5.
Socioeconomic Data Module
Socioeconomic module includes the following data:
• Area Type: This data represents the area type around each
individual sidewalk gap. The letter “U” indicates urban area,
letter “R” indicates rural area, letter “T” indicates transitioning
area from rural to urban, and letters “RD” indicates a rural area
under 18 development. The area type data is obtained from the
2014 FDOT D5 LOS_ALL 19 database file.
• Population: Population data shows the 2010 populations
within a quarter mile from 21 the sidewalk gap. The population
data identifies the estimated population and housing 22 within
a quarter-mile developed in step 7.
• Housing: Similar to population data, housing data shows
number of housing in 2010 24 within a quarter mile from the
sidewalk gap. The housing data also identifies the 25 estimated
population and housing within a quarter a mile developed in
step 7.
• Low Income Percentage: The low income percentage represents
the percentage of 27 households with yearly income
less than $40,000 within a quarter mile of the sidewalk 28 gap
location. This data is calculated from the database file that includes
income 29 distribution within a quarter mile developed
in Step 8.
• Medium Income Percentage: The medium income percentage
represents the 31 percentage of households with yearly
income ranging from $40,000 to $75,000 within 32 a quarter
mile of the sidewalk gap location. This data is calculated from
the database 33 file that includes income distribution within a
quarter mile developed in Step 8.
• High Income percentage: The high income percentage represents
the percentage of 35 households with income more
than $75,000 within a quarter mile of the sidewalk gap 36 location.
This data is calculated from the database file that includes
income distribution 37 within a quarter mile developed in Step
8.
• No Vehicle Auto-Ownership Percentage: This data shows
the percentage of 39 households within a quarter mile of the
sidewalk gaps that have no vehicles. This data 40 is calculated
from the database file that includes auto-ownership distribution
within a 41 quarter mile generated in Step 8.
• One Vehicle Auto-Ownership Percentage: This data shows
the percentage of 43 households within a quarter mile of the
sidewalk gaps that have only one vehicle. This 44 data is calculated
from the database file that includes auto-ownership distribution
45 within a quarter mile generated in Step 8.
• Two Vehicles Auto-Ownership Percentage: This data shows
the percentage of households within a quarter mile of the sidewalk
gaps that have two vehicles. This data is calculated from
the database file that includes auto-ownership distribution
within a quarter mile generated in Step 8.
• Three Vehicles Auto-Ownership Percentage: This data
shows the percentage of households within a quarter mile of
the sidewalk gaps that have three vehicles. This data is calculated
from the database file that includes auto-ownership distribution
within a quarter mile generated in Step 8.
• Four+ Vehicles Auto-Ownership Percentage: This data
shows the percentage of households within a quarter mile of
the sidewalk gaps that have four or more vehicles. This data is
calculated from the database file that includes auto-ownership
distribution within a quarter mile generated in Step 8.
Land Use Data Module
Land used data includes the distribution of land uses within a quarter mile from the sidewalk gap location. This data is calculated for each individual sidewalk gap using the nine database files for each county within D5 that resulted from Step 10.
Transit Data Module
Number of transit stops within 100 feet at each individual sidewalk gap is calculated using the output database file for transit stations generated in Step 12.
Pedestrian Crash Data Module
Pedestrian crash module includes the following data:
• Pedestrian Crashes 5-year Total: Pedestrian crash data is
calculated at each sidewalk gap location using the output database
file that includes all recent 5-year pedestrian crashes between
June 2009 - June 2014 that were located within 25 feet
from each of the sidewalk gaps generated in Step 13.
• Pedestrian Crashes 5-year Fatalities: Similar to pedestrian
crash data, pedestrian fatalities data is calculated at each sidewalk
gap location using the resulted database file that includes
all recent 5-year pedestrian crashes between June 2009 - June
2014 that were located within 25 feet from each of the sidewalk
gaps generated in Step 13.
• Pedestrian Crashes 5-year Injuries: Similar to pedestrian
crash data and pedestrian fatalities data, pedestrian injuries
data is calculated at each sidewalk gap location using the resulted
database file that includes all recent 5-year pedestrian
crashes between June 2009 - June 2014 that were located within
25 feet from each of the sidewalk gaps generated in Step 13.
Exposure Weight Scores and Indicators
Roadway Indicator
The objective of this indicator is to provide a surrogate measure
for roadway and traffic characteristics along the roadway segment
that is expected to have impacts on pedestrian safety. This indicator
includes several correlation factors that represent the magnitude
of pedestrian activities within the corridor. Roadway indicator includes
the following parameters:
• Functional Classification
• Traffic Direction
• Median Type
• Number of Lanes
• Posted Speed
• RT Bay
• LT Bay
• Accessibility
• Traffic Direction
• Sidewalk %
• SW Gaps
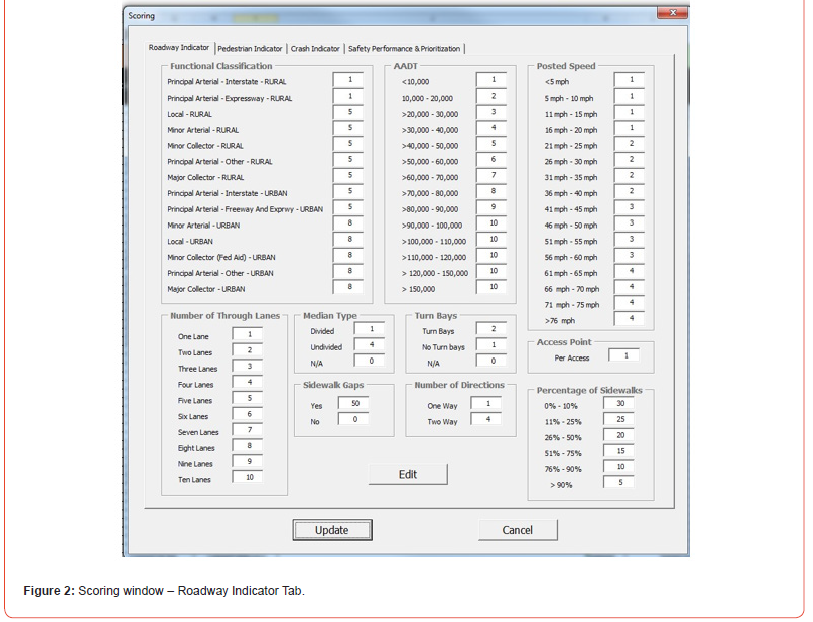
Weight score was assumed for each factor value with respect to the other values based on pedestrian safety concerns as shown on Figure 2.
Calculate Roadway Indicator:
The roadway and traffic characteristics exposure weight indicator is then calculated by adding all weight scores together resulting in a single value representing an indication of pedestrians at risk with different roadway and traffic characteristics.
Pedestrian Indicator
The objective of this indicator is to provide a surrogate measure
for pedestrian exposure along the roadway segments. This
indicator includes several correlation factors that represent the
magnitude of pedestrian activities within the corridor. For example,
pedestrian activities are significantly higher in urban areas
than rural areas. Higher population around roadway segments with
more residential housing will increase pedestrian activities. Pedestrian
activities are often concentrated in specific areas that are in
the vicinity of specific land uses that attract pedestrians (i.e., malls,
offices, restaurants, parks... etc.). Pedestrian indicator includes the
following parameters:
• Area Type
• Population
• Housing
• Land Use
• Income
• Auto-ownership
• Transit
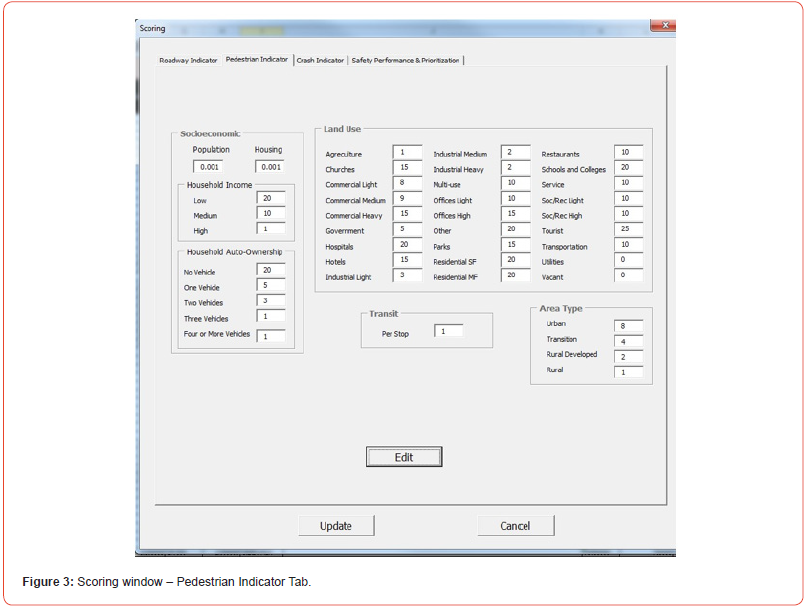
Population (1/4 mile buffer)
Population weight score = Population/1000
Number of Housing (1/4 mile buffer)
Housing weight score = Number of Houses/1000
Transit Activity
Transit activity weight score = Number of Transit Stops X 1
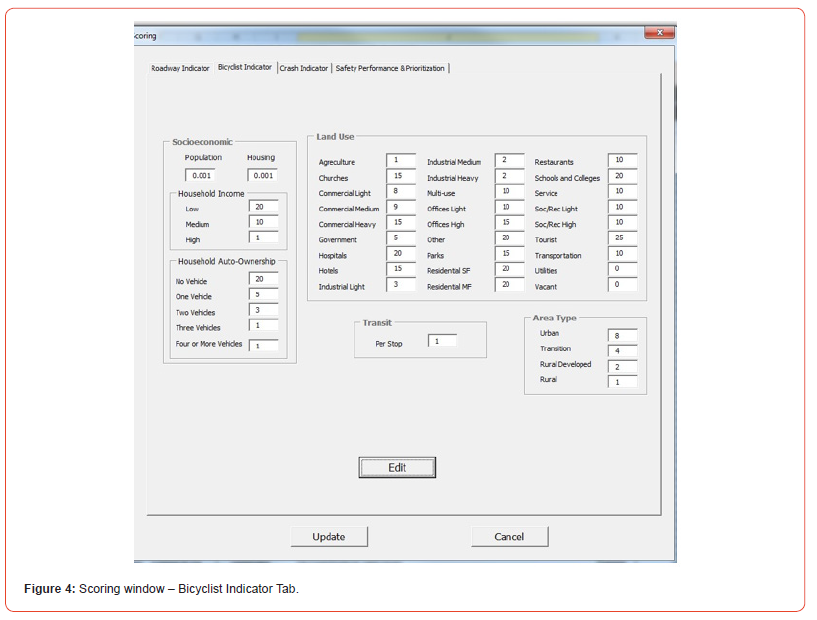
Figures 3 and 4 show the weights and scores for pedestrian and bicyclist indicator tabs in the tool.
Calculate Pedestrian Indicator:
The roadway pedestrian activity exposure weight indicator is then calculated by adding all weight scores together resulting in a single value representing an indication of activity at the roadway segment.
Safety Indicator
This indicator is the most important indicator for the pedestrian
safety improvement decision making process. It includes both
the crash frequency and severity. Safety indicator includes the following
parameters:
• Crash Frequency
• Crash Severity
Crash Frequency
Crash Frequency weight score = Number of crashes X 10
Crash Severity
Crash severity scores included No. of Fatalities X 50 and No of
Injuries X 15.
Calculate Safety Indicator:
The crash frequency and severity weight indicator is then calculated by adding crash frequency and severity weight scores together resulting in a single value representing an indication of pedestrian safety along the roadway segment.
Roadway Pedestrian Safety Indicator (RPSI)
Roadway Pedestrian Safety Indicator (RPSI) is based on the
three weight indicator groups which include roadway characteristics,
pedestrian activity, crash frequency and severity. The RPSI is
calculated for each roadway segment by assigning different weights
to each group of the three indicator groups based on its level of influence
on pedestrian safety as follows:
• Roadway and traffic characteristics exposure weight indicator
15% of RPSI
• Pedestrian activity exposure weight indicator 20% of RPSI
• Crash frequency and severity weight indicator 65% of RPSI
The following equation was used to calculate the Roadway Pedestrian
Safety Indicator (RPSI):
RPSI = Roadway Indicator x 15% + Pedestrian Indicator x
20% + Safety Indicator x 65% (1)
Prioritization Rank
The need for roadway segment safety improvement was ranked according to its RPSI threshold and categorized into five categories; urgent, high, medium, low and no safety concern as shown in Table 3. The need for urgent pedestrian safety improvements was assigned to segments that exceed RPSI threshold value of 100. Roadways that have RPSI value more than 75 but less than 100 can be categorized as highly hazardous roadways and will need early attention for pedestrian safety improvements. For those roadways that have RPSI values between 50 and 75, they are considered medium and might need the improvement in the near future. Roadways with RPSI between 25 and 50, they shall be monitored for future pedestrian safety improvements. Roadway segments with RPSI less than 25 have no safety concerns. Table 3 also shows the thresholds for the Roadway Bicycle Safety Index (RBSI).
Table 3:Prioritization Ranking Thresholds.

Data Mapping
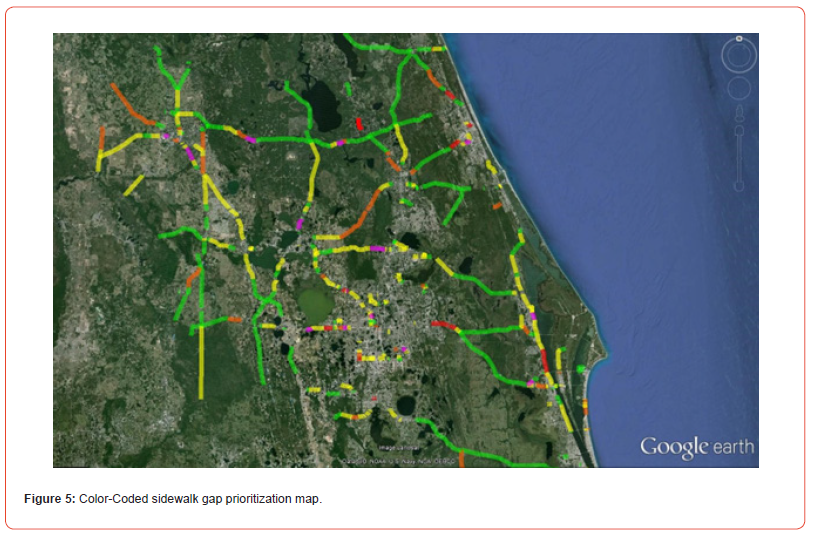
One of the useful features of the Sidewalk Gaps Pedestrian Safety Prioritization Tool is the capability to generate sidewalk gaps map that can be viewed in Google Earth ®. The generated map is color-coded based on the prioritization ranks where red, purple, orange, yellow, and green colors indicate urgent, high, medium, low, and no safety concerns priorities, respectively as shown in Figure 5.
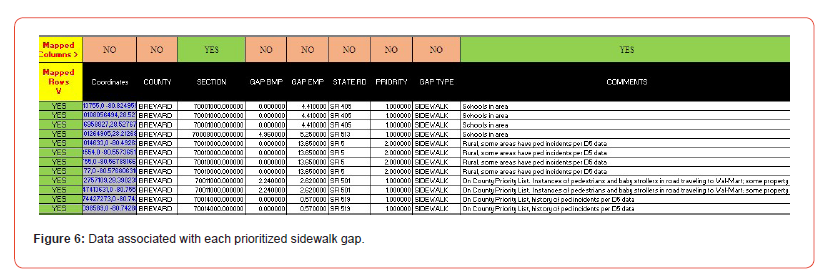
The tool reads the sidewalk gaps coordinates from the .kml file that was generated and then assign for each sidewalk gap in the “SW Gaps” worksheet its associated coordinates. Finally, the tool generates a kml file that can be saved and viewed as a layer in Google earth. The tool also has the capability of viewing specific data associated with each individual sidewalk as shown in Figure 6. The user can specify the data to be viewed by changing the column header from “YES” as to be viewed in the map to “NO” as to be hidden. Similarly, if the user needs to map only specific sidewalk gaps represented by a row in the “SW GAPS” worksheet; he/her can select “YES” in the first cell for mapping the sidewalk gap or “NO” 3 for not including the gap in the map.
Conclusion
This study established a significant statistical correlation between pedestrian crashes and sidewalk infrastructure gaps, confirming the central hypothesis of our research. This correlation provides critical empirical evidence that substantiates the importance of systematic sidewalk network analysis and remediation planning. The findings enabled the development of a comprehensive evaluation methodology for prioritizing infrastructure interventions where they are most urgently needed.
The pedestrian/bicyclist safety prioritization tool (SPT) represents a significant advancement in evidence-based transportation planning for Florida Department of Transportation (FDOT) District Five. By objectively ranking sidewalk and bicycle lane gaps according to multiple weighted criteria, the tool transforms complex multivariate data into actionable infrastructure priorities. The SPT integrates five critical data modules— roadway and traffic characteristics, socioeconomic indicators, land use patterns, transit accessibility, and crash history—into a unified evaluation framework that produces a composite prioritization score.
This integrated approach considers not only historical crash data but also contextual factors that influence pedestrian and cyclist exposure and vulnerability, including proximity to activity generators, household income distribution, and vehicle ownership patterns. The resulting prioritization system enables transportation planners and decision-makers to allocate limited resources efficiently, developing implementation strategies and budget proposals that maximize safety benefits.
The methodology developed through this research demonstrates that quantitative, multicriteria decision support tools can successfully bridge the gap between traffic safety analysis and infrastructure planning. By identifying specific roadway segments lacking pedestrian or cycling infrastructure and quantifying intervention priorities, the SPT provides a replicable, transparent, and objective framework for addressing critical safety deficiencies in the transportation network. These findings suggest that similar approaches could be beneficial for other transportation districts seeking to enhance pedestrian and cyclist safety through systematic infrastructure improvement programs.
Acknowledgement
The work reported in this paper is part of a research project under contract number BDK24TWO#977-07, which is sponsored by the Florida Department of Transportation (FDOT). The views expressed in this paper do not necessarily reflect those of the sponsors. The authors would like to thank FDOT for their support.
Conflicts of Interest
No Conflict of Interest..
References
- Williams A (2013) Pedestrian Traffic Fatalities by State.
- National Highway Safety Adminstration, N. H. T. S. (2011) Traffic Safety Facts 2011 data.
- Ernst M, Lang M, Davis S (2011) Dangerous by design: solving the epidemic of preventable pedestrian deaths.
- Schwartz W, Porter C, Paynem G, Suhrbier J, Moe P, et al. (1999) Guidebook on methods to estimate non-motorized travel: Supporting Documentation. FHWA-RD-98-166.
- Moudon A, Hess P, Matlick J, Pergakes N (2007) Pedestrian Location Identification Tools: Identifying Suburban Areas with Potentially High Demand for Pedestrian Travel. Transportation Research Record 1818, Ppaer Bo. 02-3748, pp. 94-101.
- Andrew R Swords, Lois M Goldman, William Feldman, Theodore F Ehrlich, William J Bird (2004) Analytical framework for prioritizing bicycle and pedestrian investments: New Jerseys Statewide Master Plan Update, Phase 2. Transportation Research Record, 1878: 27-35.
- Jones M, M Birk, P Miller, J Abrams (2000) Bicycle demand and benefit model documentation. Alta Transportation Consulting San Rafael Calif April.
- Matley TM, LM Goldman, BJ Fineman (2000) Pedestrian Travel Potential in Northern New Jersey: A Metropolitan Planning Organization’s Approach to Identifying Investment Priorities. In Transportation Research Record 1705, TRB, National Research Council, Washington, D.C, pp. 1-8.
- Fineman BJ, AJ DeJohn Jr, K e. Miller, IM Goldman (2003) Comprehensive Performance Evaluation of Mutiscale Transportation Strategies: Large Metropolitan Planning Organization Methodology. In Transporatation Research Record: Journal of the Transportation Research Board, No. 1858, TRB, National Research Council, Washington, D.C., 2003, pp. 124-132.
- Teng J, Tzeng G (1996) Fuzzy multicriteria ranking of urban transportation investment alternatives. Transportation Planning and Technology 20(1): 15-31.
- Cook W, Kress M (1994) A multiple-criteria composite index for quantitative and qualitative data. European Journal of Operational Research 78: 367-379.
- Litman T, Blair R, Demopoulos B, Eddy N, Fritzel A, et al. (2002) Pedestrian and Bicycle Planning: A Guide to Best Practices. Victoria Transport Policy Insitute, Victoria, B.C., Canada.
- Shankar N, Mochael JD, Kenneth EL (2008) Framework for Selection and Evaluation of Bicycle and Pedestrian Safety Projects in Virginia. FHWA/VTRC 08-R8 (Charlottesville, Virginia, January).
- Frackelton A (2013) Pedestrian transportation project prioritization incorporating app-collected sidewalk data (Master Thesis). Georgia Institute of Technology, Georgia, United States.
- Moudon A, Hess P, Matlick J, Pergakes N (2007) Pedestrian Location Identification Tools: Identifying Suburban Areas with Potentially High Demand for Pedestrian Travel. Transportation Research Record 1818, Paper No. 02-3748, pp. 94-101.
- Signal Four Analytics Website (2014)
- Abou-Senna H, Radwan E, Mohamed A (2016) Investigating the Correlation 6 between Sidewalk Gaps and Pedestrian Safety. 95th Transportation Research 7 Board, Washington D.C.
-
Md Rezwan Hossain MS, Hatem Abou-Senna PhD., P.E, Essam Radwan PhD., P.E, F. ASCE, Ayman Mohamed PhD., P.E., PTOE and Amr Oloufa PhD., P.E*. Integrating Safety, Land Use, and Socioeconomic Factors for Prioritizing Non-Motorized Infrastructure Gaps. Glob J Eng Sci. 12(1): 2025. GJES.MS.ID.000779.
-
Infrastructure gaps, Geographic information systems, Framework, Infrastructure planning, Traffic characteristics, Barrier analysis, Transportation strategies, Traffic safety, Operational constraints
-

This work is licensed under a Creative Commons Attribution-NonCommercial 4.0 International License.


