

 Mini Review
A Life Expectancy Evaluation Perspective: From Statistical Capacity and Governance to Public Health
Received Date:June 03, 2024; Published Date:June 05, 2024
Abstract
Strong statistical capacity facilitates better measurement, governance and timely decision by policy makers. This is crucial to countries where demographic, social, political, economic and public health related changes are evolving in parallel to ageing population. The correlations of healthy adjusted life expectancy with Statistical Performance Indicators and Worldwide Governance Indicators demonstrate the importance of big data insights towards a holistic integration of any strategies within a public health and social paradigm. From analysis on different income stratifications, researchers and policymakers should have multiple angles of detection and never overlook lower income clusters so that their sustainable developments, health systems and public health policy can be kept resilient to growing challenges.
Keywords:Ageing; Public Health; Health Systems; Health Policy; Life Expectancy; Measurements; LMICs
Introduction
There are many indices and indicators around the world aiming to improve development outcomes and track progress towards the Sustainable Development Goals from the United Nations. The collaboration and synergy to drive countries to build better statistical systems and data ecosystems is very important. This leads to adhering to the requirements of governments and citizens with the sense that better data can support better decisions. For this matter, the World Bank constructed the framework of Statistical Performance Indicators (SPI) and the formulation of SPI Index in order to define the statistical performance of economies by how well, how broadly, and how frequently national statistical systems collect, produce, and disseminate high-quality, timely and reliable data (SDG number 17.18 of United Nations) in a publicly accessible manner (Hang et al., 2023) [1].
On the other hand, stronger statistical capacity contributes to better governance and accountability, where citizens are better informed about government activities and can be more engaged in the monitoring process. As carefully explained by the World Bank, governance includes the process by which governments are selected, monitored and replaced, the capacity of the government to effectively formulate and implement sound policies, and the respect of citizens and the state for the institutions that govern economic and social interactions among them. For the sake of measuring the quality of public governance at the national level, the World Bank designed the framework of the Worldwide Governance Indicators (WGI) structured around six key governance dimensions: voice and account - ability, political stability and absence of violence, government effectiveness, regulatory quality, rule of law, and control of corruption. The WGI is an invaluable tool for policymakers, researchers, and practitioners interested in comparative governance and institutional analysis (Kaufmann & Kraay, 2023) [2].
A growing economy can invest more resources to strengthen its statistical capacity. This leads to better development outcomes. Conceptually explained by Dang et al. (2024) [3], this process is consistent with the economic theory of asymmetric information economics, whereby better information flows among different stakeholders in the economy (including firms, workers, investors, and traders) produce more economic benefits and enable the economy to operate more smoothly. Some researchers suggested that increased data transparency benefits GDP and economic growth (Arezki et al., 2020; Islam and Lederman, 2020) [4,5], external borrowing costs (Kubota & Zeufack, 2020) [6] together with a positive influence of more democracy (Janus, 2022) [7].
The above discussions on statistical capacity and governance mainly concentrated on the economic side. There was not much on how these may influence public health or well-being when these were mattering crucially in parallel to ageing population. Populations were progressively ageing over the last decade and rapid ageing for coming years is an unquestionable trend. According to United Nations statistics as in November 2022, the world’s population surpassed 8 billion people, having grown by 1 billion since 2010. Reaching this milestone raises important questions concerning the impact of human activities including those from social and cultural networks and community implementations arose from government policies. In 2021, 761 million people worldwide were aged 65 and older, which will rise to 1.6 billion by 2050. The number of people aged 80 years or older is growing even faster. It is essential to understand how statistical capacity and governance impact quality of life or life sustainability for humans while people are living longer (United Nations, 2023) [8].
Let us use healthy adjusted life expectancy (HALE) at age 60 from World Health Organization (WHO) (2020) [9] to model the behaviour of life sustainability. HALE is used instead of life expectancy because life expectancy does not mean healthy ageing. Life expectancy at an age only summarizes the overall mortality level or pattern of a population with the assumption that they are kept at the same health level onwards as at the measuring age. Healthy adjusted life expectancy (HALE) of World Health Organization (WHO) is a modified version of life expectancy after adjustment (often reduction) or in other words carrying the meaning of total burden in disability adjusted life years (DALY). HALE or DALY both consider disease burden in a population combining the estimates of the non-fatal burden in years lost due to disability (YLD) and the fatal burden in years of life lost (YLL). The use of HALE at age 60 aims to reflect the expectation of life from age 60 onwards (i.e. up to how many numbers of more years to live at age 60) with rolling health states or burden or mortality chance caused by health or non-health diseases, accidents, suicides or pathological disorders.
When we perform analysis on both SPI and HALE datasets between 2015 and 2019, we also consider different income level stratifications among countries across the world. Economies are divided among income groups according to 2022 gross national income (GNI) per capita sourced from World Bank (2022) [10] - low income, $1,135 or less; lower middle income, $1,136 to $4,465; upper middle income, $4,466 to $13,845; middle income, $1,136 to $13,845; and high income, $13,846 or more. Dollar units are in USD.
From the analysis on SPI and HALE, no matter for all countries across the world or their specific income groups of countries, we can statistically say countries with higher SPI Index have positive influence to help old adults to extend life expectancy. For different income level stratifications, their only difference is on the peak number of HALE that old adults can reach under the increasing SPI Index trend. Their Pearson Correlations range between .319 and .668 (p < .05 significance) and their influence size effect (η2 value of ANOVA test) range between .127 and .464 (p < .05 significance). Adhering to the fact at the beginning that statistical capacity can lead to improvement on governance for a country, let us perform analysis on both WGI and HALE datasets between 2000 and 2020. Again, we also consider different income level stratifications among countries across the world.
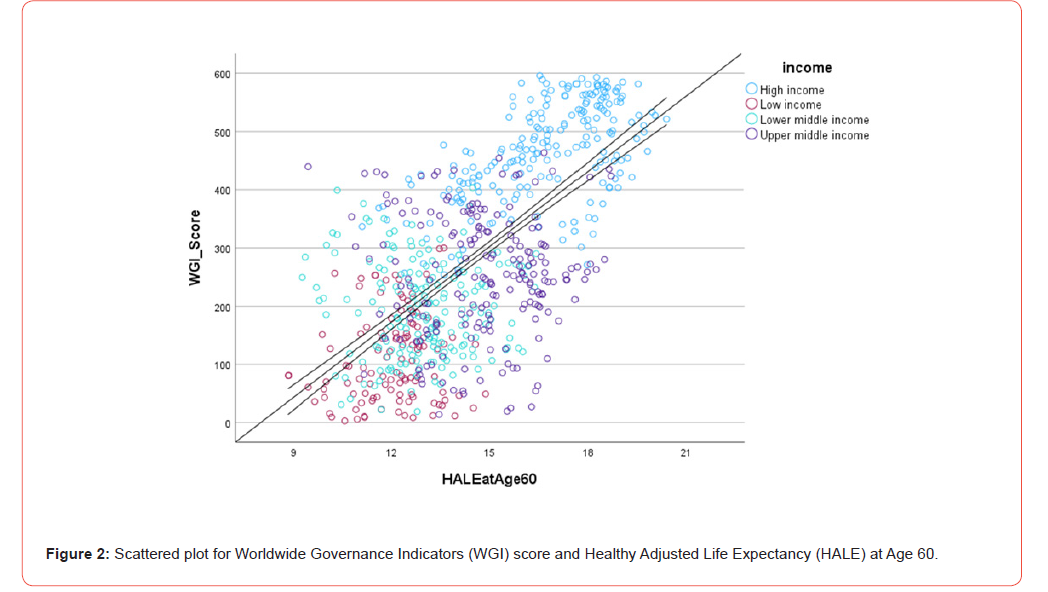
From this analysis on WGI score (that sums up all scores measured from the six documented key governance dimensions) and HALE, statistical significance is only observed for the groups of all countries, high income countries and low-income countries. With the timeframe of datasets covering the recent two decades, it remains reasonable to statistically say countries with higher WGI score can help old adults to extend life expectancy. For high income countries, the linkage between statistical capacity in national systems and institutional governance usually gets into the norm for consecutive number of years. For low-income countries, when the consideration of statistical capacity and appropriate governance strategies is put into force, the momentum of positive consequence towards wellbeing in their communities is directly much stronger. For middle income countries, such the momentum is existing, but it may be overwhelmed by some other stronger demographic or socioeconomic factors. In short, their Pearson Correlations range between .152 and .653 (p < .05 significance) and their influence size effect (η2 value of ANOVA test) range between .085 and .462 (p < .05 significance).
As we can summarize, the impacts of statistical capacity and governance towards public health and population ageing are always multi-disciplinary and intersective. This article here considers life expectancy is marked as a practical good start and there is plenty of room for further research. Research could focus on leveraging big data analytics on more relevant variables and machine learning techniques to help policymakers to improve decision-making processes and resource allocation and life sustainability forecasting. Also, data sets with continuous year series can strengthen data analysis to understand the trend of their moving severity. The help of big data insights can all the way shed light on a holistic integration of any strategies within a public health and social paradigm.
On the other hand, similar to this analysis on different income stratifications, researchers and policymakers should have multiple angles of detection and never overlook lower income clusters, where they are in your region or at your neighborhood, so that their sustainable developments, health systems and public health policy can be kept resilient to growing challenges from data availability and increase in governance on data or systems or processes in practice with the aim of removing current barriers and encouraging sustainability transitions (Figures 1,2).

Funding
The authors received no financial support for the work, authorship and publication of this article.
Acknowledgement
None.
Conflict of Interest
The authors declare that they have no known competing financial interests or personal relationships that could have appeared to influence the work reported in this paper.
References
- HH Dang, J Pullinger, U Serajuddin, B Stacy (2023) Statistical performance indicators and index - a new tool to measure country statistical capacity. Sci Data 10(1): 146.
- D Kaufmann, A Kraay (2023) Worldwide Governance Indicators, 2023 Update.
- HH Dang, J Pulinger, U Serajuddin, B Stacy (2024) Reviewing Assessment Tools for Measuring Country Statistical Capacity. IZA Discussion Paper No: 16745.
- Rabah Arezki, Daniel Lederman, Nelly El-Mallakh, Asif Mohammed Islam, Amani Abou Harb, et al. (2020) Where missing data hurts the most: Low growth, macroeconomic vulnerability, and labor market outcomes in Middle East and North Africa. World Bank Publications.
- AM Islam, D Lederman (2020) Data transparency and long-run growth. World Bank Policy Research Working Paper No: 9493.
- M Kubota, A Zeufack (2020) Assessing the returns on investment in data openness and transparency”. Policy Research Working Paper No: 9139.
- T Janus (2022) Democracy and statistical capacity. Applied Economics Letters 30(14): 1882-1886.
- United Nations (2023) UN News - UN report calls for re-thinking social protection as world ages.
- World Health Organization (WHO) (2020) The Global Health Observatory: Healthy life expectancy.
- World Bank (2022) The World by Income and Region.
-

This work is licensed under a Creative Commons Attribution-NonCommercial 4.0 International License.