 Research Article
Reducing Waiting Time in The General Pediatric Clinic at Al Wakra Hospital, Qatar
Ghadeer Mustafa1, Almunzer Zakaria2*, Muna Atrash2, Sara Kazkaz2, Ayman Tardi3, Ayman Ghanem3
1Pediatric Division, Hamad Medical Corporation, Doha, Qatar
2Quality and Patient Safety Department, Hamad Medical Corporation, Doha, Qatar
3Outpatient department, Hamad Medical Corporation, Doha, Qatar
Almunzer Zakaria, Quality and Patient Safety Department, Hamad Medical Corporation, Doha, Qatar
Received Date:October 25, 2021; Published Date:November 11, 2021
Abstract
Background: Waiting times for clinic appointments constitute a key indicator of an outpatient department performance for access to care
and patient satisfaction. This is particularly relevant for pediatric population. The Ministry of Public Health in Qatar set a waiting time of 28 days
for patients to get new appointment in General Outpatient Department (GOPD). The current average waiting time to get a new appointment in the
general pediatric clinic (GPC) at AWH is 57 days.
Aim: Decrease the average waiting time to get a new clinic appointment from 57 days to 28 days by the end of December 2018, and to meet the
national targets set by the Ministry of Public Health.
Methodology: This is a Quality Improvement (QI) project using the Model for Improvement (MFI). The MFI framework is designed to support
organizations answering fundamental questions before agreeing on drivers for change. The implementation of change was be facilitated by the Plan-
Do-Study-Act (PDSA) cycles methodology. The QI project team performed a root cause analysis using the Ishikawa diagram and identified the key
contributing factors to the long waiting times to get a new appointment. Twenty-seven PDSA cycle ramps were designed with support of predictive
tool to test innovative changes in current operational processes in an attempt to improve waiting time in the general pediatric clinic at Al Wakra
Hospital.
Results: The monthly average number of referrals for GPC increased by 200% between the pre and post implementation periods. The average
triage waiting time improved from 6 to 2.6 days in 2018 and the average become 1 day in 2019. Post-implementation the average waiting time for
patients to get new appointment improved from 57 days to 28 days in 2018 and the average waiting time improved to 16 days in 2019.
Conclusion: The quality improvement project for the AWH general pediatric clinic demonstrates significant improvement in waiting times for
new appointments, the recommendation for the hospital leadership would be to rollout the improvement methodology to other clinics that suffer
from similar challenges.
Introduction and Objectives
The Ambulatory Care section of a hospital is a component which directly affects a population’s access to care as well as the patient flow within a hospital. Indeed, the outpatient department is a complex system through which large volumes of patients of varying needs are treated each day [1]. Effective and efficient patient flow in an outpatient department is measured by “effective appointments systems that match demand with capacity so that resources are better utilized and patient waiting times are minimized” [1].
Robust scheduling mechanisms, for example, have proved to be critical in the reduction of patient waiting times, without the need for extra resources, and have enabled departments to meet waiting times targets [2]. Patient satisfaction is an important measure of quality of healthcare. A well-designed scheduling system should be designed to improve patient satisfaction through timelier access to care, and therefore optimal operational performance [3]. ‘No-show’ rates are another aspect of outpatient clinics that generates long waiting times while also wasting clinical and non-clinical resources for the outpatient department [4].
The General Pediatric Clinic (GPC) at AWH has seen an increase of 26% in referrals between 2016 and 2017 (1,542 in 2016 and 2,073 in 2017; AWH, 2016 and 2017 OPD yearly reports). This currently equates to around 150 to 200 referrals per month. The general pediatric outpatient department runs 10 clinics per week, offering 97 slots (36 of them for new appointments). Despite its capacity, increasing demand as well as operational inefficiencies means that average waiting times have increased from 37 days in 2016 to 66 days in 2017 for morning, afternoon, and evening clinics (AWH Pediatric Outpatient Department, 2017). These waiting times are well above the national target of 28 days set by the Ministry of Public Health of Qatar. It has been demonstrated that excessive ambulatory care waiting times delay patients’ treatment and could potentially lead to increased attendances to the Emergency Department, inpatient admissions and therefore poor patients’ satisfaction [5].
The average percentage of ‘Did Not Attend’ (DNA) for one year (September 2016 to September 2017) for GPC was 39% (AWH Pediatric Outpatient Department, 2017) which would suggest that the clinic’s resources were largely underutilized [6]. Percentage of ‘Walk-in’ were around 3 to 4% for 2017 (AWH Pediatric Outpatient Department, 2017). In addition to that, recent flow analysis revealed that the triage process takes more than 4 days to process referrals for new appointments (AWH Pediatric Outpatient Department, 2017).
The aim of this study is to decrease the average waiting time to get a new clinic appointment from 57 days to 28 days by the end of December 2018, and to meet the national targets set by the Ministry of Public Health.
Methods and Tools
The AWH outpatient pediatric team has commissioned a quality improvement (QI) project aiming to decrease the average waiting time to get an outpatient appointment, and to meet the national targets set by the Ministry of Public Health. QI is systematic, data-driven activities framework that is popular amongst healthcare organizations who wish to introduce change and foster improvement through the close monitoring of selected metrics. One of the major components of this framework is that it engages relevant subject matter experts from the field, therefore ensuring a multidisciplinary contribution in achieving significant performance improvements. QI can be described as an iterative or multi-stepped process by which process modifications are progressively introduced with anticipated improvement [7]..
The QI project is conducted in General Pediatric clinics in AWH which is a general hospital that has been designed, built, and staffed with the changing needs and expectations of the growing community in the country’s south area. AWH provides comprehensive healthcare to people of all ages.
Inclusion criteria
All new pediatric patients aged from birth to 14 years old with routine and urgent referrals attending the AWH general pediatric clinic. HMC Clinical Policy defines urgent referrals as referrals where appointment is required within 14 days, and routine referrals as referrals where the requirement is for the next available appointment (HMC Referral Process Policy, 2015).
The AWH pediatric team has established a collaborative team which has identified a number of key change ideas supported by specific process drivers that would potentially allow the department to reduce waiting times for new appointments. This study aims to present these change ideas and respective drivers and assess the success of their implementation.
Invalid patient waiting list has proved to complicate the task of the outpatient pediatric team in evaluating additional resources required to potentially reduce waiting times. An analysis revealed a high number of patients on the waiting list with no dates leading to incorrect waiting time computation. To address this issue and therefore get a more realistic picture of the waiting time for the department, these anomalies were excluded from the data set.
Exclusions Criteria
All new patients with routine or urgent referrals attending AWH pediatric sub-specialties clinics (e.g., Gastroenterology clinic, Pediatric Surgery clinic and Pulmonology clinic).
Supporting Data and Data Collection
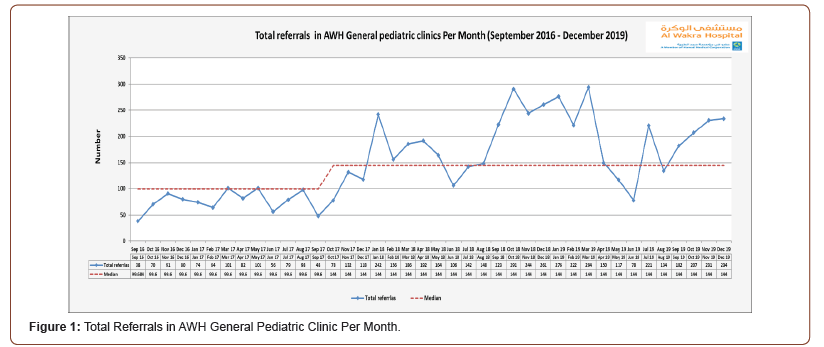
The AWH General Pediatric clinic has seen the number of new referrals double from an average of 83 for one year (November 2016 to November 2017), to an average of 190 new referrals from December 2017 to December 2018. This high demand originates from different catchment areas due to patient’s preferences to attend AWH general pediatric clinic (see Figure 1). AWH’s Patient and Visitor Service Centers (PVSC) office raised concerns about the findings of the patient’s comments from monthly PVSC report which highlighted patients’ dissatisfaction with the lateness of access to care for outpatient services. Therefore, the hospital leadership team requested the close monitoring of waiting time to get a new appointment for patients in AWH outpatient clinics. The Health Information Management (HIM) department extracted information from the clinical information system, Cerner Millennium, and produced monthly reports which were presented and discussed with the outpatient department leaders and key executive stakeholders. The Outpatient Department (OPD) predictive tool used was developed by Hamad Medical Corporation (HMC) Business Intelligence Unit (BIU) in October 2017. The tool was designed in order to help facilities better predict and anticipate demand while informing the decision-making to plan actions to address challenges. After consultation with the Wakra HIM team, the tool was enhanced to integrate work already done outside of the OPD template by Al Wakra OPD clinics.
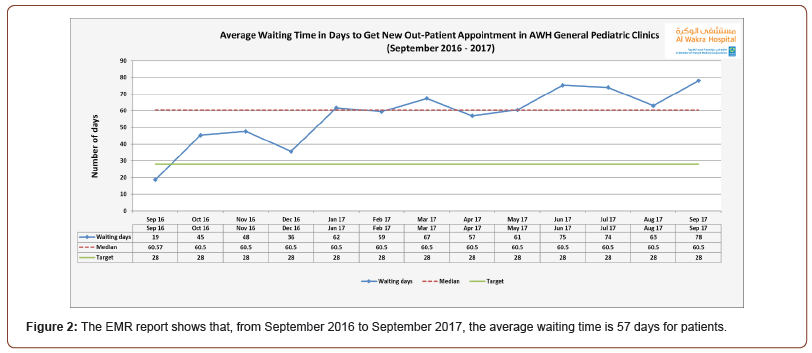
The collected data from the Electronic medical Record (EMR) was displayed on a run chart over time done using excel sheet software and the outpatient (OPD) predictive tool displayed also on excel sheet. Microsoft Visio 2010 used to develop all diagrams in this study. The EMR report shows that, from September 2016 to September 2017, the average waiting time is 57 days for patients (See Figure 2).
The baseline data for average waiting time for the triage process was presented using a run chart plotting the data on a time series sequence (Figure 3). The run chart shows a rather constant average waiting time value of 6 days over a period of 12 months.
In 2017, AWH identified the national standard waiting time for new appointment as one of the top five hospital priorities due negative impact of the long waiting time, such as patient/ family dissatisfaction, was acknowledge from the hospital survey. The referral management and booking processes were carefully mapped. Discussions were held to analyze the root causes that may have contributed to the long waiting times using the Fishbone or cause and effect diagram (Figure 4).

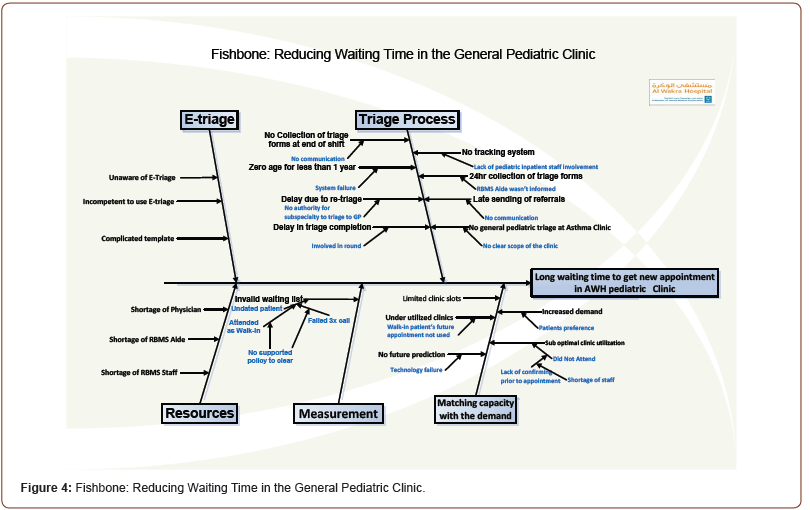
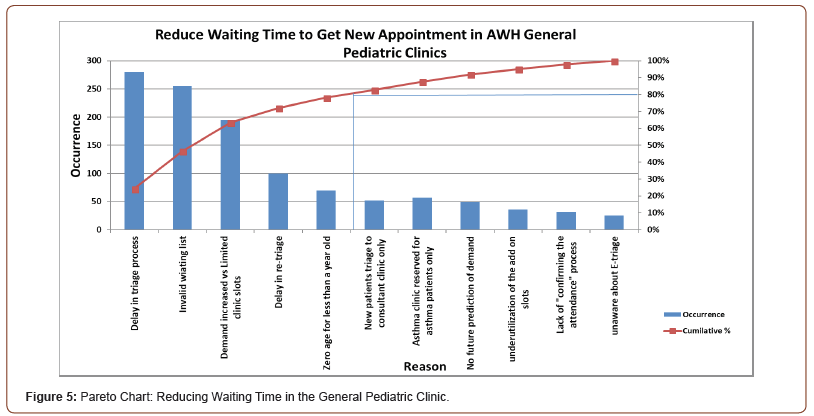
The team brainstormed and used the cause & effect diagram to list all the reasons for the long waiting days. Then the team agreed on the reasons that have the highest occurrences using Pareto Chart (Figure 5). A number of root causes were identified such as ineffective triage process, lack of use of the referrals E-triage, lack of resources like RBMS manpower or pediatric consultants, invalid waiting list in the EMR, limited clinic slots to match demand, unavailable future prediction model, suboptimal clinic utilization due to DNA and walk-in patient with scheduled appointment which end up by DNA. The team was able to identify process areas that generate the longest idle time, triage being the most affecting factor. Therefore, the triage process was mapped, and it appears that the step of re-triage added no value to the process.
The project team tried to understand the baseline data from EMR, where 60% of patients on the waiting list had no appointment date and were still active on the waiting list. This anomaly is a result of HMC having no policy mandating the clearance of such cases from the list. This invalidates the reported waiting times. The recommended action is to exclude these undated appointments which would reduce the average waiting time.
It was also reported that 40% of the waiting patients were booked, and that 90% of those booked patients had triage completed within 6 days on average from referral, while 40% of referrals were delayed by an additional 3 days due to re-triage.
Another cause for concern was the fact that a cohort of patients were not attending their scheduled appointment which results in a waste of clinic slots and underutilization of resources. On the other hand, other patients attended the clinic as walk-in and missed the next scheduled appointment. The cumulative effect of these issues was affecting the effective utilization of the clinic. The baseline data showed around 39% DNA on average and 4% walk-in, while HMC target for DNA is 10% and 15% for walk-in.
The above analysis of historical data led to the conclusion that the nature of this QI project is multifactorial with triage process, clinic slots, capacity and demand are highly contributing to the unwanted outcome measures.
Study Tool
The multidisciplinary team used the Model for Improvement (MFI). MFI is “a simple yet powerful tool for accelerating improvement by spreading changes across multiple sites” [8]. This model has been very effectively used by many of healthcare organizations in different countries to improve health care processes and outcomes [8]. The MFI is an integrated approach to drive improvement in delivering fast and substantial outcomes in quality and productivity in varied setting [9]. The MFI is a framework that aims to answer three fundamental questions before testing an improvement concept and a process for testing change ideas using the Plan-Do-Study-Act (PDSA) cycle.
The team developed a driver diagram (Figure 6) to display the team’s theory on what drives, or contributes to, the success of the project. The driver diagram includes:
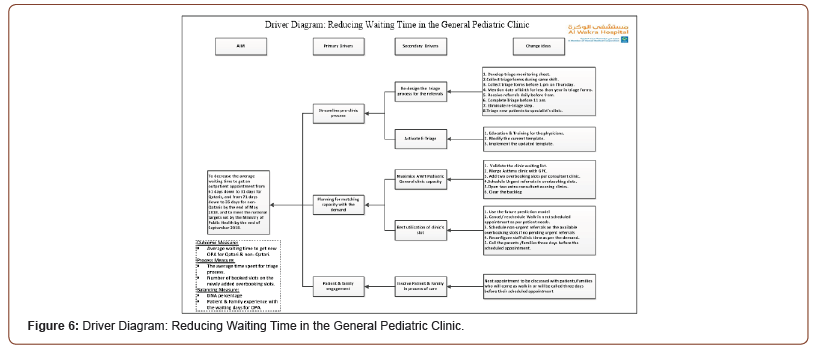
• The primary drivers or most significant high-level
influencers on the aim.
• Secondary drivers or sub- influencers to achieve the
primary one.
• Specific change ideas to be tested for each driver.
The team decided on the following project performance
measures outcome measures:
• Average waiting time to get new outpatient appointment
for Qatari and non- Qatari patients.
Process measures.
• The average time spent for triage process of referrals.
• Number of booked slots on newly added overbooking
slots.
• Balancing measure:
• Patient and family experience with the waiting days in
AWH general pediatric clinics.
• Percentage of DNA.
Twenty-seven PDSA cycle ramps were designed with support of predictive tool to test innovative changes in current operational processes in an attempt to improve waiting time in the general pediatric clinic at Al Wakra Hospital.
Aging
Following the implementation of each change, a preliminary analysis was carried out to evaluate the impact on each measure monitored. Our tested changes showed significant improvements following PDSA cycle ramps and a total of 27 cycles were tested over a 4-month period.
This section will present the results of three performance measures selected for this QI project, namely: outcome measure, process measures and balancing measure.
Outcome Measures
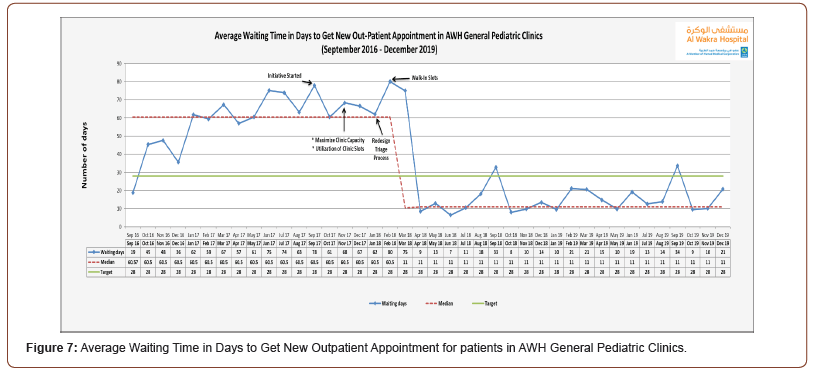
The outcome measure for this improvement project is the average waiting time in days to get a new outpatient appointment for patients in GPC.
The run chart presented in (Figure 7) shows that the average waiting time in days for patients to get new appointment in the GPC. The baseline data pre-implementation from September 2016 to September 2017 revealed an average waiting time of 57 days. The 27 PDSA cycles ramp were implemented from December 2017 until March 2018. The result shows a decrease in the average waiting time as shown in the below graphs: the average waiting time for patients to get new appointment was 28 days in 2018 and 16 days in 2019.
Process Measures
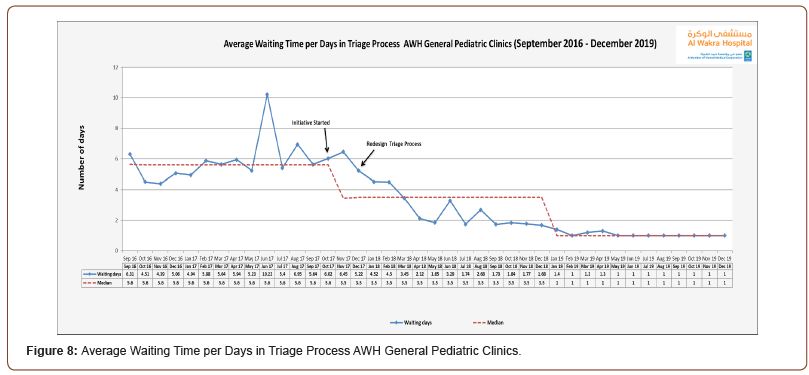
The process measures for this improvement project are the average time spent for the triage process for referrals, and the number of booked slots on the newly added overbooking slots. Before describing the process measures’ run charts, it is important to highlight the two PDSA cycle ramps that were successfully implemented. The first PDSA cycle ramps aimed to streamline the pre-clinic process as a secondary driver which was 12 consecutive cycles starting from December 2017 to the end of January 2018. Each cycle was tested to assess the success of the change and then piloted and implemented. By end of January 2018, the triage process was streamlined and re-designed by eliminating the re-triage step. The triage data analysis revealed that the average waiting time in triage process decreased from 6 days to 2.6 days in 2018 and 1 day in 2019 (Figure 8).
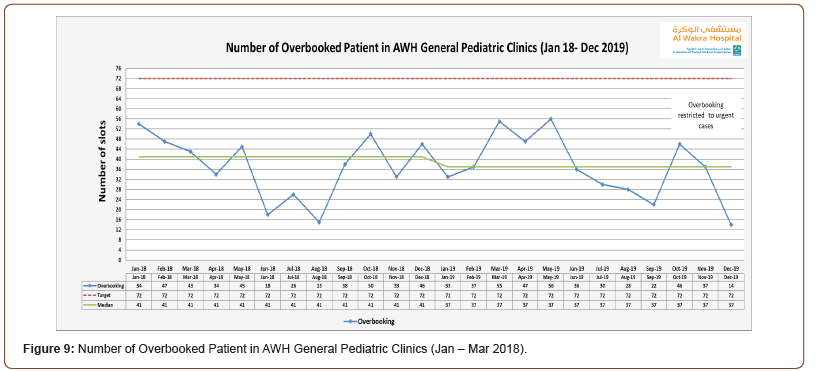
To match the capacity with the demand, the 2nd PDSA cycle ramps aimed to increase the clinic slots and optimize the clinic utilization as a secondary driver. The second ramp was made of 11 PDSA cycles from January 2018 to April 2018. In January 2018, the overbooking slots were added to each consultant’s morning, afternoon and evening clinics. Therefore, 14 overbooking slots were added per week. By April 2018, two extra evening consultant clinics were opened equating an additional 18 extra slots per week.
These overbooking slots added in total 72 extra slots per month to the 144 existing monthly slots, and clinic capacity increased to 216 slots per month.
The run charts presented in Figure 9 shows the number of overbooked patients seen in the GPC. It is clearly demonstrated that the newly added 14 overbooking slots were utilized, however, in November 2019 the utilization of the extra slots reduced due to the new decision made to restrict the overbooking to urgent cases only.
Balancing Measures
The balancing measures for this improvement project are the percentage of DNA, and patient and family experience with the waiting days to get new appointment in GPC.
To optimize clinic utilization as secondary driver, walk-in patient’s future scheduled or cancelled slots were re-assigned to new patients. Therefore, the RBMS was able to reschedule 12.5% of the walk-in patients in March 2018 and April 2018. In addition to that, on 17th of April 2018 the clinic staff started an initiative to call patients three days prior to their appointment to confirm their attendance. This initiative aimed to reduce the DNA percentage. Both changes have reduced the DNA percentage from 39% (Sept 2016 to Sept 2017) to 26% in 2018 and 2019. The below run chart for overall DNA percentage in GPC (Figure 10).
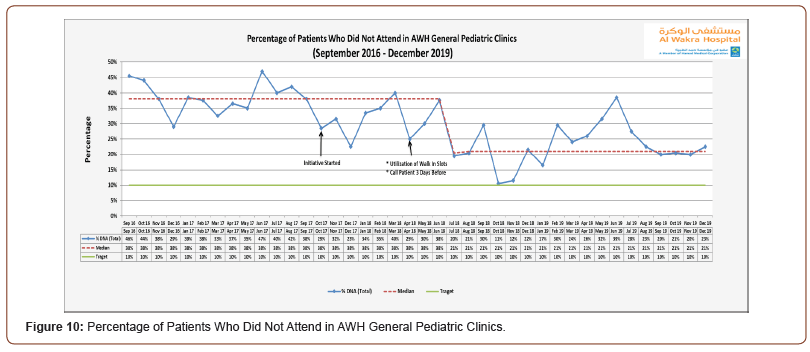
Patient & family engagement as a secondary driver was performed concurrently with the above two PDSA cycle ramps in order to involve the parents and families in the process of care. Families share their views around elements of the process such as suitability of appointment timing, the importance of the 3 days reminder call prior to the appointment which is more popular than the text message. The parents and families started to answer the booking call and requested that appointments be rescheduled at a time of convenience, therefore preventing walk-in activity. To evaluate the patient and family experience in relation to the waiting time to get new appointment, patient and family experience survey should be conducted to assess their satisfaction and their engagement.
Discussion
Waiting times in healthcare exists primarily because of the mismatch between the existing capacity and increased demand. Meeting the national standard for clinic waiting time for new appointment has become a priority at AWH hospital.
The average waiting time to get new OPA improved despite the significant increase in the number of referrals received by AWH for GPC. The average number of referrals over one year period (November 2016 to November 2017) was 83 referrals. However, an average of 190 new referrals from December 2017 to December 2018. which mean that the demand was doubled (see Figure 1). It appears that to truly appreciate the impact of the three PDSA cycles ramps, that demonstrate the improvement generated by the changes introduced. Overall, assessing average waiting time required a period of one year. The result was congruent with Tan study (2017) which required one year observation after implementation of the changes on waiting times.
In this QI project, existing referral and booking systems were reviewed and improved through streamlining of workflow processes in an innovative and collaborative manner. Due to streamlining the existing process, the team was able to match between the capacity and demand in order to achieve the target for the waiting time for new appointment
We decided that the waiting list should be analyzed first before addressing capacity challenges. The waiting list analysis process required resources to be allocated in terms of staff and time. The project team discussed that the long waiting time might be a result of inappropriate referrals or invalid demand. By analyzing the existing waiting list, the team recognized undated patients which proved to be an issue that required active resolution before any other intervention could be considered. The reasons behind these undated referrals were that the RBMS repeatedly failed to get in touch with parents either because of wrong phone number or change of phone number or unavailability of parents. These kinds of challenges were tackled in many studies, especially the study was conducted in Qatar Mohamed [10] showed many logistic factors attributed on DNA like communication, and timing of the appointment.
Many deficits in referrals were identified such as 16% of referrals are duplicate or triplicate, and incomplete or invalid and subsequently many patients were attending the clinic as walk-in patients and would still be active on the waiting list. It took around two months to validate the waiting list. The hospital policy regulates the clearance of these patients.
In streamlining the triage process, the team was able to process-map the existing triage process and eliminate the nonvalue- added step which is the re-triage step therefore improving the process efficiency. In doing so, we reduced the average waiting time in triage process from 6 days to 2.6 days in 2018 and 1 day in 2019.See (Figure 8) which showed a significant impact on reducing the waiting time. Many studies in literature showed the significant impact of the triaging process on reducing waiting time to get new appointment [11] which is aligned with the results of this improvement project.
The current resources are made of the clinic slots, the outpatient staff nurses and physicians, while the demand includes the new referrals received from catchment areas such as primary healthcare, emergencies, and the private sector. The general pediatric clinic is also overwhelmed with referrals from other catchment areas due to patient preferences. The focus is to match the capacity with the demand and optimize the use of existing resources in terms of clinic slots and staffs. Therefore, a justification provided for the need to add extra overbooking slots and fund the opening of extra evening clinics. Despite the fact that the clinic suffers from a shortage of manpower due to long recruitment timeframes and budget allocation challenges, the team tried their best to decrease the extra cost by reconfiguring the staff duties to meet the demand. The newly added 14 overbooking slots were utilized over 2 years period as presented in Figure 9. Based on the OPD predictor tool, adding 14 slots requires 17 weeks to show a reduction in the waiting time for OPA. On the other hand, injecting additional capacity by opening 2 evening clinics and clearing the backlog on April 2018 which required 11 weeks to show a reduction in the waiting time for OPA. Combining both changes which happened to be simultaneous in April 2018 added additional 32 slots which required 9-10 weeks to observe a reduction of the waiting time. The two combining initiatives were considered an innovative approach of creating more capacity within OPD compared to the studies that relayed only on adding more manpower and resources to overcome the long average waiting time [1,12].
On the other hand, running the existing slots is costly which requires a maximal and optimal utilization of each and every clinic slot. Therefore, in addition to the SMS is usually sent five days prior to the appointment, the team tried to decrease the DNA percentage by calling the parents three days before their scheduled appointment, remind them of their imminent appointments and confirm their attendance. This process offered them the opportunity to request a more convenient date and time for an appointment. The concern here was that the scheduling date and time depended on the parents or family’s availability and preference not the patients themselves, mostly due to professional commitment of parents. The result showed a reduction of the DNA percentage in 2018 and 2019 in comparison with 2017 percentage as high DNA percentage was expected due to long waiting time to get OPA. Patient needs will not be met with the long waiting and, as a consequence, many patients will attend the clinic as walk-in or seek other facilities and subsequently will not attend their scheduled appointment which will equally in increase the DNA percentage. Tan [13] implemented same strategy by a 5 Day SMS and 48 Hours Call’ prior to their children’s appointments which resulted in reducing average waiting time by 30%.
Many studies highlighted the relationship between the waiting time the patient/ family satisfaction. Indeed, patient satisfaction is considered as one of the most important indicators for healthcare services quality [14-17]. This importance requires to regularly evaluating patient and family satisfaction through satisfaction survey. However, a patient satisfaction survey was planned but not conducted post project implementation. Patient and family engagement were imbedded in many of the changes implemented in this QI project which was presented earlier in this study.
Limitation
There are a few limitations in this QI project. The project work is based entirely on data from the EMR. Due to the extensive process of validation required to be done by the OPSIP team, the EMR report is only released a month and a half after the monthend in question. This means the data collected in April 2018 only really extends to the end of February 2018. Though this is not ideal, it is certainly preferable to use validated data endorsed by the wider corporation to measure achievements against. Initially, there was no supporting policy to deal with undated appointment to allow the team to clear the list from those patients unsuccessfully called 3 times and to send them notification that they need to restart the process of getting new appointment in the clinic. Undated referrals considered as a challenge and clearing them required workforce and time resources. The same patients may have already attended the clinic as walk-ins and even have been given a future appointment. Unfortunately, the data provided by the OPSIP team cannot be customized into morning, afternoon and evening in order to study the load based on clinic timing.
Despite the pediatric consultants being given training on the E-triage and the system being modified, the implementation of changes was delayed due to the lengthy process to get the approval from the hospital executive team. The team believes that E-triage will reduce the average waiting time significantly as well as prevent any missing referrals and increase the efficiency of resources utilization.
A high DNA is a complex issue in pediatric clinics as attendance depends not only on the availability of the patients but also of a parents and families. DNA disrupts a healthcare system and poses financial loss to any organization including HMC. Preimplementation of a patient experience survey can be considered in the future in order to compare the pre and post patient and family satisfaction in relation to the implemented changes.
Conclusion
Hamad Medical Corporation’s current healthcare system is not exempt from challenges that affect healthcare providers around the world. Outpatient departments, particularly, are challenged in terms providing timely and efficient access to care to the population. Hospital leadership teams are challenged to design strategies to accommodate the needs of patients rather than continue to rely on outdated processes which are not conducive of good performance nor patient satisfaction.
Al Wakra Hospital, being the only hospital in the South of Qatar, naturally represents the hospital of choice for the local population, while a number of families from other geographical areas choose to seek treatment there. The challenge for the AWH leadership team is to meet patients and families’ expectations through the delivery of an efficient ambulatory care service, and to meet the national standards set by the Ministry of Public Health. To achieve this, waiting times represent a key indicator of performance not only in terms of quality of care but also in terms effective and efficient clinic resource utilization. Moving forward, sustainable and continuous improvement of waiting time poses an on-going challenge for healthcare providers as it is an index for policymakers to evaluate the quality of healthcare, not only in a single institution but also at national level. The quality improvement project for the AWH general pediatric clinic demonstrates significant improvement in waiting times for new appointments, the recommendation for the hospital leadership would be to rollout the improvement methodology to other clinics that suffer from similar challenges.
Acknowledgments
None.
Conflicts of interest
None.
References
- Mardiah FP and Basri MH (2013) The Analysis of Appointment system to reduce outpatient waiting time at Indonesia’s public hospital. Human Resource Management Research 3(1): 27-33.
- Harper PR and Gamlin H (2003) Reduced outpatient waiting times with improved appointment scheduling: a simulation modelling approach. Or Spectrum 25(2): 207-222.
- Rinder MM, Weckman G, Schwerha D, Snow A, Dreher PA, et al. (2012) Healthcare Scheduling by Data Mining: Literature Review and Future Directions. Journal of Healthcare Engineering 3(3).
- Mohamed K, Mustafa A, Tahtamouni S, Taha E, Hassan R (2016) A quality improvement project to reduce the ‘No Show’rate in a paediatric neurology clinic. BMJ Open Quality, 5(1): u209266.
- Rose KD, Ross JS, Horwitz LI (2011) Advanced access scheduling outcomes: A systematic review. Archives of Internal Medicine 171(13): 1150-1159.
- Daggy J, Lawley M, Willis D, Thayer D, Suelzer C, et al. (2010) Using no-show modeling to improve clinic performance. Health Informatics Journal 16(4): 246-259.
- Lynn J, Baily MA, Bottrell M, Jennings B, Levine RJ, et al. (2007) The ethics of using quality improvement methods in health care. Ann Intern Med 146(9): 666-673.
- Langley GL, Moen R, Nolan KM, Nolan TW, Norman CL, et al. (2009) The Improvement Guide: A Practical Approach to Enhancing Organizational Performance.
- Courtlandt CD, Noonan L, Feld LG (2009) Model for improvement-Part 1: A framework for health care quality. Pediatric Clinics, 56(4): 757-778.
- Mohamed K, Mustafa A, Tahtamouni S, Taha E, Hassan R (2016) A Quality Improvement Project to Reduce the ‘No Show’ rate in a Paediatric Neurology Clinic. BMJ Quality Improvement Reports 5(1).
- Knight V and Mc Nulty A (2006) Triage in a public outpatient sexual health clinic. Sexual health 3(2): 87-90.
- Rohleder TR, Lewkonia P, Bischak DP, Duffy P, Hendijani R (2011) Using simulation modeling to improve patient flow at an outpatient orthopedic clinic. Health care management science 14(2): 135-145.
- Tan JHT, Rajendra B, Shahdadpuri R, Loke CY, Ng SSL, et al. (2017) A quality improvement project to reduce waiting time for pediatric outpatient referral clinics in Singapore. Proceedings of Singapore Healthcare 26(4): 224-229.
- Alkuwaiti A, Maruthamuthu T, Akgun S (2018) Factors associated with the quality of outpatient service: The application of factor analysis – A case study. International Journal of Healthcare Management 1-6.
- Bielen F and Demoulin N (2007) Waiting time influence on the satisfaction-loyalty relationship in services. Managing Service Quality: An International Journal 17(2): 174-193.
- Chen Bl, Li Ed, Yamawuchi K, Kato K, Naganawa S, et al. (2010) Impact of adjustment measures on reducing outpatient waiting time in a community hospital: application of a computer simulation. Chinese Medical Journal (English Edition) 123(5): 574-80.
- Mohebbifar R, Hasanpoor E, Mohseni M, Sokhanvar M, Khosravizadeh O, et al. (2014) Outpatient waiting time in health services and teaching hospitals: a case study in Iran. Global journal of health science 6(1): 172-180.
-
Ghadeer Mustafa, Almunzer Zakaria, Muna Atrash, Sara Kazkaz, Ayman Tardi, Ayman Ghanem etc all. Reducing Waiting Time in The General Pediatric Clinic at Al Wakra Hospital, Qatar. Glob J Aging Geriatr Res. 1(5): 2021. GJAGR.MS.ID.000521.
-
Medicine; Pediatric; Public Health.
-

This work is licensed under a Creative Commons Attribution-NonCommercial 4.0 International License.


