 Research Article
Simulation of Traffic Flow under Heterogeneous Traffic Conditions using VISSIM
Archana Chawla and Mukesh Khare*
Department of Civil Engineering, Indian Institute of Technology Delhi, New Delhi, India
Mukesh Khare, Department of Civil Engineering, Indian Institute of Technology Delhi, New Delhi, India
Received Date: January 17, 2024; Published Date: January 23, 2024
Abstract
Efficient modelling of vehicular traffic is crucial for designing and implementing effective traffic management systems. This study precisely focuses on the application of the microscopic traffic simulation model VISSIM within the complex dynamics of heterogeneous traffic in India. The research is conducted at one of the busiest road sections in Delhi, where both inter-city and intra-city heterogeneous (mixed) vehicular traffic are prevalent. The calibration of the VISSIM model has been carried out using sensitivity analysis, employing statistical techniques like ANOVA to identify and simulate key parameters influencing driving behaviour. The study emphasizes the importance of calibration in adapting VISSIM for Indian heterogeneous traffic conditions, showcasing improved accuracy and applicability in diverse traffic scenarios.
Keywords: VISSIM; heterogeneous traffic condition; calibration and validation; sensitivity analysis
Introduction
In developed countries, traffic typically flows homogeneously, adhering to lane regulations. However, in developing nations like India, traffic is heterogeneous, with vehicles of different types, sizes, fuels, ages, and operating characteristics sharing the same lanes [1]. This diversity makes it challenging to understand traffic dynamics. In order to address issues like congestion, safety concerns, and overall transportation system efficiency, various analytical and numerical models have been developed. Traditional models often involve complex experimental work [2], leading to the adoption of advanced mathematical models known as traffic flow simulation models. Simulation models play a crucial role in modelling traffic conditions, driving behaviour, and the effects of control strategies. These models are classified into three categories based on the level of detail: microscopic, macroscopic, and mesoscopic models. Macroscopic models estimate average traffic flow characteristics by neglecting heterogeneous driving behaviour. Microscopic models, on the other hand, simulate heterogeneous traffic with a high level of detail, treating each vehicle as a discrete agent [3]. Mesoscopic models provide an intermediate approach, describing individual driving behaviour in detail while averaging traffic flow characteristics [4-8].
Microscopic models, based on car-following, lane changing, and gap acceptance theories [9], were developed to capture both longitudinal and lateral vehicle movements. Car-following algorithms focus on maintaining desired speed and safe distances between vehicles, while lane-changing theory governs lateral movements, influenced by driver perception and risk acceptance. The third approach involves drivers estimating gap sizes to facilitate merging or diverging at conflict points [10,11]. The integration of these theories has led to the development of various microscopic traffic flow models. Among these, VISSIM stands out as the most widely used model. Originating from the continuous efforts of Wiedemann [12,13], the first commercial version was developed by [14], and since then, VISSIM has undergone successive improvements.
Overview of VISSIM
VISSIM is a discrete, stochastic and time step-based model, which consider driver-vehicle-units as single entities. The development of model has started almost 50 years ago, when Wiedemann [12] has presented psycho-physical car-following model which describes the movement of vehicles on a single lane without exits. Since starting the model consist basic feature such as graphical network editing, vehicle animation, and background maps. Some advanced features like route definition, signal control interface, 3D visualization, anticipation of driving pattern etcetera has introduced with time and continuous upgradation. VISSIM has the ability to simulate traffic under heterogeneous traffic conditions considering lane change behaviour (merging, diverging, and weaving) and traffic signal variations [15]. The recent version of model has advanced graphical user interface which allows users to add, remove and edit traffic and signal data, base maps, intersections, and road network [16]. Additionally, VISSIM can also generate second-by-second vehicle profile data including speed, acceleration, travel distance, road network characteristics, which is critical for calculating vehicular emission [17,18]. The model used to analysis the capacity of signalized intersection under control operating conditions. VISSIM has been developed to model urban traffic operations comprising private and public transport as well as pedestrian movements. VISSIM can simulate multi-modal traffic flows that comprise more than one type of traffic and their mutual interactions [16].
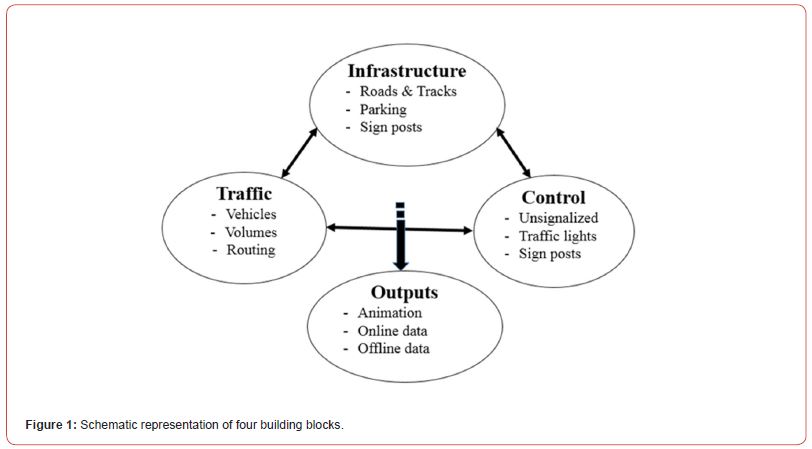
The basic principle of VISSIM consists mathematical model which represent transportation system to simulate technical aspects of physical system. The output has been generated in form of vehicle travelling on road stream. Traffic control can be modeled comprehensively depends upon input and output. Therefore, the simulator contains three major building blocks plus one additional block generating the results of each simulation exercise. All three blocks are inter-dependent (Figure 1). On running a traffic flow simulation, vehicles (block 2) may activate detectors (block 1) which will influence vehicle-actuated signal control (block 3). Thus, all three blocks are constantly activated with interdependencies between each block during the simulation.
Study methodology
Site discerption
In Delhi, a land-locked metropolitan city and the political capital of India, traffic comprises both motorized and non-motorized vehicles. For simulation analysis, a prominent road section along Mathura Road at NH-19, near the Central Road Research Institute (CRRI), has been selected for study. This 1 km-long road connects Sukhdev Vihar to Okhla Vihar and does not have any intermediate streets. The traffic volume has been measured at the CRRI gate, approximately halfway across the network. VISSIM utilizes this traffic flow data to generate vehicle input at starting nodes, assuming an initial traffic flow of zero across the entire network. Each vehicle enters the network through a starting node, traverses the section, and exits through one of the end nodes. VISSIM employs data collection points to measure traffic volume during the simulation.
Road network formation in VISSIM
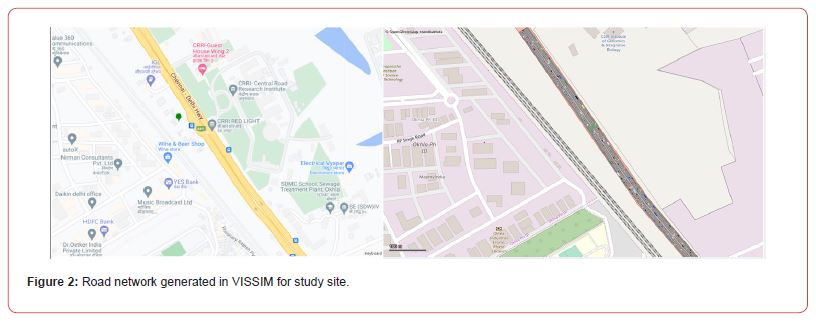
The road network data in VISSIM includes information about each junction, such as lane markings, roadway geometry, signal heads, traffic signs, location of bus stops, buildings, parking lot and any other facilities. This information is used to create a physical layout of the road network in the software. Once the physical layout is defined, the vehicles traveling on the network must be specified. VISSIM requires traffic flow data in two forms: static routing and dynamic assignment routing. Static routing involves specifying the turn movements for each junction and input flow in vehicles per hour. Dynamic assignment routing, on the other hand, involves more detailed information such as the OD matrix, traffic composition, desirable speed of vehicles, travel time, and saturation flows. The traffic control system is specified in the form of signalized intersections. The data needed for signalized intersections depends on the signal settings, such as the cycle length of each signal group (Red, Green, and Amber). This information is used to model the behaviour of vehicles at signalized intersections, including queuing and delay times. In the current study the road network formed in VISSIM using manually measured data from the study site, containing road geometry, roadway type, and signal control details (Figure 2). Moreover, comprehensive data on traffic volume and composition for each hour on both weekdays and weekends has been collected through videographic surveys.
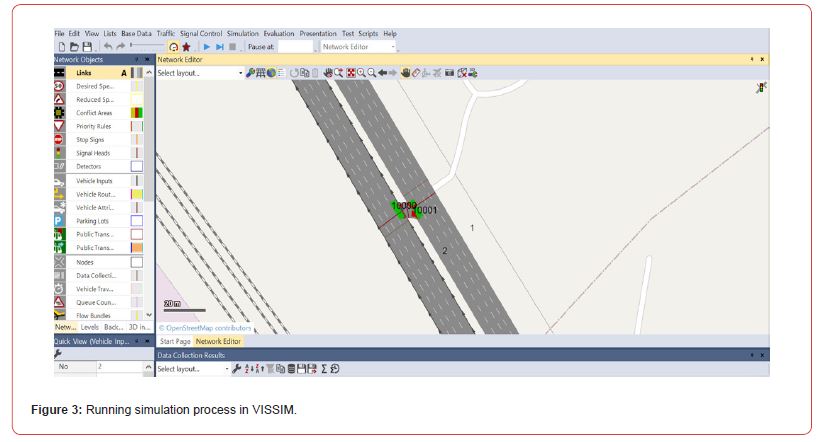
In order to assess the performance of road network simulation, VISSIM has various evaluation tools which include density, delay and queue lengths, vehicle counts and other metrics. The evaluation can be performed for point locations such as intersections, paths, or the entire road network using detectors (data collection points). The management of different types of evaluation files can be organized using Microsoft Access, and the data can be evaluated in an organized manner. This allows for more efficient and effective analysis of the simulation data. Additionally, VISSIM can capture the movement of vehicles and create video clips that can be used to communicate project vision (Figure 3).
Identification of sensitive parameters
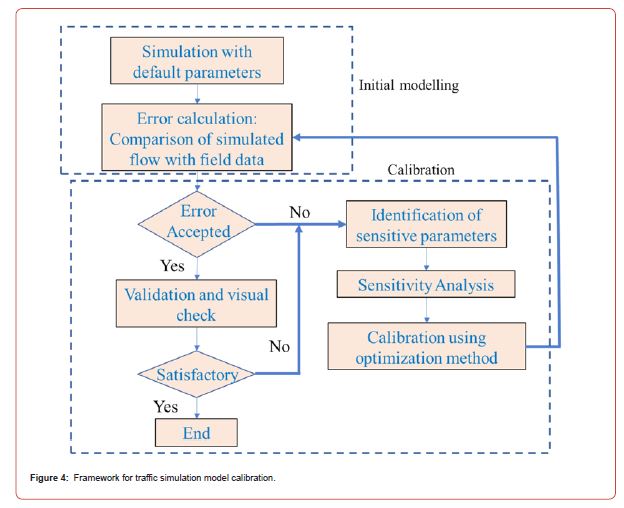
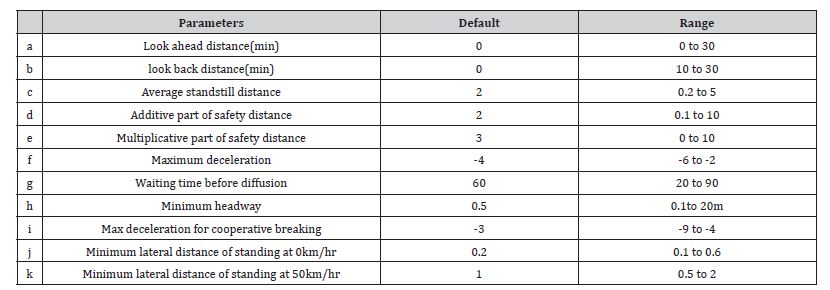
VISSIM has several parameters that need to be calibrated before simulation. The driving behaviour parameters which are selected for sensitivity analysis are shown in (Table 1). Most of the previous literature has shown the sensitivity of these 11 parameters are important. The upper and lower bound limit of the parameters were also selected from previous studies [15,19-23].
Table 1:List of selected parameters.
Sensitivity analysis
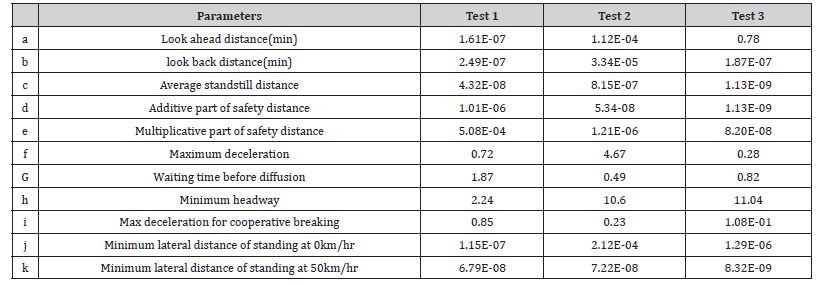
Sensitivity analysis is used to select those parameters that may affect the output in a significant way. In VISSIM the sensitivity analysis has been done using the most prominent statistical technique which is Analysis of Variance (ANOVA). One-way ANOVA technique is used to draw inference as whether parameter is affecting response or not. The random values have been generated using random number generation in excel for all 11 parameters using upper and lower bound limit. Latin Hypercube Sampling (LHS) technique was used to reduce the number of samples required for testing. For the present case 3 sets of 100 numbers each has been generated by MATLAB using LHS technique. Further, VISSIM was used to simulate traffic flow by applying all these random sets values in corresponding driving parameters. The error between simulated outflow and field observation was used as input to ANOVA to obtain sensitive parameters. The three-trail set with 100 simulations each has been carried out. The p-value of ANOVA is used to define the sensitivity of parameters (less than 0.2). As per the ANOVA results the sensitive parameters are look ahead distance, look back distance, average standstill distance, additive part of safety distance, multiplicative part of safety distance, minimum headway, minimum lateral distance of standing at 50 km/hr (Table 2).
Table 2:Parameters with ANOVA results.
Optimization of sensitive parameters
The optimized value of these sensitive parameters was calibrated using Genetic Algorithm (GA). The MATLAB has GA toolbox which is used to determine the optimized set of value with least error between actual and simulated traffic flow. The 7 parameters have been calibrated using their bounds and fitness function. The fitness function was generated by linear regression between actual and simulated flow. Table 3 shows calibrated value of 7 sensitive parameters generated by GA tool of MATLAB [24-29].
Table 3:Calibrated values of sensitive parameters.

Model validation
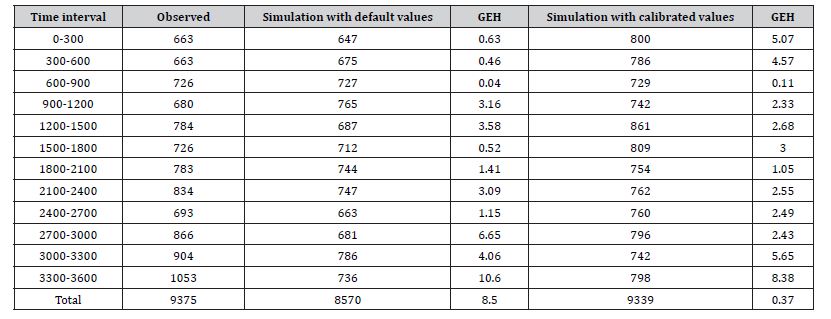
After calibration, the performance of the model is evaluated by validating the model. Traffic volume is the key parameter used for the validation of the model. Performance measure statistics the Geoffrey E. Heaver (GEH) has been used for validation of models. The traffic volume data measured in the field is considered as observed data and data generated from VISSIM model is considered as simulated data. The formula used to determine GEH value is given in Equation (1). As per guideline given by UK highway agency, 2017 for validation of model, any value of GEH statistics less than 5 indicate good fit.

(Table 4) shows the GEH value is 8.50 with default parameters and after calibration the GEH values have reduced to 0.37, which indicate proper calibration of VISSIM model. The traffic flow simulation for weekday and weekend has been done using these calibrated values and obtain results were discuss in preceding section.
Table 4:VISSIM model validation resu.
Application of VISSIM model
The traffic data derived from video recordings are categorized into six main groups: 2Ws comprising motorcycles, scooters, and mopeds; 3Ws encompassing auto-rickshaws and goods autorickshaws; 4Ws including cars, SUVs (Sport Utility Vehicles), and jeeps; LCVs consisting of mini-trucks, pickup trucks, and delivery vans; HCVs comprising two-axle and three-axle trucks, as well as tractor-trailers; and Buses, encompassing minibuses and transit buses. Figures 5 & 6 illustrate the diurnal traffic flow patterns on weekdays and weekends, respectively. While the overall traffic volume remains similar on both days, weekdays exhibit distinct morning and evening peak hours due to office commencement.
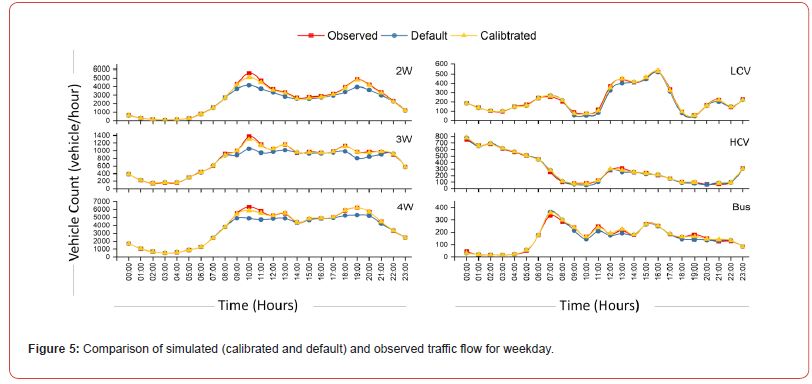
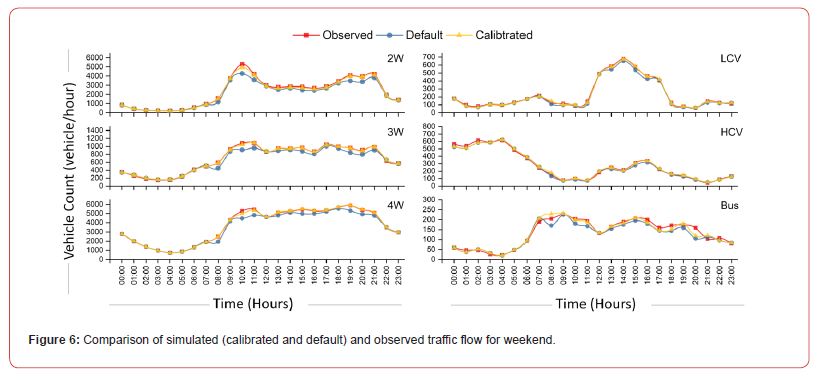
In the current study, the road network simulation was conducted both before and after model calibration to assess vehicle trajectory data accuracy. The calibration process enables the refinement of input parameters, aligning the model more closely with observed traffic conditions. Figures 5 & 6 present a comparison among observed (field) data, uncalibrated simulation data (using VISSIM default parameters), and calibrated simulation data over a 24- hour period for weekdays and weekends. The calibration process not only ensures a more precise alignment between simulated and observed data but also enhances the overall capacity and accuracy of the simulation model, providing a more reliable representation of real-world traffic dynamics.
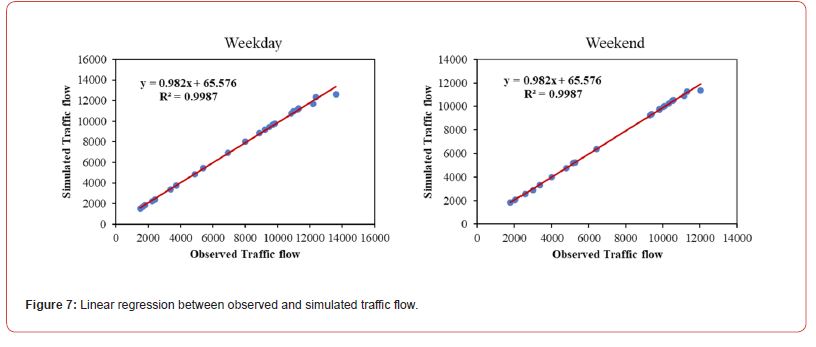
Further, the performance of model was evaluated by using various statistical parameters which compare the daily observed traffic flow with the simulated traffic flow. Index of agreement (d), normalized root mean square error (RMSE), GEH statistic and mean absolute percentage error (MAPE) are some of the appropriate parameters that have been suggested by previous studies (Toledo & Koutsopoulos, 2004; Hollander & Liu, 2008; Siddharth & Ramadurai, 2013; Chauhan et al., 2019). The 24-hour simulated and observed traffic volume was used for analysis. From Table 5 it was seen that the value of d, RMSE, GEH and MAPE were 0.99, 3.32%, 2.76 and 1.1% for weekday and 0.99, 2.16%, 1.81 and 0.80% for weekend respectively. According to Traffic Modelling Guidelines (2013), for the validation of traffic model the value of RMSE and GEH is limited to the value of 10% and 5 for individual link. Hence, the VISSIM model performed satisfactory during simulation of 24-hours weekday and weekend traffic data. In addition, linear regression was used to evaluate the goodness of fit between simulated and observed traffic flows. (Figure 7) shows statistically significant relationship between observed and simulated data. The value of regression coefficient R2 is 0.998 which indicates that the modeled traffic flow has only 0.02% variation from field traffic flow.
Table 5:Statistical analysis of observed and simulated traffic flow.

References
- Jaikumar R, Shiva Nagendra S M, Sivanandan R (2017) Modeling of real time exhaust emissions of passenger cars under heterogeneous traffic conditions. Atmospheric Pollution Research 8(1): 80-88.
- May AD (1990) Traffic flow fundamentals. Prentice Hall.
- Tyagi V, Darbha S, Rajagopal K (2009) A review of the mathematical models for traffic flow. International Journal of Advances in Engineering Sciences and Applied Mathematics 1: 53-68.
- Wang Y, Prevedouros P D (1996) Synopsis of traffic simulation models. Department of Civil Engineering, University of Hawaii, Honolulu.
- Taplin J (1999) Simulation models of traffic flow. De The 34th Annual Conference of the Operational Research Society of New Zealand, New Zealand.
- Boxill S A & Yu L (2000) An evaluation of traffic simulation models for supporting its. Houston, TX: Development Centre for Transportation Training and Research, Texas Southern University.
- Ratrout N T, Rahman S M (2009) A comparative analysis of currently used microscopic and macroscopic traffic simulation software. The Arabian Journal for Science and Engineering, 34(1B): 121-133.
- Azlan NNN, Rohani MM (2018) Overview of application of traffic simulation model. MATEC Web of Conferences 150:03006.
- Chao Q, Bi H, Li W, Mao T, Wang Z, Lin M C, Deng Z (2020) A Survey on Visual Traffic Simulation: Models, Evaluations, and Applications in Autonomous Driving. Computer Graphics Forum 39(1): 287-308.
- Mardiati R, Ismail N, Faroqi A (2014) Review of microscopic model for traffic flow. ARPN Journal of Engineering and Applied Sciences 9: 1794-1800.
- van Wageningen-Kessels F, van Lint H, Vuik K, Hoogendoorn S (2015) Genealogy of traffic flow models. EURO Journal on Transportation and Logistics 4(4): 445-473.
- Wiedemann R (1974) Simulation of the Stra? traffic flow. Univ., Inst. f? r transportation.
- Wiedemann R. (1991) Modelling of RTI-Elements on multi-lane roads. Drive Conference (1991: Brussels, Belgium) 2.
- Fellendorf M (1994) VISSIM: An instrument for assessing traffic-dependent controls. Proceedings of the colloquium "Traffic-dependent control at junctions", Research Society for Roads and Transport, Cologne.
- Yu L, Chen X, Wan T, Guo J (2006) Calibration of VISSIM for bus rapid transit systems in Beijing using GPS data. Journal of Public Transportation 9(3): 13.
- Fellendorf M, Vortisch P (2010) Microscopic traffic flow simulator VISSIM. In Fundamentals of traffic simulation (pp. 63-93) Springer.
- Abou-Senna H, Radwan E (2013) VISSIM/MOVES integration to investigate the effect of major key parameters on CO2 emissions. Transportation Research Part D: Transport and Environment 21: 39-46.
- Abou-Senna H, Radwan E, Westerlund K & Cooper C D (2013) Using a traffic simulation model (VISSIM) with an emissions model (MOVES) to predict emissions from vehicles on a limited-access highway. Journal of the Air & Waste Management Association 63(7): 819-831.
- Park B Brian, Schneeberger J D (2003) Microscopic Simulation Model Calibration and Validation: Case Study of VISSIM Simulation Model for a Coordinated Actuated Signal System. Transportation Research Record 1856(1): 185-192.
- Kim S J, Kim W, Rilett L R (2005) Calibration of Microsimulation Models Using Nonparametric Statistical Techniques. Transportation Research Record 1935(1): 111-119.
- Park B Brian, Qi H Maggie (2005) Development and Evaluation of a Procedure for the Calibration of Simulation Models. Transportation Research Record 1934(1): 208-217.
- Ishaque M M, Noland R B. (2009) Pedestrian and Vehicle Flow Calibration in Multimodal Traffic Microsimulation. Journal of Transportation Engineering 135(6): 338-348.
- Siddharth S M P, Ramadurai G (2013) Calibration of VISSIM for Indian Heterogeneous Traffic Conditions. Procedia - Social and Behavioral Sciences, 104: 380-389.
- Chauhan B P, Joshi G J, Parida P (2019) Car following model for urban signalised intersection to estimate speed based vehicle exhaust emissions. Urban Climate 29:100480.
- Fontes T, Pereira SR, Fernandes P, Bandeira J M, Coelho M C (2015) How to combine different microsimulation tools to assess the environmental impacts of road traffic? Lessons and directions. Transportation Research Part D: Transport and Environment 34: 293-306.
- Hollander Y, Liu R (2008) The principles of calibrating traffic microsimulation models 16.
- Liu H, Chen X, Wang Y, Han S (2013) Vehicle emission and near-road air quality modeling for shanghai, china: Based on global positioning system data from taxis and revised moves emission inventory. Transportation Research Record 2340(1): 38-48.
- Toledo T, Koutsopoulos H N (2004) Statistical validation of traffic simulation models. Transportation Research Record 1876(1): 142-150.
- Traffic Modelling Guidelines (2013) Traffic Modelling Guidelines pp. 238.
-
Archana Chawla and Mukesh Khare*. Simulation of Traffic Flow under Heterogeneous Traffic Conditions using VISSIM. Cur Trends Civil & Struct Eng. 10(3): 2024. CTCSE.MS.ID.000736.
-
VISSIM; heterogeneous traffic condition; calibration and validation; sensitivity analysis; Iris Publishers, Iris Indexing Sites
-

This work is licensed under a Creative Commons Attribution-NonCommercial 4.0 International License.


