 Short Communication
Response of Coupled Power Transmission Tower Line Systems Subjected to Blast Loads
Amanuel Tesfaye1* and Shifferaw Taye2
1Postgraduate student, School of Civil & Environmental Engineering, Addis Ababa Institute of Technology Addis Ababa University, Ethiopia
2Associate Professor of Structural Engineering, Addis Ababa Institute of Technology Addis Ababa University, Ethiopia
Amanuel Tesfaye, Postgraduate student, School of Civil & Environmental Engineering, Addis Ababa Institute of Technology Addis Ababa University, Ethiopia.
Received Date: November 02, 2021; Published Date: Decemeber 14, 2021
Abstract
A study on the effects of blast loads on tower-line coupling, single tower structure and tower-line structure system has been conducted and a variety of structural response variables have been compared. The modular and powerful finite element analysis software Dlubal- RFEM has been utilized for the blast-oriented linear implicit dynamic analysis of latticed transmission line structures covered in this study. The transient dynamic equilibrium equations of the tower have been directly solved by Newmark time integration method. Several study models from this work have indicated that there is up to nearly four-fold increase in support forces in uncoupled systems which subsequently greatly influence the planning, selection, design and detailing of support systems for such structures.
Keywords: Power transmission tower-line coupling; Blast load; Time history analysis; Finite element analysis
Introduction
Terrorist attacks on energy infrastructure are more common
than many might think. According to a report by the Electric Power
Research Institute of USA, which researches issues related to the
electric power industry in the US, from 1996 – 2006 there were
approximately 2500 attacks from terrorist groups against transmission
lines and towers in various parts of the world and 500 attacks
on substations [1]. There have been documented incidents of
lattice transmission towers subjected to blasts in North America.
And there is no guarantee it won’t happen elsewhere. On March 14,
1994, a Hydro-Quebec 131-foothigh transmission tower carrying a
230-kV line was damaged by an explosion [2]. It is futile trying to
monitor the security of a vast rural transmission system. And rendered
impossible for the utilities to protect each of their thousand
power pylons spread across regions.
Bo Chen [3], presented a state of the art review on the dynamic
analysis and control of the transmission tower-line system in the
past forty years. Dynamic modeling, analysis, and simulation tech
niques were reviewed in the paper. Vibration effect and control are
discussed briefly. Aravind [4], conducted a parametric study on cascading
failure properties of electrical transmission lines. The study
was performed on power transmission lines, whose supporting
towers were modeled with (a) linear elastic truss and beam element,
(b) moment-curvature beam elements with elastic-plastic
material properties, and (c) towers with load limiting devices or
tower load controllers. Free vibration analysis was made considering
the damping parameter. It was concluded from the paper that
linear material could not predict the failure or cascading of the
transmission line tower.
In a study conducted in China [5], checked the coupling effect
of an already built steel lattice power transmission towers. A
three-dimensional finite element model was developed using ANSYS
simulation program. The dynamic responses of the tower-line
system under different wind speeds and directions were analyzed
and compared with the Chinese design code. In their study, the ef-fect of wind speed was determined to be a significant factor in the
tower line coupled system. In their conclusion, the Chinese code
method of design using the quasistatic loading was deemed as unsafe
and proposed a modification to the tower line coupling effect
coefficient.
Explosion and Blast Wave
According to researchers [6], an explosion is a very fast chemical reaction involving a solid, dust, or gas, during which a rapid release of hot gases and energy takes place. The occurrence lasts only some milliseconds, and it results in the production of very high temperatures and pressures. During detonation the hot gases that are produced expand to occupy the available space, leading to wave type propagation through space that is transmitted spherically through an unbounded surrounding medium. Along with the produced gases, the air around the blast (for air blasts) also expands and its molecules pile-up, resulting in what is known as a blast wave and shock front. The blast wave contains a large part of the energy that was released during the detonation and moves faster than the speed of sound [6] (Figure 1).
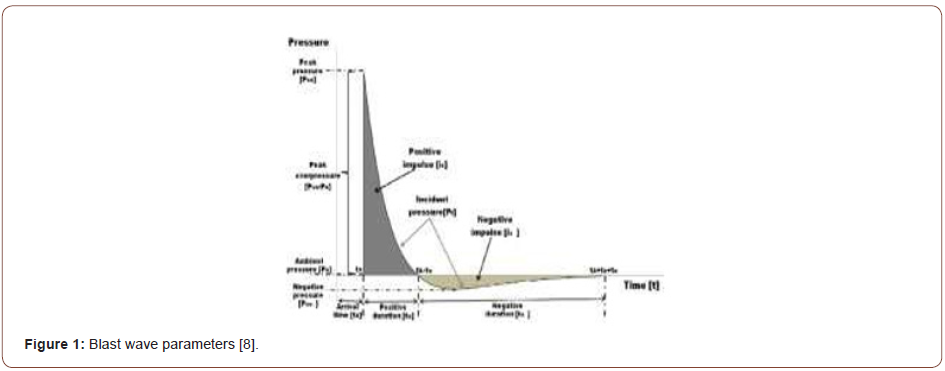
The above figure shows an idealized profile of the pressure
with time for the case of a free air blast wave, which reaches a point
at a certain distance from the detonation. The pressure surrounding
the element is initially equal to the ambient pressure Po, and
it undergoes an instantaneous increase to a peak pressure Pso at
the arrival time tA when the shock front reaches that point. The
time needed for the pressure to reach its peak value is very small
and for design purposes, it is assumed to be equal to zero [6]. After
the blast reaches peak overpressure, the load will decrease exponentially
changing to negative pressure. This is called the positive
phase duration. Then the pressure will be below the ambient pressure.
The duration of the negative phase is relatively longer than the
positive duration. The negative pressure magnitude is very small
when compared to the positive value thus it’s not considered in design
calculation.
Michael [7] has proposed modified Kingery’s equations that are
widely used to describe the properties of blast pressure. The equation
is a polynomial function in which the variables are stated in
tabular form. Variable parameters are based on the scaled distance
of the structure and detonation point.

Where: Z is the scaled distance and A, B, C, D, E, F, G are coefficients that are determined from a table based on the scaled distance. The function represents; time of arrival, incident pressure, reflected pressure, positive phase duration incident pulse, reflected impulse, and shock front velocity.
Modeling and Analysis of Power Transmission Structure
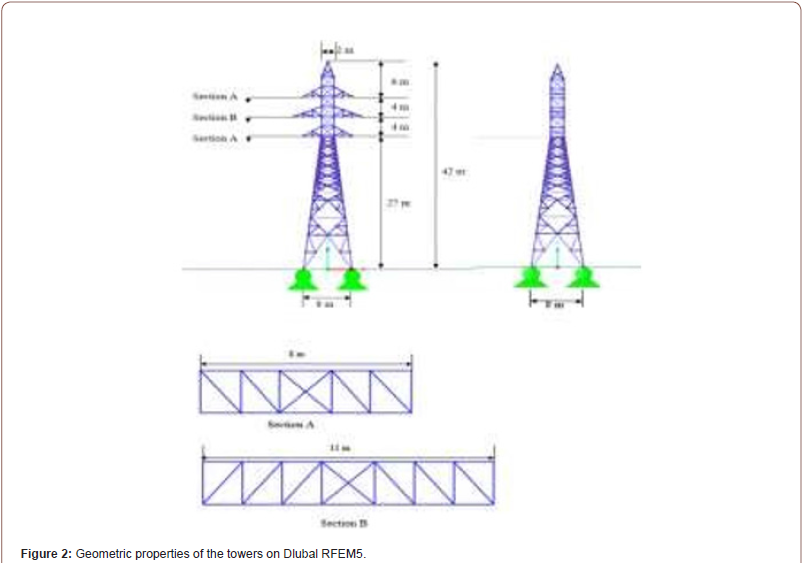
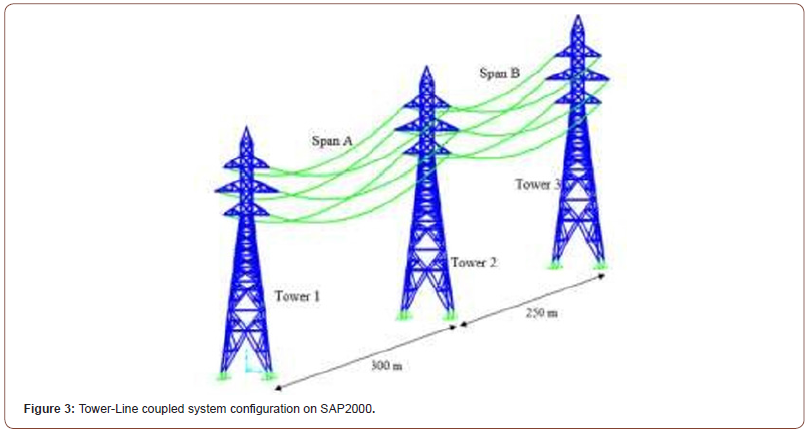
Barrel type steel lattice tower was chosen as supporting structures to model a transmission line. It was then designed to resist dead and live loads according to Eurocode. The transmission-line system consists of structural beam-column elements and conductor cables. The conductor cables are attached to the towers at the top cross arm of the tower. The conductors are all prestressed and take the form of a parabolic curve when installed. The beam-column elements of the tower consist of steel angles that are connected with structural bolts. The tower is 42 meters high with an 8m2 base. The top width of the tower is 2 meters. Spacing between cross-arms is 4 meters. In the tower line coupled system as depicted in Figure 2 & 3, three towers and two spans of conductors were modeled. The first and second spans are 300 and 250 meters long respectively. The height of the tower, its silhouette, and overall dimensions depend on required electrical clearances in detail presented in the electrical part of the Euro code (EN 503411, 2012) (Figures 2 & 3).
The tower is modeled using varying sizes of either single L-profile angles. The tower is constructed from standard S355 steel for all main members of the superstructure. Six conductors on two spans were modeled using three-dimensional nonlinear elastic cable elements, with initial conductor tension of twenty-five percent of the rated tensile strength of the material. These conductors were strung between the towers, as shown in Figure 3. ACSR (Aluminum Conductor Steel Reinforced) PE 100 Conductor (trade name- Pfeifer) was chosen for this investigation.
Verification of Modelling Technique
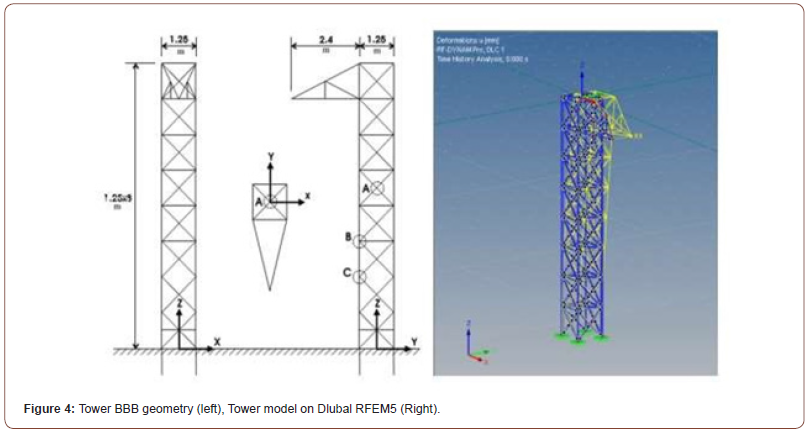
Tower verification
Elastic regime was conducted. program offers. Figure 4 shows an isometric view of the detailed tower in the program (Figure 4) (Table 1). To verify the modeling and dynamic analysis capacity and of Dlubal RFEM5 a previously done experiment was replicated. The experiment conducted in HydroQuébec TransÉnergie [8] was on a prototype power transmission tower. A series of characterization tests (static and dynamic) in elastic and post The tower was modeled in Dlubal RFEM5. The software uses a finite element method based code. The tower components are meshed based on the optimization the In Table 1 comparison is made between numerical analysis and experiment. The values in the bracket are from the numerical analysis of the experimental research author. Xiaohong [8], explains the difference between the experiment and numerical tests as: “The natural frequencies measured from the pluck tests for all the three lowest frequency modes were approximately 20% smaller than calculated values, which confirms that the real test structure is more flexible than its numerical model, mainly because foundation flexibility was not modeled”. Thus, the difference in the modal behavior of the tower arises from experimenting error.
Experimental Study
The time-history files LACC_NOR-1 (earthquake station) in the X direction and LACC_NOR-2 (earthquake station) in the Y direction were applied to the structure simultaneously. Each time history was given in units of cm/s2, with 3000 time steps at equal spacings of 0.02 second for a total of 60 seconds. In the time-history files each line contained eight accelerations points.
- E = 29000 ksi = 199947961.12 KN/m2
- Poisson’s ratio = 0.3
- Beam: W24 ×55 (I/Wide Flange) (ASTM A992 (Fy = 50 ksi (344737.86 KN/m2), Fu = 65 ksi (448159.22 KN/m2)))
- Column: W14 ×90 (I/Wide Flange) (ASTM A992 (Fy = 50 ksi (344737.86 KN/m2), Fu = 65 ksi (448159.22 KN/m2)))
The rubber isolator system utilized in this article was taken from the manufacturer “Dynamic Isolation System”. The rubber isolator system properties were as follows:
- Vertical (axial) stiffness = 10000 kip/in. = 1751267.9 KN/m (linear)
- Initial shear stiffness in each direction = 10 k/in. = 1751.26 KN/m
- Shear yield force in each direction = 5 kips = 22.24 KN
- Ratio of post-yield shear stiffness to initial shear stiffness = 0.2
Figure 3 shows the rubber isolator system support property data as modeled in the SAP2000 software (Figure 3).

The nonlinearity in the model was the shear behavior of the rubber isolators. The vertical loadings and masses were as follows:
Roof: 75 psf (3591 N/m2) for Dead Load
20 psf (957.6 N/m2) for Live Load
Floor: 125 psf (5985 N/m2) for Dead Load
100 psf (4788 N/m2) for Live Load
Concrete slab thicknesses were 6 in. (15.24 cm) for the roof and 10 in. (25.4 cm) for the first and second floors. Diaphragm constraint was provided at each level to ensure diaphragm rigidity. The concrete strength was 4000 psi (27579 KN/m2), and the weight per unit volume was 0.15.
The roof and floors were Shell-Thin members. The plastic zone method of advanced analysis, which uses shell elements to create the entire structure, is the most accurate method to prognosticate steel structures’ ultimate strength and behavior. In the SAP2000 model, the plastic-zone model for structure analysis is accepted.
Figure 4 shows the unscaled response spectra (Figure 4).

Table 1: Natural vibration analysis result.

Cable verification
Dlubal RFEM5 has a very powerful finite element solution method. It can account for geometric and material nonlinear properties of cables. In this paper, only geometry nonlinearity is considered. To verify the capability of the software as well as the geometry and modeling technique of the program, a previously conducted experiment was replicated. Barbieri et al [9], experimented on the dynamic behavior of electric cables of a transmission line. Three sample lengths were used: 13, 30, and 65 meters. The force responses were obtained through an impulse excitation. The comparison of experimental and finite element results from Dlubal RFEM5 is illustrated in Table 2. From this table, it is evident that both results are very close. The percentage of error is less than 5%. The discrepancies in the results are due to some unavailable experiment data (Table 2).
Table 2: Simulated and experiment comparison of natural frequencies Damping.

Damping
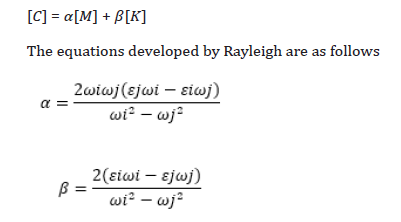
Where α and β are the system’s mass and stiffness coefficients respectively.
In the above equations, ωi and ωj are the ith order and j-th order circular frequencies and £i and £j are the systems i-th order and j-th order damping ratios. As long as any two modes are determined the coefficients α and β can be calculated. The circular frequencies are chosen based on the maximum mass participation factor.
Time History Analysis
The linear implicit analysis was performed numerically using Dual-RFEM. The transient dynamic equilibrium equation of the pole was directly solved by Newmark time integration method.
[𝑀]{𝑥̈} + [𝐶]{𝑥̇} + [𝐾]{𝑥} = {𝐹}
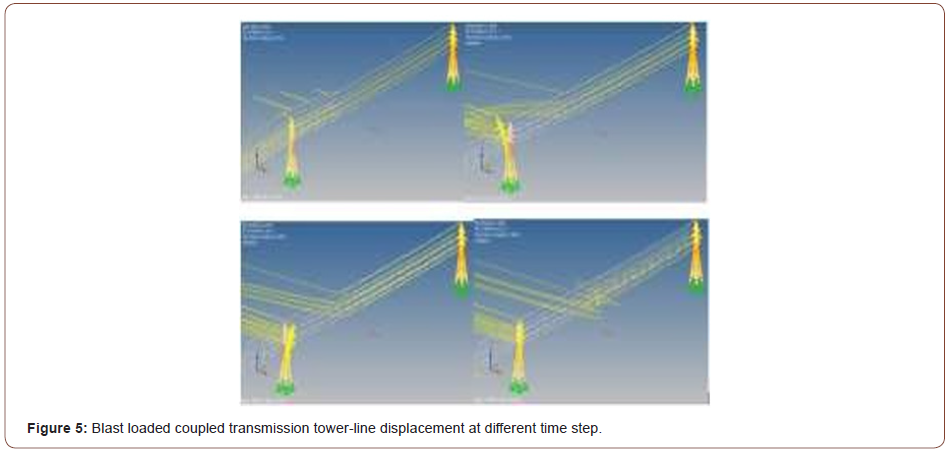
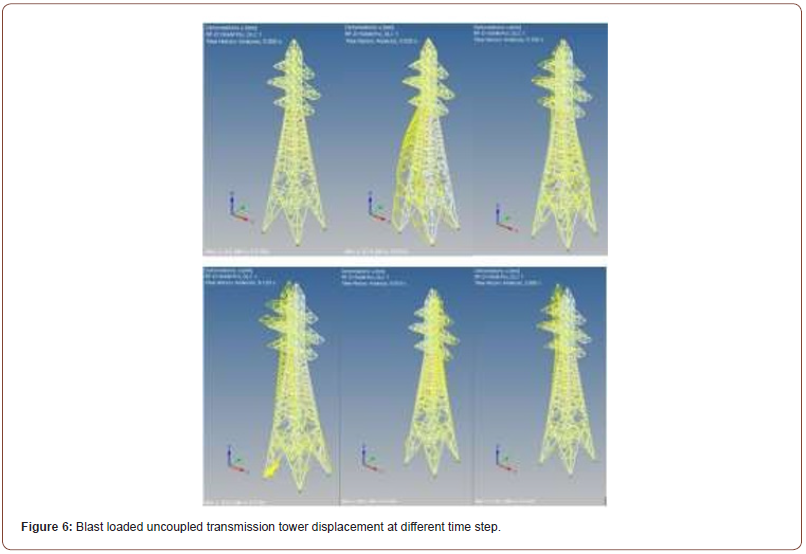
Where [M] is mass matrix; [C] is damping matrix; [K] is structural stiffness matrix; {𝑥̈}, {𝑥̇} and {𝑥} represent the acceleration, velocity, and displacement vector. {F} is an excitation function. Damping [C] is Rayleigh damping discussed in the previous subtopic The tower and conductor structure was modeled with and without damping. The damping ratio was assumed to be 2%. This value was taken based on previous works of literature recommendation. The method of damping consideration is clearly stated in the damping subtopic. Input excitation (blast) was modeled as a triangular impulse loading with a very short amount of time. In microseconds. The duration of the load is equal to the amount of positive phase duration of the blast load [10]. When numerically modeling and analyzing the structure (both tower-line coupled and uncoupled), three-dimensional natural vibration analysis was performed. The masses act on all three (x, y, and z) directions. A consistent matrix was used in the calculation so that the masses would be distributed following finite element shape functions. In the software program, the Lanczos solver is used for analysis. This solver is recommended for most large structures. The mode shapes are scaled with respect to unity. Global stiffness modification was considered. The free-standing uncoupled tower has a first mode of vibration frequency 0.648 Hz which is in the transverse direction. In the longitudinal direction, it is 0.675 Hz. The third mode in the torsional direction has a frequency of 1.232 Hz. A slight difference due to the asymmetry of the tower. Free vibration of the transmission towerline system was analyzed using the finite element method, as done for the uncoupled tower. The initial 300 orders of the natural frequency of the tower-line coupled system and corresponding vibration characteristics were simulated. The first modes of vibration conform to the conductors behaving in an uncoupled manner. Their natural frequency varies between 0.019 Hz to 0.218. These modes happen in both the short and long span of the structure system. Natural vibration mode number 239th up to 300th orders mostly represent the overall vibration model of the tower-line coupling system. Their frequency ranges between 1.281 Hz to 9.61 Hz. Among the vibration modes, 239th mode represents the tower- line coupled model vibration in a longitudinal direction. Modes from number 240 to 242 represent tower and conductor vibration in transverse direction individually. Whereas 257th mode up to 259th corresponds to the torsional vibration of the tower-line system. The blast load time history analysis was performed for two seconds. This is because blast loads occur in a very small amount of time (microseconds). The tower was divided along with its height and varying blast load was applied. The explosion was kept minimum because the scope of paper was limited to linear response of the structure. The varying load was applied on the transmission line as well until blast pressure becomes insignificant. Some components of the tower such as insulators and damping devices were not considered in the model [11] (Figures 5 & 6).
Effect of different standoff distance with the same charge mass
Among the analysis of transmission towers done (36 in total), results of structures with the same blast weight but different standoff distance was studied. As standoff distance decreases, that is if blast origin closes in on tower the displacement, torsional rotation and normal force throughout the structure increases significantly. One thing observed from the graphs is that peak response occurs at the same instance for the close-range blast. As explosive loads become further away, the curve flattens out. This is due to the loading of the structure. As blast origin furthers away from the tower, the variance of loading along the height of the tower becomes small and it will be loaded uniformly (Figure 7).
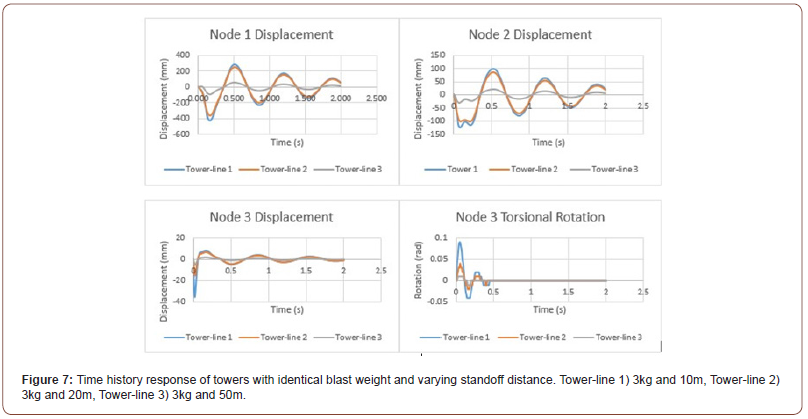
Three different locations were studied on the structure. At the top, at the cross arm and bottom leg. Nodes at three different locations respond in an out of phase manner. This behavior arises from a change in stiffness and loading along with the height of the tower. Displacement and rotation around the bottom of the tower decrease due to fixity to ground. At the same time, the internal load increases significantly. The time history response of a tower-line coupled system is depicted in Figure 7. As standoff distance increases response result curve flattens out. The oscillation cycle decreases. Displacement at top of the tower is shown to be greater than other locations on the tower. The displacement time history between 10m and 20m standoff distance is identical in terms of vector and frequency. But they differ in peak magnitude values. As it is for a single tower when blast origin furthers away variance of loading along the height of the tower and length of the conductor becomes uniform.
Effects of different charge mass at the same standoff distance
As the weight of explosives (severity) increases, the response of the tower becomes more violent. This is observed at node 1 (tip of the tower). This behavior arises due to a lack of fixity at the top of the tower. It is observed that mode of displacement the tower undergoes does not change but magnitude increases significantly. The effect of charge weight when the tower is coupled with conductors remains the same as a single tower in terms of response mode. But torsional response diminishes early.
Effect of modeling the structure as a single tower versus tower-line coupled system
Transmission tower-line systems are complex coupling systems. The coupling effect between the towers and the lines under dynamic blast load has a great influence on the force applied to the transmission towers. However, most existing design codes for overhead transmission lines separate the design of the transmission towers and lines. Blast load sustained by the transmission tower and line was applied as a triangular time history blast load. The linear design theory was implemented when proportioning the tower. The linear design theory is easily implemented, but it underestimates the negative effect of the tower-line coupling vibration on the transmission tower. If a design is done based on transmission tower we cannot get a true response, especially when considering extreme actions. These might lead to an unsafe design. To quantitatively analyze the effect of the tower-line coupled vibration on the transmission tower, this section further calculates the dynamic response of the transmission tower in the transmission tower-line system under different blast load conditions. The results are compared for different parameters of blast between single tower and tower-line coupled (Figure 8).
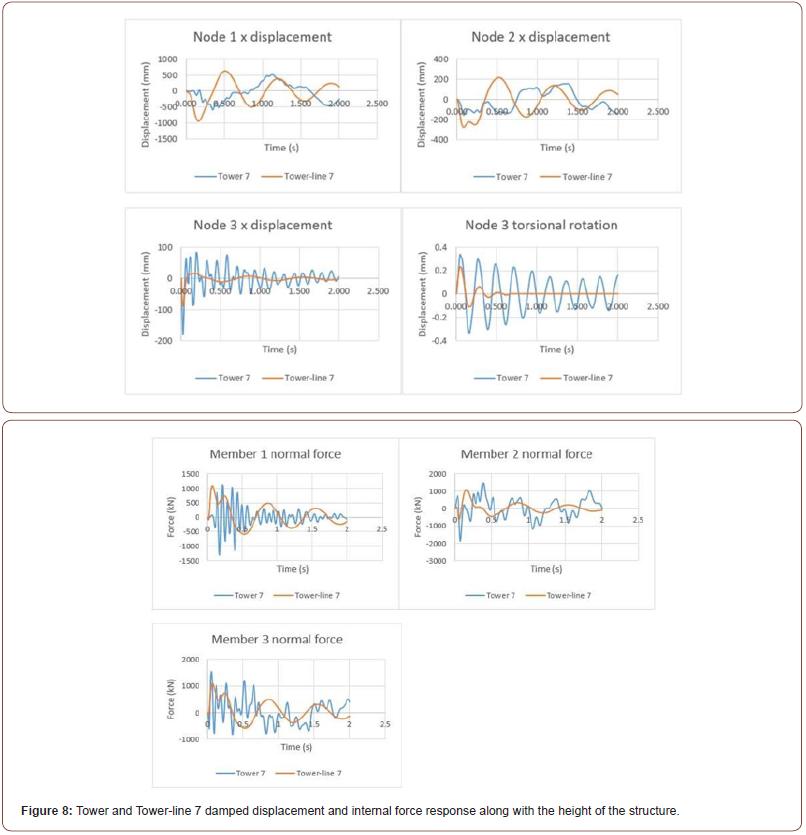
We can generally understand from Figure 8 that displacement
is amplified when towerline coupling exists. This is due to the nonlinear
behavior of cable structures. The damping also plays a general
role in the response of the tower. Both tower and tower-line
system behaved more smoothly when 2% viscous damping was
considered. And there is also a decrement in displacement magnitude
values. At some points, there was a magnitude change of up to
300%. This shows the vitality of the damping properties of these
structures when subjected to impact load.
When it comes to internal forces sustained, the difference
between results is amplified even more. As blast charge weight
increases the response becomes more sporadic. Along with the
height of the structures as well, the pulse of the tower changes significantly.
For comparison between single and coupled tower-line
system, time history response is shown in Figure 8. At the top of
the tower, displacement is greater in the tower-line system. Around
the bottom of the tower, the single tower displacement magnitude
becomes larger. Also, the frequency response is higher for a single
tower system. When there is a presence of conductor cable, tower
response becomes smoother.
When considering normal force created in angle members of the tower, high fatigue creating internal loads occurs in the single tower. Thus, the tower-line system has a relatively smoother forcetime history response. The coupling effect has changed the behavior of tower significantly (Table 3).
Table 3: Maximum force comparison between single tower and tower-line coupled system.
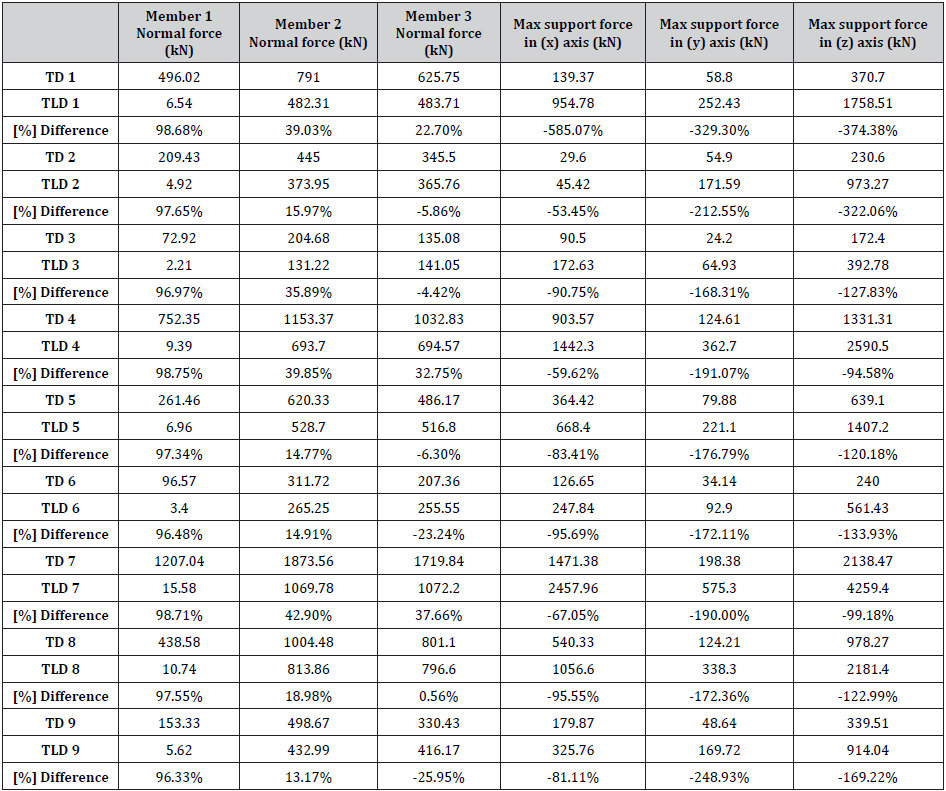
Maximum response values are compared for a tower and tower- line system in the above table. Percentage difference for both displacement and internal force changes without an obvious observable pattern. For displacement comparison, the percentage of data might be misleading because of the difference in millimeters. Both coupled and uncoupled towers have a relatively similar magnitude of displacement when it comes to internal forces. Contrary to what was expected displacement of tower-line system is greater than single tower in almost all cases studied. When it comes to internal forces in lattice members, again single tower exhibits higher amounts of loads. The big difference occurs at support loads. Difference of up to 374% was recorded when support load single and coupled tower system was compared.
Conclusion
Current design codes and guidelines don’t have methods or recommendations on blast loaded power transmission towers. Even if there is a recommendation it does not comprehend tower-line coupled effects. Internal forces in members of the uncoupled tower are generally greater than the coupled system. The main difference arises in the support reaction. There is up to 374% increase in support force. Thus, calculating the support force by considering a single uncoupled tower will lead to underestimating critical loads. When designing such structures, coupling effects should be incorporated in the analysis process. Analyzing and designing of transmission towers should include the effects of conductor coupling.
Acknowledgement
The first author would like to express gratitude to Addis Ababa Institute of Technology for granting sponsorship for this research.
Conflict of Interest
No conflict of interest.
References
- Heidi V (2014) Power Technology.
- Hamilton G (1994) Bomb Dameges Hydro-Quebec Toawer, Ottawa: The Ottawa Citizen, Canada.
- Chen B, Wei-hua Guo, Peng-yun Li, Wen-ping Xie (2014) Dynamic Responses and Vibration Control of Transmission Tower-Line System: A State-of-Art-Review. The Scientific World Journal 2(16): 120.
- Aravind S (2014) Cascade Failure Analysis of Electrical Transmission Lines Using ADINA. Newfoundland: Memorial University of Newfoundland, Canada.
- Meng Zhang, Guifeng Zhao, Lulu Wang, Jie Li (2017) Wind-Induced Coupling Viration Effects of High-Voltage Transmission Tower-Line Systems. Shock and Vibration 12: 1-34.
- Karlos VSG (2013) Calculation of Blast Loads for Application to Structural Components, Ispra: JRC Technical Reports.
- Xiaohong Z (2009) Dynamic Post-Elastic Response of Transmission Towers. Quebec: McGill University, Canada.
- Michael S (1994) Simplified Kingery Airblast Calculations, Silver Spring: Naval Surface Warfare Center.
- Barbieri Nilson, Oswaldo Honorato de Souza, Barbieri Renato (2002) Dynamical Analysis of Transmision Line Cables. Part I-Linear Theory. Mechanical Systems and Signal Processing 18: 659-669.
- Dlubal Software (2018) RF-DYNAM Pro: Natural Vibration Analysis, Response. Tiefenbach: Dlubal Software GmbH.
- EN 50341-1 (2012) Overhead Electrical Lines Exceeding AC 1kV. Brussels: European Standard.
-
Nader Zad, Hani Melhem. Response Modal Nonlinear Time-History Dynamic Analyses of the Northridge Earthquake of a Two-Storied Steel Structure with Rubber Isolator and Fixed-Base Systems. Cur Trends Civil & Struct Eng. 8(2): 2021. CTCSE. MS.ID.000684.
-
Power transmission tower-line coupling; Blast load; Time history analysis; Finite element analysis
-

This work is licensed under a Creative Commons Attribution-NonCommercial 4.0 International License.


