


 Research Article
Prediction of Compaction Parameters of Soil using Support Vector Regression
Received Date: October 08, 2019; Published Date: October 24, 2019
Abstract
Compaction parameters determination in the laboratory require considerable time and effort that can be saved by using empirical correlations at the early stages. This paper introduces some efforts to predict the compaction properties of soils using the index test results. Apart from the experimental result, the result from other literature have also been considered in the analysis here. Different statistical investigation such as histogram, ACF, PACF, kernel function, correlogram and cross correlogram are used to find the relationship of liquid limit, plastic limit and plasticity index with optimum moisture content and maximum dry density. Regression analyses are done with support vector machine algorithm. The best R squared value found from the predicted equation is 0.86 for optimum moisture content and 0.91 for maximum dry density.
Keywords: Prediction; Optimum moisture content; Maximum dry density; Compaction parameters; Support vector regression
Introduction
During the construction of earthworks, filed compaction is important process. Compaction is a dynamic process by means of which soil particles are brought closer together by providing compactive effort leading to an increase in shear strength, reduction of compression and soil permeability. The two parameters which are determined in the laboratory by conducting either standard proctor or modified proctor test are the determination of optimum moisture content (OMC) maximum dry unit weight (γdmax). These parameters are employed in the project specifications to monitor the relative compaction demands. The objective of this paper is to determine the correlations of index properties of soils with optimum moisture content and maximum dry density. Many research efforts have been conducted to correlate the soil index results with their compaction properties i.e. OMC and MDD mainly for clayey soils. Rowan & Graham [1] correlated gradation, specific gravity and shrinkage limit to compaction characteristics. Later Davidson and Gardiner omitted the specific gravity from the equation of Rowan & Graham [1] and included a plasticity index. Ramiah et al. [2] correlated only Liquid Limit with both OMC and MDD. Korfiatis & Manifopoulos [3] introduced four empirical factors in their correlation which was a function of the slope of the grain size curve correlating the MDD of granular soil to specific gravity and fine content of soils. Besides, according to Omar et al. [4], the most significant impact on the soil compaction properties is specific gravity. They studied the compaction characteristics of granular soils in the United Arab Emirates. on a data bank of 354 soil samples from different sources. In a few latest research’s efforts have been taken to create empirical models for the prediction of the compaction properties of ground grain soils. For finely grained soils, efforts have mainly been produced to correlate γdmax and OMC with either LL or PL in particular. Special emphasis has been given on compaction energy in a few studies.
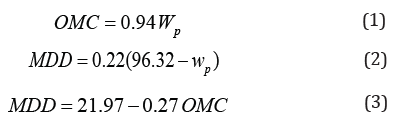
Sivrikaya [5] correlated compaction characteristics of finegrained soils to their plastic limit (wP) as follows:
Sridharan & Nagaraj [6] developed the correlations given in Eq. 4 and Eq. 5
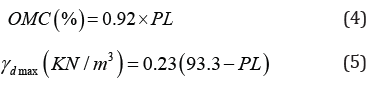
Gurtug &Sridharan [7] introduced CE in prediction of OMC and MDD shown in Eq. 6 and Eq. 7
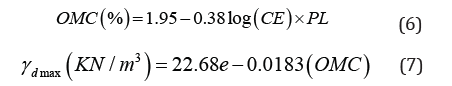
Eq. 8 and Eq. 9 are found from Faizah K [8],
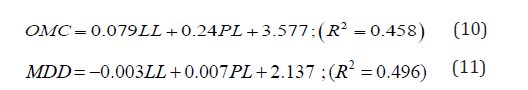
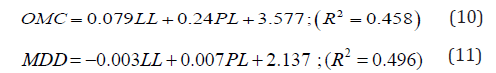
Mohd Ruslan [9] proposed Eq. 10 and Eq. 11
Noor et al. [10] added specific gravity in prediction of OMC and MDD shown in Eq. 12 and Eq. 13
In recent decades, modeling and problem of different geotechnical issues have been widely solved by artificial neural networks [11]. Gu¨naydın [12] used 126 test results of nine different soil types and used multi-linear regression method and ANNs method for the prediction of compaction parameters. Regression analysis and an estimated artificial neural network have shown powerful correlations (0.70–0.95) between soil classification and compaction parameters. There have been limited efforts to correlate − in combination with the PL or plasticity (PI)- γdmax and OMC with LL in the domain. Those works consist of these two parameters in combination (Eq. 8, 9, 10, 11) have relatively low R squared value. In this paper, the regression analysis is done with support vector machine algorithm and thus those error is reduced in a threshold limit. The original SVM algorithm was invented by Vladimir N Vapnik & Alexey Ya Chervonenkis [13]. In 1992, Bernhard E Boser, Isabelle M Guyon and Vladimir N Vapnik suggested a way to create nonlinear classifiers by applying the kernel trick to maximummargin hyper-planes. It is a very popular method and the aim of this model is to find a special straight line for discriminating different classes. For drawing a line between two classes, there are a lot of opportunities and Support Vector Machine (SVM) tries to find the ultimate line of both cases. A boundary line in which SVM is near is tried to be found to distinguish the binary classes from each other. After the boundary line is found, using training data, test data are classified according to which side of the border. The samples are moved to a higher dimensional space which cannot be linearly discriminated. It is now practiced in different field for linear and non-linear regression analysis. Osman Günaydın [14] shown that the compaction parameters can be predicted using support vector regression.
Methodology
40 natural fine-grained soil sample data are collected from Koushik Das et al. [15], taken into consideration for analysis of their properties, their internal relationships and others. The data of liquid limit, plastic limit, plasticity index, specific gravity is fitted with Optimum Moisture Content (OMC) and Maximum Dry Density (MDD) to identify the patterns, behaviors and relationships among them. The correlogram and cross correlogram of Auto Correlation Function (ACF) and Partial Autocorrelation Function (PACF) graph are plotted to find out the deviation and the lag point of deviation to identify similarities. The trend analysis is done with the Dickey Fuller test to observe the future behavior of data. Linear, exponential, polynomial regression are executed and plotted the various regression line to make the best fit of prediction equation considering the Root Mean Square Error (RMSE), Mean Absolute Error (MAE), Theil Equality Coefficient and Bias, Variance and covariance proportion. Histogram, Log transform, Kernel with radial and sigmoid, Confidence ellipse of different percentile fit, and Kernel density function are analyzed to identify relationships among those LL, PL, PI, Gs with OMC and MDD. All the probable relationships are found out and then a prediction equation is formed within the best of fit with the data. This prediction equation is then used to predict the OMC and MDD of 5 soil sample data tested in geo mechanical lab. The original value of OMC and MDD found from test are then compared with the OMC and MDD found from predicted equation to validate the equation.
Result and Discussion
Variation of OMC and MDD with Liquid Limit
To study the compaction characteristics variation trend with LL, the OMC values are plotted treating LL as independent variable in Figure 1. The OMC of a finely graded soil can be seen to depend linearly on its LL. In contrast, the OMC increases with increased LL. Regression models developed in few published literature [6,12,16] are also proved this similar trend of variations. After 1st difference, the scenario is plotted in Figure 2. Differencing of a dataset means making the mean zero and variance constant. From Figure 2 it is found that, OMC and LL are almost proportional. Besides, histogram also proves the relation. (Figures 1,2)
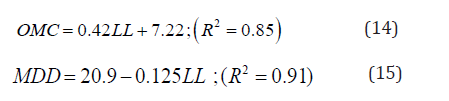
Considering only liquid limit, OMC and MDD can be predicted as follows:


Variation of OMC and MDD with plastic limit
Figure 5 & Figure 6 show that there is still a linear relationship between OMC and PL, but this is not as much as significant from OMC and LL. In the cross correlogram of ACF and PACF, lag 2, 5, 6, 7, 8, 11 are not much significant (Figure 6). Even in lag 3, 4, 7 there contains reverse relationship (Figures 5-8).


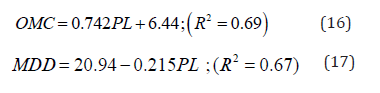
Analyzing the sample data, support vector regression is carried out with linear kernel trick. Optimum hyper-plane is found with maximized margin and the support vectors. The results are then plotted using EVIEWS software shown in Figure 7 & Figure 8. The output equations are given as follows
Introduction
The prediction accuracy of the proposed models is also checked by plotting experimental values versus predicted values of γdmax and OMC using Eq. 16 and 17. The RMSE values in case of γdmax prediction model is 3.9% and 11.5% for the case of OMC model. However, it is recommended that if γdmax and OMC of a finegrained soil is to be predicted either from its plastic or liquid limit, one must use the latter one for better accuracy. This point is also matched with Mujtaba et al. [17].
Variation of OMC and MDD with plasticity index
Optimum moisture content and Plasticity index are also bear relationship, an approximate linear relationship, but not in a satisfactory level. Only plasticity index doesn’t bear a good relationship with OMC and MDD, but combinedly does (Mujtaba et al., 2015). They have proposed their best result, Eq.18 and 19 for predicting OMC and MDD.
If OMC increases, PI increases. From 1st difference of OMC and PI values, the deviation from mean can be easily identified in Figure 9. Besides, histogram shows that there is no reverse relationship between them. The equation may be applied here for prediction is Eq. 20 and Eq. 21

(Figures 9-11)


Plasticity index isn’t a good parameter in prediction of OMC and MDD. Here, the R squared value for OMC is 0.62 and for MDD it is 0.33, which is relatively very poor. To find more precise result, trend analysis and non-linear kernel plot is performed. The kernel plot of Figure 12 shows that the regression line here doesn’t bear a satisfactory relationship. Here, the term original means the collected soil sample data (Figure 12).

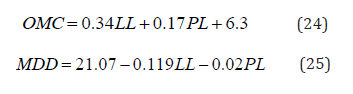
Variation of OMC and MDD with LL and PL
The values of compaction parameters (γdmax and OMC) usually are hard to estimate correctly because too many variables are included, mostly linked to consistency limits which affect the compaction system. Predicting considering both the liquid and plastic limit may have potential drawback and therefore, it is wiser to have a model in terms of both the consistency limits. In a fast assessment of its compaction characteristics, the suggested correlations would be very helpful without the lab compaction test during earlier phases [18,19].
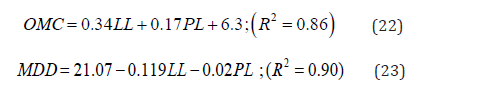
(Figures 13,14)


Figure14 shows the prediction of maximum dry density in terms of liquid limit and plastic limit. Liquid limit, plastic limit, sample data and the predicted data all these are shown here at a time.
Validation
5 natural fine-grained soil samples from different places of Rajshahi, Bangladesh are collected, and these tests are performed in the geomechanics lab
1. Grain size analysis (ASTM D-422 and 4221)
2. Atterberg limit test (ASTM D-4318)
3. Specific gravity test (ASTM D-854)
4. Standard proctor compaction test (ASTM D-698)
5. Modified proctor compaction test (ASTM D-1557)
The experimental OMC and MDD data are then compared with the predicted equation. Here using Eq. 22 and Eq. 23 the experimental and predicted data are shown in Table 1 (Table 1).Table 1: Experimental and Predicted result.

Conclusion
Different statistical analyses are done here to find correlations among liquid limit, plastic limit, plasticity index with Optimum Moisture Content and Maximum Dry Density. Different types of histogram, log histogram, boxplot, cross correlogram, Auto Correlation Function, Partial Auto Correlation Function, Linear and non-linear kernel, Confidence ellipse etc. are used to find out the individual and combined relation of OMC and MDD with soil compaction parameters. At first 40 samples are taken for analysis and then 5 samples are used to validate the results. Different results are hauled from the analysis.
1. When LL increases, OMC also increases but in parallel MDD decreases. However, MDD is strongly related with LL than the relation of LL with OMC.
2. OMC and MDD both are linearly related to PL but not as strongly as LL did. So, LL is still a mandatory thing for OMC and MDD prediction.
3. The ACF value of MDD changes with change of PI, indicating that the Maximum Dry Density is related with PI. But the R-squared value is not as expected as LL did.
4. But LL and PL combinedly give the best result for both OMC and MDD.
5. γdmax can be estimated more precisely from OMC instead of index properties of soils.
The average error found after applied the equations to predict MDD and OMC was only 2% and fitted strongly with other researcher’s findings.
Acknowledgement
None.
Conflict of Interest
No conflict of interest.
References
- Rowan HW, Graham WW (1948) Proper compaction eliminates curing period in construction fills. Civ Eng 18: 450– 451.
- Ramiah BK, Viswanath V, Krishnamurthy HV (1970) Interrelationship of compaction and index properties. In: Proceedings of the second south east Asian conference on soil engineering, Singapore pp.577–587.
- Kofiatis GP, Manikopoulos CN (1982) Correlation of maximum dry density and grain size. J Geotech Eng Div ASCE 108(GT9): 1171–1176.
- Omar E, Shanbleh A, Basma A, Barkat S (2003) Compaction characteristics of granular soils in United Arab Emirates. J Geotech Geol Eng 21: 283–295.
- Sivrikaya O (2008) Models of compacted fine-grained soils used as mineral liner for solid waste. J Environ Geol 53: 1585–1595.
- Sridharan A, Nagaraj HB (2005) Plastic limit and compaction characteristics of fine-grained soils. Gr Improv 9(1): 17– 22.
- Gutrug Y, Sridharan A (2004) Compaction behavior and prediction of its characteristics of fine-grained soils with particular references to compaction energy. J Soils Found 44(5): 27–36.
- Faizah K (2005) Estimation of compaction parameters based on Atterberg limits.
- Mohd R, Che G (2005) Correlation regression between soil compaction parameters and Atterberg limits.
- Noor S, Chitra R, Gupta M (2003) Estimation of proctor properties of compacted fine-grained soils from index and physical properties. Int J Earth Sci Eng 4(6): 147–150.
- Shahin MA (2013) Artificial intelligence in geotechnical engineering: applications, modeling aspects, and future directions. In: Metaheuristics in water, geotechnical and transport engineering, pp.169–204.
- Gu¨naydın O (2009) Estimation of soil compaction parameters by using statistical analyses and artificial neural networks. J Environ Geol 57(1): 203–215.
- Vapnik V (2016) An Overview of Statistical Learning Theory. IEEE Transactions on Neural Networks 10(5): 988– 999.
- Osman G, Abdurrahman Ö, Mehmet S (2018) Regression Analysis of Soil Compaction Parameters Using Support Vector Method.
- Ankurjyoti S, Debankur B, Kaushik D, Hirak JR, Anirjit D, et al. (2017) Predicting Compaction Characteristics of Fine-Grained Soils in terms of Atterberg Limits, Int J of Geosynth and Ground Eng. (2017) 3: 18.
- Dokovic E, Rakic D, Ljubojev M (2013) Estimation of soil compaction parameters based on the Atterberg limits. Min Metall Inst Bor 4: 1–16.
- Mujtaba H, Farooq K, Sivakugan N, Das BM (2013) Correlation between gradational parameters and compaction characteristics of sandy soils. Int J Geotech Eng 07(4): 395–401.
- Mujtaba H, Farooq K, Khalid U (2015) Prediction of Compaction Characteristics of Fine-Grained Soils Using Consistency Limits.
- Sivrikaya O, Togrol E, Kayadelen C (2008) Estimating compaction behavior of fine-grained soils based on compaction energy. Can Geotech J 45: 877–887.
-

This work is licensed under a Creative Commons Attribution-NonCommercial 4.0 International License.


