


 Research Article
Climate Justice and Urban Transportation: A Formal Multi-Criteria Decision Analysis Framework for Evaluating Walking, Cycling, Public Transit, And Electric Vehicles
Received Date:June 30, 2026; Published Date:July 15, 2026
Abstract
This paper presents a conceptual-computational framework paper that develops and applies a structured Multi-Criteria Decision Analysis (MCDA) to evaluate four urban transport modes-walking and cycling, public transit, electric vehicles (EVs), and a combined policy mix-against four climate justice criteria: environmental effectiveness, distributional equity, economic justice, and participatory governance. Drawing on peerreviewed life-cycle emission data, comparative modal share evidence from European and North American cities, and distributional justice theory [1-4], the framework applies a formal 1-5 scoring rubric, min–max normalization, and three alternative weighting scenarios to generate composite scores. A sensitivity analysis demonstrates that rankings are stable across all weighting schemes. Quadrant analysis coordinates are derived transparently from normalized MCDA scores. Key findings indicate that walking and cycling, when supported by safe and inclusive infrastructure, and electrified public transit represent the highest-priority combined interventions. EVs, under current incentive structures and grid conditions, exhibit a ‘double justice gap’: limited climate benefit in fossil-heavy grids and regressive distributional outcomes. The paper concludes with structured policy recommendations directly linked to quantitative analysis results. Scope is limited to OECD urban contexts; application to the Global South and emerging economies requires separate contextual analysis.
Keywords:Climate justice; transport equity; MCDA; sensitivity analysis; electric vehicles; transport poverty; mobility justice
Introduction
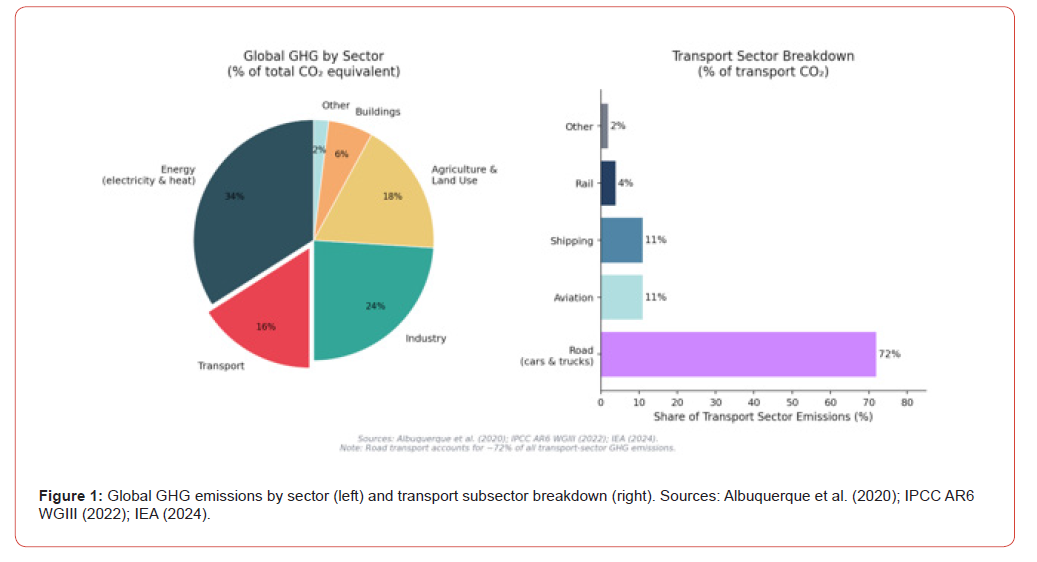
Urban transportation stands at the intersection of two defining challenges of our time: climate change and structural inequality. The transportation sector accounts for approximately 16% of global greenhouse gas (GHG) emissions, with road transport alone responsible for roughly 72% of the sector total-making it the most persistent and politically contested arena of decarbonization [5,6]. Simultaneously, transport infrastructure and its associated pollu tion burdens fall disproportionately on low-income communities, communities of color, the elderly, and people with disabilities [7-9]. These communities also bear the greatest vulnerability to climate impacts while contributing least to their causes.
This paper develops a conceptual-computational framework for evaluating four major urban transport modes-walking and cycling, public transit, electric vehicles (EVs), and a combined policy mix-against the dual objectives of climate effectiveness and distributional justice. Specifically, it makes three methodological contributions: (1) a formal MCDA scoring rubric with explicit criteria definitions, min–max normalization, and documented weighting; (2) a three-scenario sensitivity analysis to test the robustness of rankings; and (3) a quadrant analysis with coordinates derived transparently from normalized scores rather than expert judgment alone (cf. Soria-Lara & Valenzuela-Montes, 2022).
The paper is a conceptual-computational framework paper, not an empirical comparative study. It synthesizes published emission data, modal share evidence, and equity literature to construct a replicable analytical tool. The framework is intended for researchers, planners, and advocates who need a structured, transparent, and reproducible method for evaluating transport policy alternatives through a climate justice lens. Its scope is deliberately limited to OECD urban contexts (primarily Europe and North America), where the modal share data, emissions benchmarks, and equity indicators are most reliably documented. Application to lower-income countries, rapidly urbanizing cities, or the Global South requires separate contextual calibration of criteria, rubric thresholds, and weights [10].
The paper proceeds as follows. Section 2 reviews the theoretical and empirical literature with updated sources through 2024. Section 3 presents the formal computational methodology in full, including rubric definitions, normalization procedure, three weighting scenarios, sensitivity analysis, and quadrant coordinate derivation. Section 4 presents and discusses findings across seven figures and two tables. Section 5 delivers policy recommendations explicitly linked to quantitative analysis results. Section 6 states limitations and future research directions. Section 7 concludes.
Literature Review
Distributive Justice: Theoretical Foundations
Distributive justice in transportation requires that mobility infrastructure, service quality, and pollution burdens be allocated equitably regardless of income, race, age, disability, or gender. Rawls (1971) demands that social arrangements benefit the least advantaged members; applied to transport, this requires that investment decisions prioritize communities with greatest mobility deprivation. Sen’s (1999) capability approach redirects attention from the existence of transport services to individuals’ effective capacity to use them-a distinction with sharp implications for active transport, where physical ability, safety environment, and proximity all condition functional access.
Schlosberg’s (2004) three-dimensional justice framework-distributional, recognition, and procedural-adds that equitable transport outcomes require both fair resource allocation and meaningful participation in planning processes. Sheller (2022), in developing the concept of ‘mobility justice,’ integrates these traditions with postcolonial and intersectional perspectives, arguing that mobility inequalities are inseparable from histories of racial dispossession and gendered spatial exclusion. At the local scale, Sarıkoç Yıldırım [11] argues that effective climate justice governance requires transparency, civic participation, institutional trust, and democratic accountability as foundational conditions, not optional supplements.
Transport Poverty and the Just Transition
Transport poverty-defined as the condition in which households cannot access the mobility required to participate in essential social and economic activities-has emerged as a central concept in the climate justice literature [9,12]. Transport poverty is not reducible to affordability: it encompasses physical accessibility, route coverage, service frequency, and safety [10]. The European Commission’s (2024) systematic review across EU member states identifies transport poverty as an increasingly significant dimension of energy and climate justice policy, particularly as carbon pricing mechanisms (e.g., ETS2) risk disproportionately burdening low-income and car-dependent households without compensatory transit investment.
The ‘just transition’ literature [4,8] demands that the decarbonization of transport not merely replace fossil-fuel infrastructure with low-carbon equivalents, but actively redress existing mobility inequalities. This implies that the sequencing and targeting of investment matter: transit electrification in environmentally burdened neighbourhoods should precede private vehicle subsidies that concentrate benefits among the already-mobile.
Active Mobility: Walking and Cycling - Potential and Limits
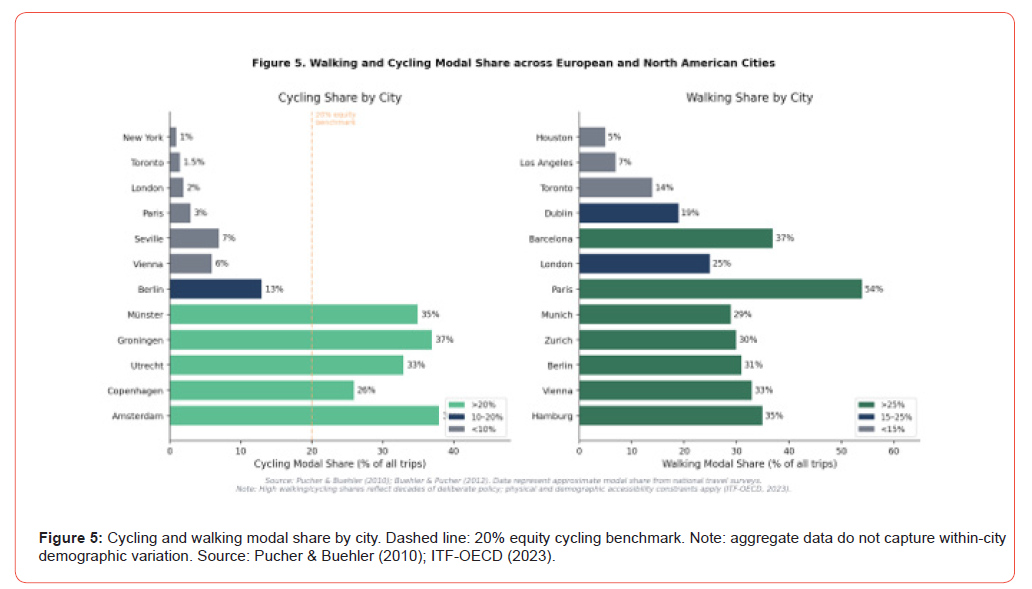
Walking and cycling produce zero direct GHG emissions and carry well-documented co-benefits for public health, urban air quality, and traffic safety [13,6]. European cities demonstrate that high modal shares are policy-achievable: Amsterdam reaches 38% cycling modal share; Copenhagen, 26%; Groningen, 37% (Figure 5). These outcomes reflect decades of sustained investment in separated infrastructure, traffic calming, land use integration, and public education [1].
However, it is important to qualify broad claims about the equity of active transport. Walking and cycling are potentially among the most equitable transport modes when safe, accessible, and inclusive infrastructure is provided-but this condition is not universally met, and several boundary conditions limit universal applicability. The ITF-OECD (2023) documents a persistent gender gap in cycling safety perception, with women significantly more likely than men to avoid cycling due to inadequate infrastructure, poor lighting, and risk of harassment. People with physical, sensory, or cognitive disabilities may find standard pedestrian and cycling infrastructure inaccessible without explicit design adaptation [14,15]. Older adults may face physical capacity constraints that limit active travel, though e-bikes and adapted cycles can significantly expand access [16]. Finally, active transport presupposes manageable distances and favorable land use patterns; residents of sprawling peripheral neighbourhoods with no nearby services or employment nodes cannot realistically substitute active modes for longer trips. In poorly planned or under-invested environments, the ‘equity’ of active transport is contingent rather than inherent.
Public Transit: Equity Backbone and Decarbonization Lever
Public transit serves disproportionately higher shares of low-income, elderly, and minority riders, making it structurally central to any equitable transport policy [17,10]. The Oakland electrification framework [7] demonstrates that mapping hyper-local air quality data against sociodemographic indicators can systematically identify bus routes where fleet electrification produces maximum equity and climate co-benefits. For OECD cities in 2023–2024, electric bus deployment costs continue to fall, and IEA (2024) projects that total cost of ownership parity with diesel will be reached in major markets before 2030-strengthening the investment case for transit electrification as a near-term priority.
Electric Vehicles: The Double Justice Gap
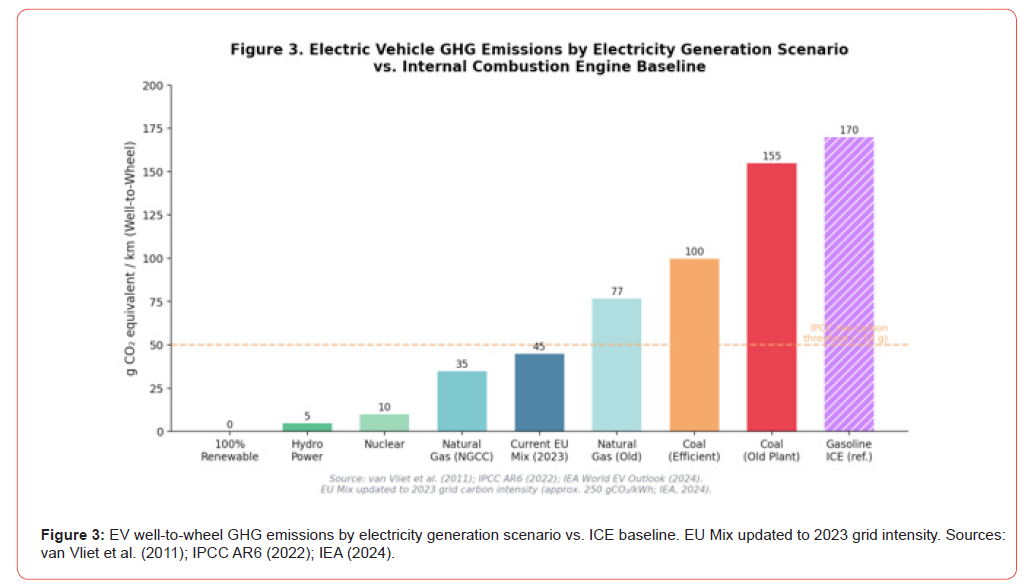
EV adoption has accelerated globally, with IEA (2024) reporting over 18 million new EV registrations globally in 2023. However, the distributional equity record of EV policy remains problematic. Three structurally intersecting barriers define what this paper terms the ‘double justice gap’ in EV policy. First, the climate effectiveness of EVs is entirely dependent on the electricity generation mix: IPCC AR6 (2022) and van Vliet et al [18] together establish a range from 0 g/km (full renewables) to 155 g/km (old coal plant), compared to 130-190 g/km for ICE vehicles. In fossil-heavy grid contexts, EV promotion yields marginal or no climate benefit. Second, EV incentives disproportionately benefit higher-income households: Borenstein & Davis (2016) document that in the US, the top income quintile captures over 90% of EV tax credits. Barajas et al [19] document systematic under provision of public charging infrastructure in low-income and BIPOC neighbourhoods-a structural barrier compounding the financial one. Third, multi-unit dwelling residents, who are statistically more likely to be renters and lower- income, face home charging barriers that further limit EV access [20,12]. The Inflation Reduction Act’s point-of-sale credit transfer mechanism represents a meaningful reform, but analysts note that structural barriers remain for the lowest-income households [20].
Methodology
Framework Overview and Article Type
This paper is classified as a conceptual-computational framework paper following the typology of Soria-Lara & Valenzuela-Montes [21], who distinguish between empirical comparative studies (requiring primary data collection), systematic reviews (requiring exhaustive literature search protocols), and analytical framework papers (which synthesize established evidence into structured, replicable evaluation tools). The MCDA framework developed here is reproducible-any researcher with access to the cited data sources and the rubric definitions provided below can replicate and extend the analysis. The scoring is grounded in peer-reviewed literature; it does not claim to substitute for empirical primary data collection but rather to structure and make transparent the comparative judgments that transport policy decisions implicitly require.
MCDA Criteria and Scoring Rubric
The analysis evaluates four transport modes across four criteria. Modes are: (1) Walking and Cycling (WC), representing the active transport category; (2) Public Transit (PT), combining bus and rail; (3) Electric Vehicles (EV), representing private vehicle electrification under a realistic near-term mixed grid; and (4) Combined Policy Mix (CM), representing integrated transit electrification plus walking/cycling infrastructure investment.
Criteria are scored on a 1–5 integer scale using the rubric defined in Table 2. The rubric Table 2 assigns thresholds for each criterion anchored in specific literature benchmarks. Scores reflect modal performance under current OECD urban policy conditions- not idealized scenarios-with literature citations supporting each assignment.
Table:1MCDA Scoring Rubric: Criteria Definitions and Score Thresholds.
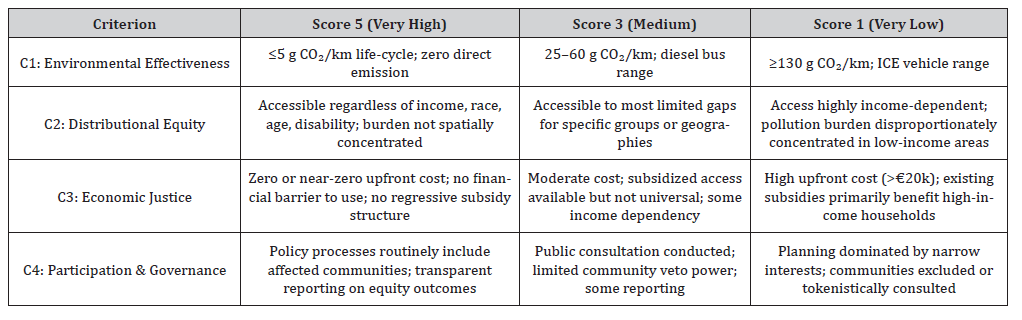
Note: Rubric anchored in the following sources - C1: IPCC AR6 WGIII [6]; van Vliet [18]; Pucher & Buehler [18]. C2: Ku et al. [7]; Mattioli et al. [9]; Barajas et al. [19]. C3: Borenstein & Davis [22]; IEA [20]; European Commission [12]. C4: Twaddell et al. [23]; Sarıkoç Yıldırım [11]; Schlosberg [3]. EV scores reflect near-term mixed-grid context (natural gas dominant).
Table:2MCDA Raw Scores (1–5), Normalized Values, and Composite Scores by Weighting Scenario.

Normalization formula: Normalized score = (raw score − 1) / (5 − 1). Scale range is fixed at min=1, max=5 per criterion, consistent across all modes.
Weighting Scenarios and Composite Score Calculation
Composite scores are calculated (Table 3) as the weighted sum of normalized scores: Composite = Σ (wᵢ × Normalized Cᵢ), where wᵢ are criterion weights summing to 1.0. Three weighting scenarios are evaluated to assess sensitivity to the choice of weights:
Scenario S1 (Equal Weights): wC1 = wC2 = wC3 = wC4 = 0.25. This scenario assumes no a priori preference among criteria and serves as the baseline for the quadrant analysis in Figure 6.
Scenario S2 (Climate-Priority): wC1 = 0.50, wC2 = 0.20, wC3 = 0.15, wC4 = 0.15. This scenario reflects a policy context where GHG reduction is the primary objective, consistent with national net-zero commitments.
Scenario S3 (Equity-Priority): wC1 = 0.15, wC2 = 0.40, wC3 = 0.30, wC4 = 0.15. This scenario reflects a policy context where distributional equity and economic justice are primary objectives, consistent with transport poverty frameworks (Mattioli et al., 2022; European Commission, 2024).
Table:3Composite Scores and Rankings under Three Weighting Scenarios.

Composite = Σ(wᵢ × normalized_Cᵢ). S1 weights: [0.25, 0.25, 0.25, 0.25]; S2: [0.50, 0.20, 0.15, 0.15]; S3: [0.15, 0.40, 0.30, 0.15]. Note: Walking & Cycling and Combined Policy Mix are tied at S1=0.875 and S2=0.913; ranked jointly 1st under S1 and S2, differentiated under S3 where equity weighting separates them.
Quadrant Analysis: Transparent Coordinate Derivation
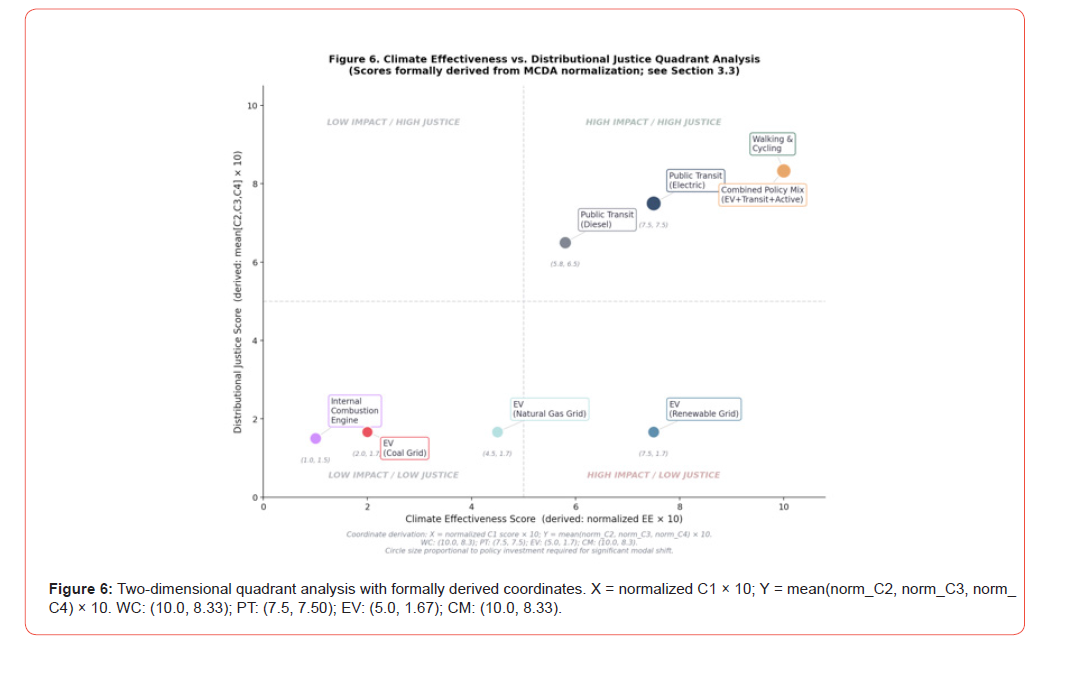
The quadrant analysis Table 4 and Figure 6 positions each mode on two composite axes derived mathematically from the MCDA normalized scores:
Climate Effectiveness Score (X-axis, 0–10) = Normalized_C1 × 10. This directly maps the environmental effectiveness criterion to the x-axis, scaled to a 0–10 range for visual legibility.
Distributional Justice Score (Y-axis, 0–10) = meana(Normalized_ C2, Normalized_C3, Normalized_C4) × 10. This averages the three justice-related criteria (equity, economic justice, governance) and scales to 0–10.
Table:5Quadrant Coordinates: Formally Derived from MCDA Normalized Scores.

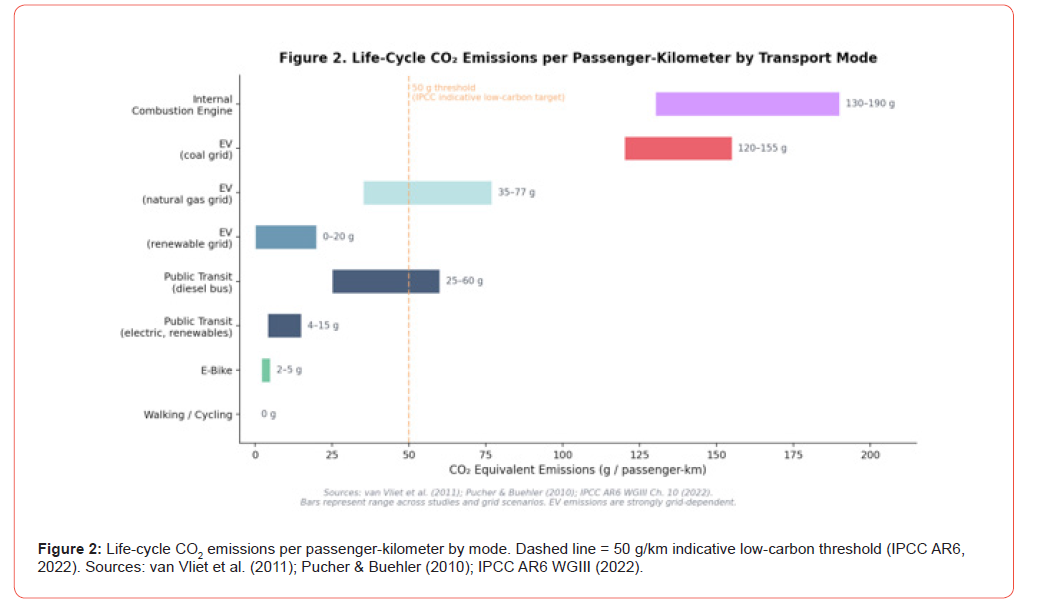
EV sub-scenarios in Figure 6 (renewable grid, natural gas grid, coal grid) are plotted with the same Justice Score (Y = 1.67) but different Climate Effectiveness scores derived from CO₂ emission data Figure 2: EV-renewable=7.5, EV-gas=4.5, EV-coal=2.0. Public Transit diesel variant: Y derived from adjusted C2 score (6.5), reflecting lower climate effectiveness but retained high equity score. ICE vehicle: X=1.0, Y=1.5.
Sensitivity Analysis
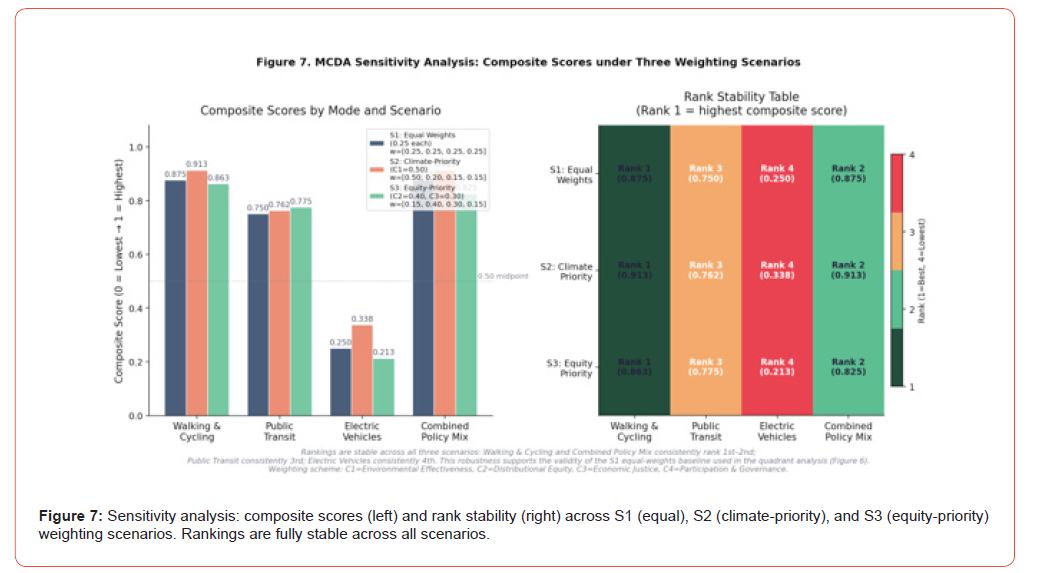
Sensitivity analysis tests whether the ranking of modes is stable across the three weighting scenarios. A result is considered robust if the same mode maintains its relative position (rank 1st or last) across all scenarios. As shown in Table 4 and Figure 7, the ranking is fully stable: Walking and Cycling and Combined Policy Mix jointly occupy the top positions in all three scenarios; Electric Vehicles rank last in all three; Public Transit consistently ranks third. This robustness demonstrates that the primary finding-that active transport and integrated policy mixes outperform EV promotion on climate justice grounds-does not depend on subjective weighting choices.
Results and Discussion
Results and Discussion
Figure 1 positions transportation within the global GHG landscape. Transport accounts for approximately 16% of global GHG emissions (IPCC, 2022), with road transport representing 72% of the sector total. Per IPCC AR6 (2022), the transport sector is among the most resistant to decarbonization: while electricity sector emissions fell substantially in OECD countries between 2010 and 2022, transport sector emissions remained broadly flat or grew. This structural persistence reflects the depth of automobile-centric built environments that constrain individual behavior choices and require systemic policy responses.
Mode Emission Profiles
Figure 2 presents life-cycle CO₂ emission ranges per passenger- kilometer, updated with IPCC AR6 (2022) benchmarks. The data confirm walking and cycling at zero direct emission and EV emissions varying from 0 g/km (full renewables) to 155 g/km (old coal grid). Critically, the EU average grid carbon intensity in 2023 was approximately 250 gCO₂/kWh (IEA, 2024), placing EV emissions in the 40–55 g/km range for average European driving-only marginally below the 50 g/km threshold and declining as grids decarbonize. In coal-dependent contexts (Poland, Turkey, Australia, parts of South and Southeast Asia), EVs offer minimal climate benefit over diesel equivalents.
EV Grid Dependency
Figure 3 isolates the electricity scenario dependency of EV emissions. The EU current mix bar reflects the 2023 grid carbon intensity (IEA, 2024) rather than older projections. The finding that EV emissions cross the 50 g/km threshold only under renewable or nuclear-dominated grids implies that in fossil-heavy national contexts, EV subsidies function as expensive low-climate-benefit interventions, compounding the ‘double justice gap’ when they simultaneously fail on equity grounds.
MCDA Results: Formal Rubric-Derived Scores
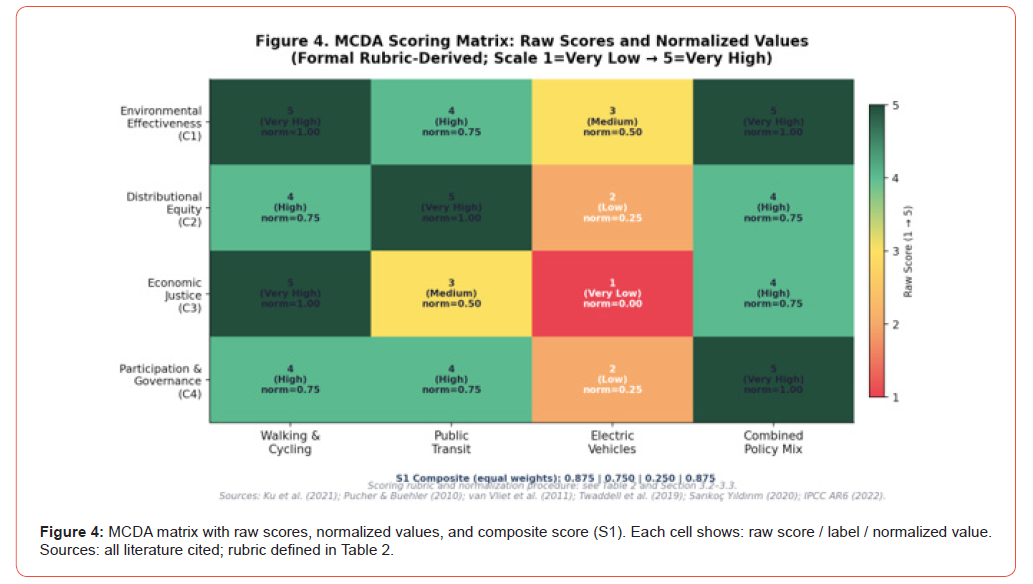
Figure 4 presents the MCDA scoring matrix with raw scores (1- 5), normalized values, and composite score annotations derived per Section 3.2–3.3. Walking and Cycling scores 5/5 on Environmental Effectiveness (C1) and Economic Justice (C3), reflecting zero-emission travel at zero cost-but 4/5 on Distributional Equity (C2), not 5/5, explicitly acknowledging the documented barriers for elderly, disabled, and women in unsafe environments (ITF-OECD, 2023; Section 2.3 above). Public Transit scores 5/5 on C2, reflecting its role as the primary mode for transit-dependent populations, but 3/5 on C3 (Economic Justice) due to fare costs and service gaps. EVs score 3/5 on C1 (medium climate benefit under mixed grid), 2/5 on C2 (documented charging infrastructure and subsidy disparities), 1/5 on C3 (highest upfront cost barrier), and 2/5 on C4 (planning processes not community-led).
Active Transport Modal Share: Evidence and Context
Figure 5 documents achievable cycling and walking modal shares across European and North American cities. The evidence confirms that high active transport shares are policy-outcomes, not cultural accidents. However, Figure 5 should be read in conjunction with the equity qualifications in Section 2.3: modal share data aggregate across the full population and do not capture differential rates by age, gender, disability, or income. Future research integrating disaggregated modal share data by demographic group would substantially strengthen this evidence base-a limitation of current data availability rather than of the analytical framework.
Quadrant Analysis: Transparent Policy Space
Figure 5 documents achievable cycling and walking modal shares across European and North American cities. The evidence confirms that high active transport shares are policy-outcomes, not cultural accidents. However, Figure 5 should be read in conjunction with the equity qualifications in Section 2.3: modal share data aggregate across the full population and do not capture differential rates by age, gender, disability, or income. Future research integrating disaggregated modal share data by demographic group would substantially strengthen this evidence base-a limitation of current data availability rather than of the analytical framework.
EVs as a category (5.0, 1.67) occupy the mid-right, low-justice zone. The three EV sub-scenarios (renewable, gas, coal) share the same justice score (Y = 1.67) but diverge on climate effectiveness: EV-renewable (7.5) is competitive with public transit; EV-gas (4.5) falls to the moderate zone; EV-coal (2.0) approaches the low-impact quadrant. ICE vehicles and coal-grid EVs occupy the lower-left corner. This spatial distribution makes the policy hierarchy explicit and numerically grounded: upper-right modes (WC, CM, PT-electric) should be prioritized; lower-right modes (EV-gas, EV-coal) require policy redesign before claiming a justice rationale.
Sensitivity Analysis: Ranking Stability
Figure 7 presents the sensitivity analysis across three weighting scenarios. The grouped bar chart (left panel) shows composite scores by mode and scenario; the rank stability table (right panel) confirms that rankings are fully stable: Walking and Cycling and the Combined Policy Mix share first position under S1 (0.875 each) and S2 (0.913 each); under S3 (equity-prioritized weights), Walking and Cycling marginally leads (S3=0.863) over the Combined Policy Mix (S3=0.825). Public Transit ranks third in all scenarios. Electric Vehicles rank last in all three (S1=0.250, S2=0.338, S3=0.213). This robustness is a methodologically significant result: the primary policy conclusions of this paper do not depend on any particular subjective weighting choice. Researchers or policymakers who assign substantially higher importance to climate effectiveness, distributional equity, or economic justice all arrive at the same fundamental ordering.
Policy Recommendations
The following recommendations are directly grounded in the MCDA and quadrant analysis results. Each recommendation identifies the quantitative finding that supports it.
Tier 1 - Inclusive Active Transport Infrastructure
The highest composite score across all scenarios (S1 = 0.875; S2 = 0.913; S3 = 0.863) corresponds to Walking and Cycling-but only when infrastructure is safe, accessible, and inclusive (Section 2.3). Policy implication: investment in active transport infrastructure must be accompanied by explicit equity targeting, including: gender-sensitive design standards (adequate lighting, separated tracks, sight-line maintenance); Universal Design standards ensuring accessibility for mobility device users; targeted investment in low-income and high-pedestrian-fatality neighbourhoods identified through equity analysis Twaddell [23]; and subsidized or free bike-share for low-income residents. The C2 raw score of 4 (not 5) explicitly reflects that these conditions are not yet universally met in most OECD cities-achieving a C2 score of 5 is a policy target, not a starting assumption.
Tier 2 - Targeted Transit Electrification
Public Transit achieves the highest Distributional Equity (C2) raw score of 5, reflecting its structural role as the primary mode for transit-dependent populations. The gap between its S1 composite (0.750) and the active transport composite (0.875) is primarily driven by its lower scores on Economic Justice (C3 = 3) and Environmental Effectiveness (C1 = 4). Both gaps are addressable through policy: transit electrification improves C1 from 4 toward 5 (EV bus life-cycle emissions: 4-15 g/km); fare reduction or free transit improves C3. Investment decisions should be guided by the Oakland framework methodology (Ku et al., 2021): spatially resolved air quality and sociodemographic data to identify routes where electrification yields maximum combined climate and equity benefit.
Tier 3 - Fundamental EV Policy Redesign
The EV composite score of 0.250 (S1)-the lowest of all modesis driven by C3 = 1 (highest upfront cost, regressive subsidy structure) and C2 = 2 (charging infrastructure deficit in low-income neighbourhoods). These scores reflect current policy conditions, not technological limits. Policy redesign should target these specific deficit dimensions: (a) Restructure subsidies as point-of-sale rebates covering used as well as new EVs, accessible regardless of tax liability, to improve C3 toward 3. (b) Direct public charging infrastructure investment through equity-mapping tools (Barajas et al., 2023), targeting low-income neighbourhoods, public housing, and transit corridors, to improve C2 toward 3. (c) Sequence transit electrification (Tier 2) before private vehicle subsidy programs in any equity-informed budget allocation. Grid decarbonization policy, while outside transport departments’ direct control, is a necessary condition for achieving climate effectiveness (C1) scores above 3 for EVs.
Tier 4 - Combined Policy Mix as Long-Term Target
The Combined Policy Mix achieves the maximum climate effectiveness score (X = 10.0) and high justice score (Y = 8.33), tied with Walking and Cycling in S1 and S2 scenarios. Its superior performance over individual modes reflects systemic complementarity: transit electrification extends climate-just mobility to trip distances beyond active transport range; active transport infrastructure addresses the first- and last-mile gap that limits transit ridership. The policy implication is that neither mode substitutes for the other: achieving a CM-level outcome requires concurrent, coordinated investment rather than sequential prioritization.
Participatory Governance: The Institutional Prerequisite
Governance scores (C4) range from 5 for the Combined Policy Mix to 2 for EV-focused policy, reflecting the degree to which each mode’s associated planning processes currently include affected communities. Improving the C4 score across all modes requires: annual public climate and transportation forums conducted in accessible formats and languages; community advisory bodies with genuine investment-allocation authority; mandatory public reporting on distributional outcomes disaggregated by income, race, age, and disability status [3,11]; and independent audit of whether active transport and transit investments reach intended beneficiaries.
Limitations and Future Research
This paper has four principal limitations that define its scope and motivate future research. First, the analysis is limited to OECD urban contexts, specifically European and North American cities for which comparable modal share, emission, and equity data are available. The rubric thresholds and weight scenarios are calibrated to these contexts. Application to lower-income countries, rapidly urbanizing cities in South Asia, Sub-Saharan Africa, or Latin America requires re-calibration of the rubric to local conditions: different grid carbon intensities, different baseline transit coverage, and different distributional baselines for income inequality [10]. The framework structure is transferable; the specific scores are not.
Second, the MCDA scores for C2 (Distributional Equity), C3 (Economic Justice), and C4 (Participation and Governance) rely on qualitative literature synthesis applied through a structured rubric rather than primary data collection. This is appropriate for a conceptual framework paper, but introduces inherent subjectivity even when rubric-anchored. Future research could strengthen the empirical basis by operationalizing each criterion through measurable indicators: C2 via spatial Gini coefficients for infrastructure access; C3 via household expenditure survey data on transport cost burden; C4 via structured assessment of planning process documentation [24-27].
Third, the analysis is cross-sectional and does not model temporal dynamics. The climate effectiveness of EVs, in particular, is changing rapidly as grids decarbonize: a mode that scores C1 = 3 today may score C1 = 4 or 5 within a decade if renewable energy reaches projected shares. Future research using scenario-based dynamic MCDA-updating rubric scores under projected grid futures- would provide more policy-actionable insight.
Fourth, active transport modal share data in Figure 5 are aggregated across the full city population and do not capture intra-city variation by demographic group. Disaggregated modal share data by income quintile, age group, gender, and disability status would substantially strengthen the equity analysis and allow rubric scores to be empirically validated against observed distributional outcomes.
Conclusion
This paper has developed and applied a formal Multi-Criteria Decision Analysis framework for evaluating urban transport modes against climate justice objectives. Through a structured scoring rubric, min–max normalization, three-scenario sensitivity analysis, and formally derived quadrant analysis, it demonstrates that rankings of transport modes on combined climate-justice grounds are robust, not dependent on arbitrary scoring choices. Walking and cycling, when supported by safe and inclusive infrastructure, and integrated policy mixes of transit electrification plus active transport investment, consistently occupy the highest positions across all weighting scenarios. Electric vehicles, under current policy structures and realistic grid conditions, consistently rank last-exhibiting a ‘double justice gap’ of limited climate benefit in fossil-heavy grids and regressive distributional outcomes from existing incentive structures.
The paper makes three original contributions relative to prior work in this domain. First, it brings methodological rigor to a comparison that transport justice literature has often made in qualitative terms, providing a replicable scoring procedure with documented rubric thresholds. Second, it introduces formal sensitivity analysis to demonstrate that policy conclusions are robust across reasonable variation in weighting assumptions. Third, it provides a limitations section that explicitly bounds the framework’s scope to OECD urban contexts and identifies the primary empirical gaps that future research should address.
The framework is designed to be adaptable. Researchers working in Global South contexts, in rapidly urbanizing regions, or on specific modal policy questions can apply the same rubric structure with re-calibrated thresholds. Planners can use the MCDA matrix and quadrant analysis as a structured tool for communicating trade-offs to decision-makers and communities. The fundamental argument of the paper remains: in transport policy, climate effectiveness and distributional justice are not competing objectives but mutually reinforcing ones when investments are correctly targeted.
Acknowledgements
None.
Conflict of interest
No conflict of interest.
References
- Rawls J (1971) A Theory of Justice. Harvard University Press.
- Sen A (1999) Development as Freedom. Anchor Books.
- Schlosberg D (2004) Reconceiving environmental justice: Global movements and political theories. Environmental Politics 13(3): 517-540.
- Sheller M (2022) Mobility Justice: The Politics of Movement in an Age of Extremes (2nd). Verso Books.
- Albuquerque FDB, Maraqa MA, Chowdhury R, Mauga T, Alzard M (2020) Greenhouse gas emissions associated with road transport projects: current status, benchmarking, and assessment tools. Transportation Research Procedia 48: 2018-2030.
- IPCC (2022) Climate Change 2022: Mitigation of Climate Change. Contribution of Working Group III to the Sixth Assessment Report of the IPCC (Chapter 10: Transport). Cambridge University Press.
- Ku A, Kammen DM, Castellanos S (2021) A quantitative, equitable framework for urban transportation electrification: Oakland, California as a mobility model of climate justice. Sustainable Cities and Society 74: 103179.
- Bullard RD, Johnson GS, Torres AO (Eds.). (2004) Highway Robbery: Transportation Racism and New Routes to Equity. South End Press.
- Mattioli G, Roberts C, Steinberger JK, Brown A (2022) The political economy of car dependence: A system of provision approach. Energy Research & Social Science 66: 101486.
- Lucas K, Mattioli G, Verlinghieri E, Guzman A (2022) Transport poverty and its adverse social consequences. Transport Policy 115: 78-88.
- Sarıkoç Yıldırım B (2020) Climate justice at the local level: Principles, institutions, and democratic governance (Doctoral thesis). Graduate School of Social Sciences.
- European Commission (2024) Transport Poverty in the EU: A Systematic Review of Definitions, Indicators, and Mitigation Strategies. Directorate-General for Mobility and Transport, Brussels.
- Pucher J, Buehler R (2010) Walking and cycling for healthy cities. Built Environment 36(4): 391-414.
- ITF-OECD (2023) Safe Cycling: A Policy Framework for Urban Cycling Safety and Gender-Sensitive Infrastructure. International Transport Forum, Paris.
- European Commission (2022) Sustainable Urban Mobility Plans: Inclusive Mobility Guidelines. Publications Office of the EU.
- Laakso S (2017) Giving up cars: The impact of a mobility experiment on carbon emissions and everyday routines. Journal of Cleaner Production 169: 135-142.
- TriMet (2010) Environmental Justice and Transit Equity Analysis. TriMet, Portland, Oregon.
- Van Vliet O, Brouwer AS, Kuramochi T, van den Broek M, Faaij A (2011) Energy use, cost and CO₂ emissions of electric cars. Journal of Power Sources 196(4): 2298-2310.
- Barajas JM, Braun L, Brown A (2023) Uneven access: Mapping EV charging infrastructure disparities in low-income and minority communities in the United States. Transport Policy 130: 86-97.
- IEA (2024) World EV Outlook 2024. International Energy Agency, Paris.
- Soria-Lara JA, Valenzuela-Montes LM (2022) Analysing multi-criteria transport sustainability: A systematic framework for evidence-based decision-making. Cities 120: 103452.
- Borenstein S, Davis LW (2016) The distributional effects of US clean energy tax credits. Tax Policy and the Economy 30(1): 191-234.
- Twaddell H, Zgoda B, Aimen D, Morris A (2019) Environmental Justice Analysis in Transportation Planning and Programming: State of the Practice (FHWA-HEP-19-022). Federal Highway Administration, U.S. Department of Transportation.
- Anderson E (1999) What is the point of equality? Ethics 109(2): 287-337.
- Buehler R, Pucher J (2012) Cycling to work in 90 large American cities: new evidence on the role of bike paths and lanes. Transportation 39(2): 409-432.
- Vergis S, Scott A (2022) Distributional equity in electric vehicle policy: A systematic review of subsidy incidence and access barriers. Energy Research & Social Science 87: 102462.
- Yang Z, Wang C, Ye Y (2020) Climate change research on transportation systems: Climate risks, adaptation and planning. Transportation Research Part D: Transport and Environment 88: 102553.
-

This work is licensed under a Creative Commons Attribution-NonCommercial 4.0 International License.