 Research Article
Carbonation Processing and Characterization of Fly Ash-Portlandite Blends as Cement-Free Binding Agents
Hussam Alghamdi1, Aashay Arora2, Emily Ford2 and Narayanan Neithalath2*
1Civil Engineering Department, College of Engineering, King Saud University, Riyadh, Saudi Arabia
2School of Sustainable Engineering and Built Environment, Arizona State University, USA
Narayanan Neithalath, School of Sustainable Engineering and Built Environment, Global Institute of Sustainability, Arizona State University, Tempe AZ 85287, USA.
Received Date: August 16, 2021; Published Date: September 20, 2021
Abstract
Carbonation of fly ash mortars augmented with portlandite (CH) under ambient conditions to produce cement-free binding agents that sequester CO2 is discussed. Fly ash-CH blends are proportioned to produce shape-stable mixtures that can be conventionally cast or extruded. The strength and CO2 uptake are noted to strongly depend on specimen saturation. High-Ca fly ash blended with 10% CH (by mass) results in a 7-day compressive strength of more than 35 MPa when carbonated, which is ~40% higher than that of the conventionally cured mixture, and a CO2 uptake of ~8% by mass of the binder. Low-Ca fly ash blended with 30% CH results in 15 MPa strength, which is 3 times higher than that of the conventionally cured mixture, and a CO2 uptake of ~16% by mass of the binder. The proportion of initial voids that remain after carbonation or conventional curing, which scales well with compressive strength, is shown to be a convenient measure to quantify the relative efficiency of carbonation. Thermal analysis, electron micrographs and X-ray maps, and FTIR spectroscopy confirm the carbonation efficiency of the mixtures. The beneficial effects of low w/p and particle packing in extrudable mixtures towards providing increased strengths and CO2 uptake are also brought out. Overall, this study establishes the applicability (in terms of strength) of portlandite-enriched fly ashes to form binding agents with significantly lower CO2 footprint for several construction applications.
Introduction
Efforts to reduce the CO2 footprint of construction materials, especially concrete, are vital from a climate-and-sustainability viewpoint. It is well accepted that one ton of ordinary portland cement (OPC) production emits ~0.8 tons of CO2, mostly from calcination of limestone [1]. While the use of a host of cement replacement materials of lower environmental impact definitely aids to reduce the amount OPC used in concrete construction (for e.g., the global average clinker ratio is estimated to be 0.65 [2]), they do not provide a means to sequester the CO2 emitted. Moreover, the extent of utilization of solid waste materials such as fly ash in concrete also is limited due to: (i) improved coal processing methods that make many fly ashes non-compliant (e.g., as per ASTM C 618) because of the presence of impurities like unburnt carbon, and (ii) adverse effects on concrete property development, especially when higher volumes of fly ash are used. The International Energy Agency estimates the average global utilization factor of fly ash to be less than 0.20 [3]. Hence, in order to increase the utilization of fly ash in cementitious applications, and at the same time sequester CO2, carbonation-aided cementation emerges as a promising route [4]. Such cementitious binders can be net carbon-negative (depending on the nature of reactants used) owing to the sequestration of CO2 from a process-related emission stream, and the reduction in CO2 emitted as a result of reduction in OPC production and use. The use of alkaline waste materials (e.g., fly ash) for mineral carbonation (reaction of alkali or alkaline earth metal oxides to form thermodynamically stable carbonates) has received considerable attention [5,6]. Direct mineral carbonation relies on the single-step reaction of metal oxides or silicates with CO2. Several studies have examined the gas-solid route or aqueous route of fly ash carbonation [7–10]. The influence of operating parameters (e.g., temperature, CO2 concentration and pressure, solid-to-liquid ratio, reaction time) on the carbonation efficiency of fly ashes have been elucidated in detail [11–14]. Previous work has reported that CO2 sequestration by fly ashes under gas-solid reaction conditions requires higher temperature and pressure, and can be accelerated through steam addition [10,11,15]. In aqueous medium, under high solid-to-liquid ratios and enhanced temperatures, fly ashes have been shown to sequester up to 20% of CO2 by mass [7,16], though realistic values are much smaller; of the order of 5-10% [6,17]. However, such efforts are not beneficial towards creating value-added construction materials because of the impractical operating conditions (temperature and pressure) or the use of high liquid contents. The focus of this work, therefore, is to tailor the ingredients and processing conditions for fly ash carbonation in such a way that cementitious binders with mechanical properties appropriate for many concrete applications can be fabricated.
While fly ashes contain varying amounts of CaO (and are classified as Class C or Class F in ASTM C 618 according to its Ca content), the Ca present is not all mobile, resulting in substantially less carbonation than predicted from their chemical composition. Fly ashes rich in Ca have been shown to produce carbonated binders with adequate strength under elevated temperatures [18], whereas Ca-poor fly ashes require additives (such as OPC and portlandite) to produce moderately strong carbonated binders [19]. In this work, both high-Ca and low-Ca fly ashes are augmented with portlandite (Ca (OH)2 or CH) to form OPC-free binders. Portlandite is used as an additive since it has a very high potential CO2 uptake (0.59 g CO2 per g of CH at reaction completion), the precursor for its manufacture abundantly available, and its production, less energy intensive than OPC [17,20]. The mixture proportions are designed in such a way that shape-stable specimens can be conventionally cast or extruded. The rheological characteristics of the fly ash-CH mixtures amenable to different types of processing, the influence of specimen saturation on the strength and CO2 uptake, and the microstructural features of the carbonated fly ash binders are examined.
Experimental Program
Materials and mixtures
A Class C (Ca-rich) and a Class F (Ca-poor) fly ash, both conforming to ASTM C 618 were used as the starting materials in this work. The median particle sizes (d50) of the Class C and F fly ashes were 10.8 μm and 8.9 μm respectively, as measured using dynamic light scattering. The oxide compositions of the fly ashes and their specific gravities measured using a pycnometer are provided in Table 1. The portlandite used contains >99% calcium hydroxide (CH) and had a specific gravity of 2.33. The median particle size of portlandite is around 3.8 μm (Table 1).

Class C fly ash-based binders were proportioned with 5, 10, or 15% of portlandite (by mass) whereas Class F fly ash-based binders were proportioned with 10, 20, 30, or 40% of portlandite (by mass). Both paste and mortar mixtures were designed. The mortar mixtures contained 50% of fine silica (SiO2) sand (d50 of 0.2 mm; specific gravity of 2.40) by volume. The Class C fly ash mixtures demonstrated rapid setting (~2-4 minutes), necessitating the use of a commercially available retarding admixture. Several trial mixtures were produced to optimize the dosage of the retarding admixture to provide initial setting times in the 45-75-minute range. Since shape stability is an important consideration for these mixtures, the water-to-powder ratio (w/p; powder includes fly ash and portlandite) was kept low and a superplasticizer (polycarboxylic ether based) was used to ensure cohesive mixtures. Trial mixtures using several w/p and superplasticizer dosages were cast to evaluate shape stability using a 25 mm diameter x 50 mm long cylinder as shown in Figure 1. Mixtures satisfying shape stability (Figures 1(c) & (f) for Class C and Class F fly ash-based mortars respectively) were arrived at for all portlandite dosages. The extremely fine nature of the portlandite powder and its affinity to water resulted in the need to increase the w/b with increasing portlandite content. In addition to these conventionally cast mortars, two mixtures each based on Class C and Class F fly ash binders were proportioned at reduced w/b to be used for extrusion-based production. Two different compaction pressures (1 MPa and 2 MPa) were used to compact the mixtures before extrusion. A specially designed fixture was used to push the specimens out of the mold immediately after casting. The extruded mortar cubes are shown in Figure 2. The mixture proportions used for conventionally cast and extruded mortars are shown in Table 2. The letters ‘C’ or ‘F’ denote the type of fly ash and the number following it denotes the percentage of portlandite (by mass) in the binder phase. In the first set of conventionally cast and extruded mixtures, the Class C fly ash-based pastes and mortars were kept in a sealed condition after casting, demolded after 24 hours, and subjected to carbonation or moist-curing. The Class F fly ash-based pastes and mortars were subjected to 50°C in an oven for 5 hours immediately after casting since they did not set and harden under ambient conditions. They were then subjected to carbonation or moist curing. A few other time-temperature treatment regimens were also used to determine the influence of initial saturation levels on the progress of carbonation, for the conventionally cast mixtures. In the second set of mixtures, both the Class C and Class F fly ash-based mixtures were kept in an oven at 70°C for 3 h immediately after casting, demolded, and immediately transferred to the carbonation or moist-curing environment. The saturation levels for all the treatment cases were determined using vacuum saturation. The specimens were dried at 105°C to a constant mass and submerged under vacuum to determine the maximum absorption, which corresponds to a saturation level (sw) of 1.0. The mass of water present in the specimens under different treatment regimes, normalized by the maximum absorption is used to obtain the saturation levels. The carbonation environment is described in the next section. Moist curing was carried out at >95% RH and 23±2°C (Figures 1, 2) (Table 2).

As shown in Table 2, the w/p and the admixture dosages required to attain shape-stability differed with fly ash type and CH content.

As shown in Table 2, the w/p and the admixture dosages required to attain shape-stability differed with fly ash type and CH content.
Carbonation process
A small-scale, ambient temperature carbonation set-up was fabricated using a heavy-duty polypropylene container with a snap-fit lid, further sealed with 12.5 mm weather strip sealing. The container was outfitted with two openings – an inlet and an outlet, controlled by valves. A sensor that can measure CO2 concentration, temperature, and relative humidity was installed at the bottom of the lid and connected to a computer running a custom LabVIEW program for data collection. A specimen support system, 60 mm high, made of coated wood (so that it does not absorb any CO2) was fabricated and placed inside the container so that the cube samples can be placed at a distance of about 50 mm from each other. The support system and cube placement ensured maximum exposure of the specimen surface area to CO2. With the lid closed and tightened with clamps, CO2 was let into the chamber with the outlet valve open for a few minutes so that the container is purged of other gases. The outlet valve was then closed, and the chamber filled with CO2. The inlet valve was closed after CO2 concentration reached 100%. It was observed that during the early stages of carbonation, the CO2 concentration in the chamber drops to around ~60% after 24 hours, due to the consumption of CO2 by the specimens (depending on the number and type of specimens – specimens with higher amounts of portlandite absorb more CO2), and minor unidentified leaks. Hence, the chamber was refilled with CO2 every 12 to 18 hours to maintain an average CO2 concentration of ~75%. The specimens were cured under this high CO2 concentration condition for a period of 7 days. A subset of specimens was also subjected to a lower CO2 concentration of ~15% to simulate the effect of using flue gases of low CO2 concentration. The CO2 concentration in the chamber was continuously monitored using the LabVIEW program. The mortar mixtures were used for strength determination whereas corresponding paste mixtures were used to determine the CO2 uptake.
Test methods
Rheological tests: The shear rheological tests on the fly ash-based mixtures were performed using vane shear geometry in a TA AR 2000 EX rheometer. The rheological sequence consisted of: (i) a stepped ramp up pre-shear phase lasting approximately 80 s to homogenize the paste, (ii) a subsequent stepped ramp-up, and (iii) a stepped ramp-down, as shown in Figure 3(a). The data was acquired during only the final ramp-up and ramp-down phases, with only the down-ramp data used to extract the rheological parameters. The data was collected every second at each step (excluding the pre-shear phase), until steady state (defined by three consecutive torque measurements within 5% of each other) was achieved. The time expended at each shear step in which data is collected was typically 5 s. Shear stress and shear rate data were extracted using TA Instruments’ TRIOS software package. The yield stress was extracted based on the shear stress-strain rate (t-(γ)) ̇ relationships observed in a strain rate range of 5-to-100 s-1. The Y-intercept of this relationship was recorded as the Bingham yield stress and the slope as the plastic viscosity (Figure 3).

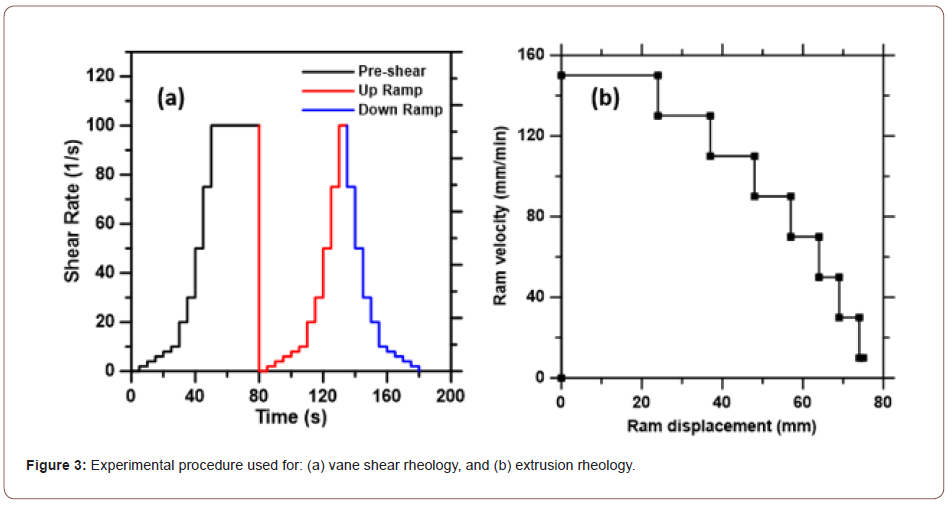
Extrusion (capillary) rheology experiments were carried out on the fly ash-CH mixtures that were used for compaction and extrusion processing. The extruder barrel had a diameter (D) of 36 mm and a length of 100 mm. The length (L) and diameter (d) of the extrusion nozzle (die) were varied between 36 mm and 16 mm, and 4 mm and 8 mm respectively. The barrel of the extruder was filled with the fresh mixture and the plunger was positioned to be in contact with the surface of the mortar filled in the barrel. The extruder assembly was placed in a specially fabricated holder to enable the top of the plunger to be pushed by the top platen of a servo-controlled MTS load frame (4.45 kN maximum load) at predefined velocities. Ram velocities ranging from 140 mm/min to 30 mm/min were used in one experimental run. The ram displacement (and thus, the time) at each velocity was determined from trial mixtures such that stability was ensured in the measured force vs. ram advance relationships. The extrusion velocities corresponding to the ram velocities were obtained by equating the flow rates in the barrel and the die, i.e.,
 where Vram and Vext are the ram and extrusion
velocities respectively. Figure 3(b) shows the procedure adopted
for extrusion rheology. The total pressure P exerted in extruding
the material through a die is given as [21,22]:

P1 is the die entry pressure, which is the pressure required to
force the suspension from the barrel to the die, P2 is the pressure
that enables the flow of paste under pure shear conditions along
the die,  is the velocity-dependent apparent extrusion yield
stress of the plastic material, and
  is the velocity-dependent
wall shear stress experienced by the paste.
Determination of strength and CO2 uptake: The compressive strength of the mortars (both the control samples that were cured in a moist environment and the carbonated samples) were determined in accordance with ASTM C 109 after 1, 3, and 7 days of exposure to respective environments. At least 3 cubes were tested for each mixture at each curing duration. Thermogravimetric analysis (TGA) was used to determine the CO2 uptake of the binders. A PerkinElmer STA 6000 simultaneous thermal analyzer (TGA/DTG/DTA) with a Pyris data acquisition interface was used. A small quantity of powdered paste sample was acquired from the center and midway to the center of the cubes after 7 days of exposure. The tests were performed in an inert N2 environment at a gas flow rate of 20 mL/s. The samples were heated from ambient temperature to 950°C at a heating rate of 10°C /min. The mass loss (TG) and differential mass loss (DTG) patterns were used to quantify the CO2 uptake by determining the mass loss associated with calcium carbonation decomposition (550°C to 900°C). For well-carbonated samples, the mass loss corresponding to samples from both the locations were very similar.
Physical properties, microstructure and FTIR spectroscopy: A gas pycnometer (Ultrapyc 1200e, Quantachrome Instruments) was used to determine the specific gravity and bulk density of the samples. Scanning electron microscopy (SEM) and Energy Dispersive X-ray spectroscopy (EDX) were performed in high vacuum (7- 10 torr) with an accelerating voltage of 15 kV or 30 kV, a working distance of 10 mm, and the sample tilted to 10o to maximize the number of electrons entering the EDX detector. Secondary electron (SE) mode in the SEM was utilized to detect electrons emitted from close to the specimen surface. Once a location and magnification were chosen, spot EDX or EDX chemical maps as desired, were obtained. The electron counts per second was set to 10 kcps and the dwell time was 128μs such that each frame of the 600 x 450-pixel image took ~6 s to scan. Fourier Transform Infrared (FTIR) Spectroscopy was performed on the powdered samples before and after carbonation. A Mattson Genesis FTIR spectroscope configured with an Attenuated Total Reflectance (ATR) attachment was used to obtain the spectra in the wavenumber range of 700 cm-1 to 4000 cm-1. The resolution used was 1cm-1. A 51-point Savitsky Golay-Quintic smoothing window was used to smooth the transmittance vs. wavenumber data.
Results and Discussions
Plastic characteristics of fly ash-portlandite blends
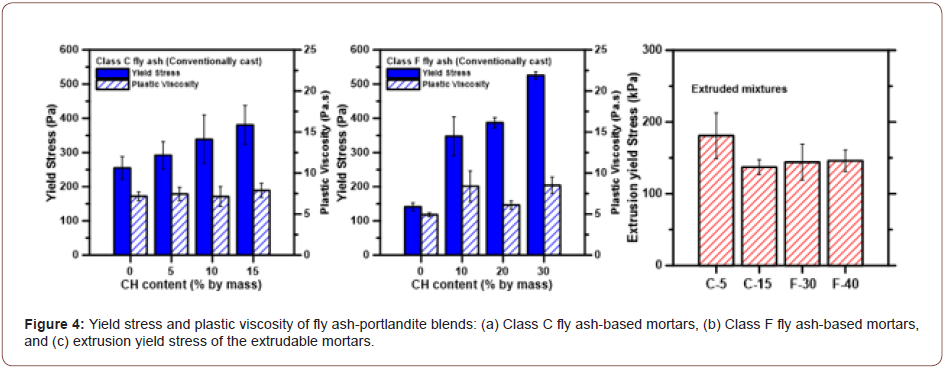
The fresh state performance of fly ash-portlandite blends is important for their casting and fabrication. The Bingham yield stress and plastic viscosity of the fly ash-portlandite blends determined from vane shear rheometry are shown in Figures 4(a) & (b). The Bingham yield stress (τy), which can be related to slump or slump flow [23], is generally considered to depend on the interparticle forces, which in turn are influenced by the particle-scale properties and their packing. The plain Class C fly ash mortar demonstrates a higher yield stress than the Class F fly ash mortar, owing to the differences in w/b used in these mixtures; to ensure shape stability, Class F fly ash mortars required a higher w/b as shown in Table 2. For both the Class C and Class F fly ash-based mortars, the yield stress increases with portlandite content. It also needs to be noted that the w/b also was increased when the portlandite content was increased (see Table 2), and the yield stress increase is evident in spite of the increase in w/b. This is because the decrease in solid volume fraction (see Table 2) was only minimal: from 0.66 at 0% CH to 0.62 at 15% CH for Class C fly ash-based mixtures, and from 0.64 at 0% CH to 0.57 at 30% CH for Class F fly ash-based mixtures. The smaller size of portlandite particles increases the total number of particles in the system and the number of particle contacts, decreases the median particle size of the system, and along with the angular shape of the particles, enhances the dynamic yield stress of suspensions. This observation is consistent with the inverse square of size dependence of yield stress (i.e., τ ∝ ϕ/d2) [24,25], and is more evident for the Class F fly ash-based mixtures where higher amounts of portlandite are used. Shape stability is achieved for all the mortars in the shear yield stress range of 150 to 500 Pa, similar to the results for 3D-printable mortars reported in [26]. The plastic viscosity of all the mortars are in the 5 to 7 Pa.s range.
Extrusion rheology experiments were carried out to characterize the mixtures subjected to compaction and extrusion since these experiments are more suitable for stiffer materials. Note that the w/p was reduced for the mixtures selected for compaction and extrusion mode of processing (Table 2). Using the experimental P vs. L/d relationship for different extrusion velocities, the die entry pressure (P1) is obtained, from which the velocity-dependent extrusion yield stress, is calculated for the extruded mortars, as shown in Figure 4(c). Further details of this procedure can be found elsewhere [25,26]. Extrusion yield stress accounts for deformations suffered by the material in the barrel while being axially compressed, and the shaping effects when the cross-section changes from the barrel to the die entry. Significantly different particle rearrangements result under this imposed stress state as compared to nominal pure shear applied in shear rheometric techniques. This is obvious from a comparison between Figures 4(a) and (b) and Figure 4(c) which show different trends for shear and extrusion yield stresses. The extrusion yield stress for mortars amenable for extrusion is generally reported to be 100 to 500 kPa [27] and the values obtained for the mortars used in this study are within this range. Note that the mixture design resulted in very similar extrusion yield stress for the considered mixtures. Capillary rheology experiments, thus, can be a promising approach to determine the extrudability of such mixtures and can be used for mixture selection and qualification (Figure 4).
Strength and CO2 uptake of conventionally cast mixtures
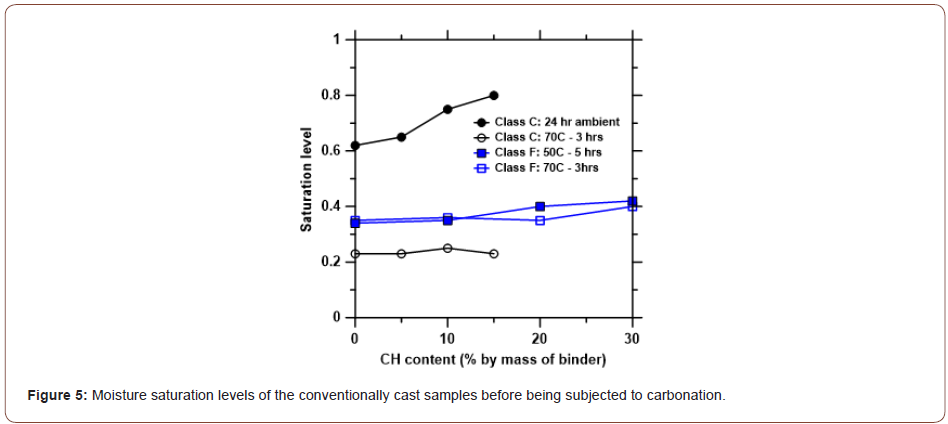
Saturation levels: Figure 5 shows the moisture saturation levels, sw, for the conventionally cast fly ash-portlandite blends before they were subjected to carbonation. For the Class C fly ash-based blends cured under ambient conditions for 24 h before carbonation, sw increases with CH content, commensurate with the increase in w/b that was required to fabricate shape stable mixtures shown in Figure 1. For both Class C and Class F fly ashbased blends subjected to a higher temperature for a specified time period, sw is relatively independent of the portlandite content. The sw values for the Class F fly ash mixtures are higher than those of Class C fly ash mixtures subjected to the same treatment regime. This can be attributed to the higher w/p ratios used in fabricating the Class F fly ash mixtures, as well as the possibility that some of the water in the Class C fly ash-CH blends would have turned into bound water because of the improved cementitious and pozzolanic activity of Class C fly ash at elevated temperatures (Figure 5).
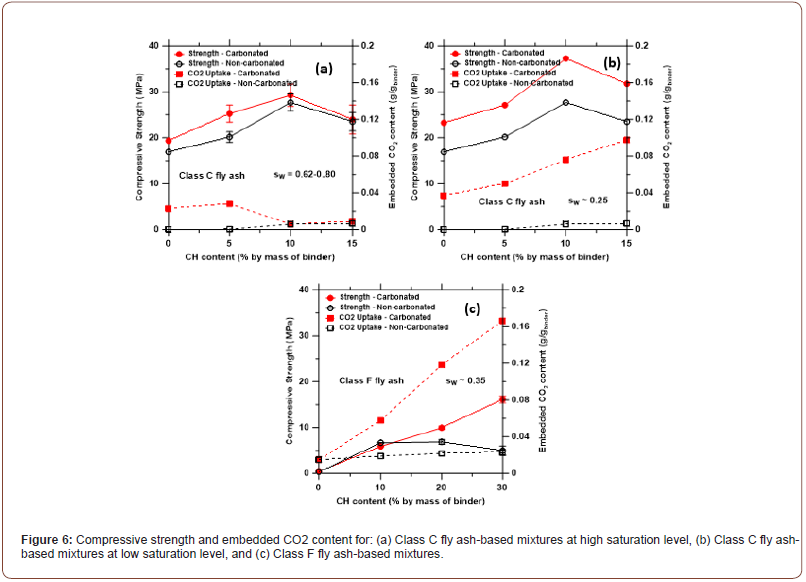
Exposure to high CO2 concentration: Influence of saturation levels: Class C fly ash mortars (sw ~ 0.62-0.80): Figure 6(a) shows the 7-day compressive strengths and the incorporated CO2 contents of the conventionally cast Class C fly ash-portlandite mortars subjected to high CO2 concentrations (~75%) at ambient temperature, as a function of the portlandite content. The saturation levels of these mixtures varied between 0.62 to 0.80 as can be seen from Figure 5; i.e., these mixtures were not subjected to the short-duration, mildly elevated temperature treatment. The 1- and 3-day strengths of the carbonated mortars were found to be between 40% and 70%, respectively, of the 7-day strengths. It can be noticed from Figure 6(a) that the strengths of the conventionally cured and carbonated Class C fly ash-based mortars under the specified treatment regime are very similar, and the CO2 uptake is rather low, especially for the mixtures with higher CH contents (and higher sw). CO2 uptake is almost non-existent for the blends containing higher amounts of CH, which was also confirmed through phenolphthalein spray test on cut sections of the cube and TG/DTG curves that showed almost no consumption of CH. In other words, in spite of higher availability of Ca-species provided by portlandite, there is insignificant CO2 uptake for blends with higher portlandite contents and higher sw. While moisture accelerates carbonation reaction on mineral surfaces, CO2 diffusion is hindered by a higher pore saturation since diffusion of CO2 is significantly slower in water than in air. In fact, diffusion of CO2 is about four orders of magnitude higher in air than in water [28,29]. Also note that these mortars were carbonated after 24 hours of casting. Thus, some reaction between the Ca-species from CH and silica from fly ash would have already occurred to form C-S-H gel under conditions of high saturation. This could render CH surfaces generally unavailable for carbonation. Thus, the similar strength values noted with increase in portlandite content under both conventional curing and carbonation conditions can be mainly attributed to the reaction between the Ca-species and silica from fly ash to form C-S-H gel in the presence of higher levels of moisture. The reduction in mortar strength beyond 10% CH content needs more investigation. The increase in porosity at the higher w/b used, leaching of some of the unreacted CH under moist curing, or the formation of a porous calcium-modified silica gel with enhanced release of free water per mole of C-S-H [30–32] under carbonation of low Ca/Si ratio C-S-H gels, are plausible reasons.
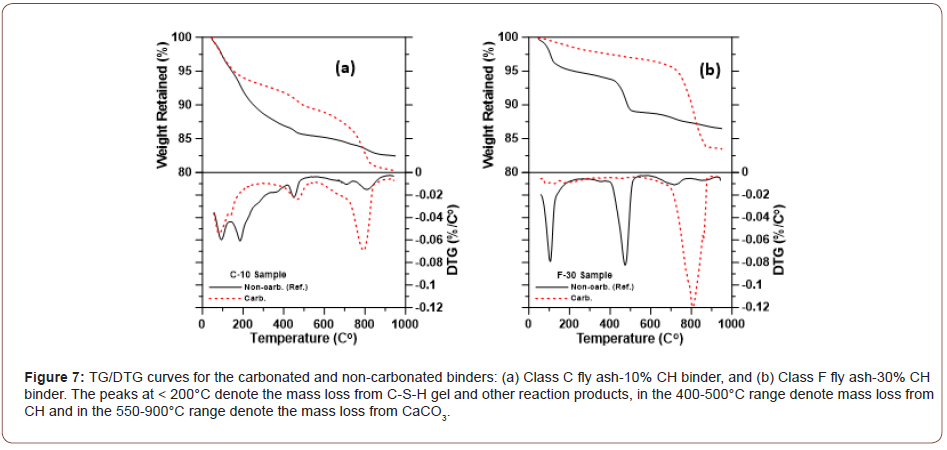
Class C fly ash mortars (sw ~ 0.22-0.25): When the saturation levels of the blends are reduced to ~0.25 by a mild, short-duration heat treatment regime immediately after casting, improved 7-day strengths are observed after carbonation, shown in Figure 6(b). Note that the heat treatment ensures similar sw irrespective of the CH content (or w/p), contrary to the high-saturation case. The embedded CO2 contents of the blends increase significantly. Phenolphthalein spray test showed that the carbonation front has penetrated the entire sample, and significant amounts of CH (if not in its entirety) are converted to carbonates as noted from the differential thermogravimetric (DTG) traces shown in Figure 7(a). CO2 diffusion is known to be enhanced by reducing the moisture content – decreasing sw from 1.0 to 0.13 in OPC-fly ash-CH mixtures has been shown to increase the CO2 uptake by an order of magnitude [19]. With a Class C fly ash binder containing 10% by mass of portlandite, compressive strengths > 35 MPa are achieved, which is sufficient for a large number of structural applications. Moreover, ~8% of CO2 by mass of the binder is also taken up, which is similar to or greater than the values reported in [12] for fly ashes. The 7-day compressive strength obtained here for the Class C fly ash-10% CH blend under ambient temperature carbonation is similar to that obtained when pure Class C fly ash is carbonated at 75°C for 7 days [18]. Thus, energy considerations also favor carbonating fly ash-CH blends rather than carbonating pure fly ash or fly ash-OPC blends. For the 15% CH binder, the strength is observed to be lower than that of the 10% CH binder, even though the CO2 uptake is higher. The carbonation of C-S-H, which increases the porosity, could be attributed to this observation. The increase in solid volume from carbonation of CH in this case is likely to be lower than the reduction in solid volume due to the carbonation of C-S-H [33] (Figure 6).
Class F fly ash mortars (sw ~ 0.35-0.40): Figure 6(c) shows the 7-day compressive strengths of the Class F fly ash mortars as a function of the CH content. Even though two thermal treatments were carried out for Class F fly ash mixtures, their sw values are similar (~0.35-0.40; see Figure 5) and hence only the results of treatment at 50°C for 5 h are reported. The strengths and CO2 uptake increase with increase in CH content. A compressive strength of 15 MPa is attained for the carbonated low-Ca fly ash mortar with 30% CH content, while the corresponding strength after conventional curing is around 5 MPa. Thus, the carbonation product formation in this case can be considered to be more dominant than the reaction of fly ash with CH. Note that the early-age, mild heat treatment is capable of producing some pozzolanic reaction products, as electron micrographs in a following section reveal. The strength of the carbonated binder is sufficient for many concrete applications including masonry blocks, low load-bearing panels, and decorative and building façade applications. For the mixtures with 20% and 30% portlandite content, the CO2 uptake values are about 10% and 16% by mass of the binder respectively, which equates to ~50% by mass of portlandite in the binder (the theoretical mass-based CO2 binding capacity of portlandite is 59% [17]). Supporting this observation is the fact that DTG traces of these blends after carbonation showed an absence of CH, even at 30% CH content (see Figure 7(b)), and most of the mass loss is attributed to the carbonate phase, denoting that the carbonation products constitute bulk of the reaction product phase in Class F fly ash-CH systems. Higher CH contents in Class F fly ash mortars also help sustain the precipitation of carbonates (Figure 7).
Proportion of initial voids remaining after carbonation: To shed further light on carbonation efficiency as a function of portlandite content, the void volume fractions in the samples (fv) after conventional curing or carbonation were determined based on the measured bulk densities and specific gravities [34]. The void volume fraction was normalized by (1-fs) where fs is the solid volume fraction of the sample determined based on mixture proportions. Thus, this ratio is indicative of the proportion of the initial voids that remain in the sample after conventional curing or carbonation and is shown as a function of CH content in Figure 8(a). In other words, this ratio defines the efficiency of the reaction in space filling. Note that the molar volume of CaCO3 is ~10% higher than that of the solid CH, which also contributes to some porosity reduction [35]. It can be noticed that, for Class C fly ash-based mixtures, the proportion of voids that remain after carbonation is lower than that remaining after conventional curing until a CH content of about 10%, after which the trend reverses. This is consistent with the strength and CO2 uptake results reported earlier. For the class F fly ash mixtures, the proportion of voids remaining after carbonation is lower than that remaining after conventional curing for all CH contents considered. For the Class C fly ash-based mixtures, the slightly lower w/p used and the formation of C-S-H gel results in a lower proportion of voids remaining after both carbonation and conventional curing, as compared to Class F fly ash-based mixtures. Figure 8(b) depicts the relationship between the 7-day strengths and fraction of voids remaining, for all the mixtures. The trend is similar to typical strength-porosity relationship of cementitious materials. For the same remaining void volume fraction, the strengths of carbonated Class C and Class F-based mortars are dissimilar owing to the differences in the nature of the reaction products formed. The carbonated Class F fly ash-CH blends consist of carbonate phase as the major reaction product, whereas for the Class C fly ash-CH blends, conventional hydration products are also formed. The proportion of initial voids remaining after the carbonation regime or conventional curing provides a simple and convenient measure to quantify the relative efficiency of carbonation (Figure 8).
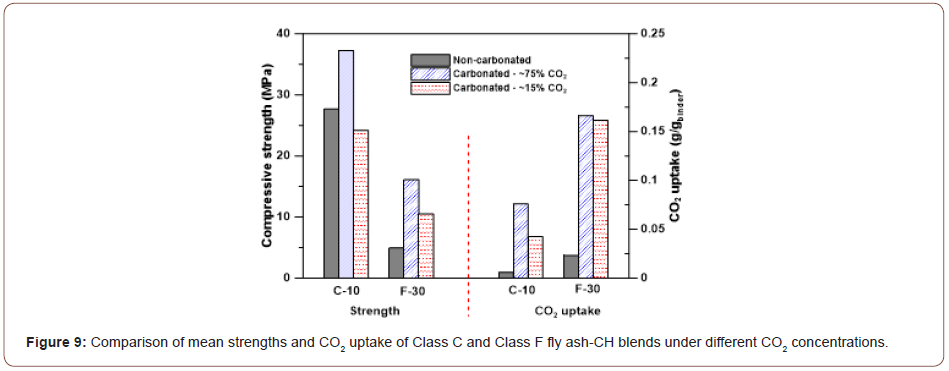
Carbonation under low CO2 concentration: The experiments described in the foregoing sections were carried out under higher CO2 concentrations of ~75%. However, carbonation of fly ashes to form value-added products using waste CO2 from industrial process streams demand the use of flue gases, which have much lower CO2 For example, cement plant flue gas has a concentration of 14-18 vol% CO2. Hence, preliminary studies were carried out by carbonating selected Class C and Class F fly ash-CH blends at a CO2 concentration of ~15%. The Class C fly ash mortars were treated to a 70oC- 3h regime, while the Class F fly ash mortars were treated to a 50°C-5h regime, to obtain the corresponding sw values shown in Figure 5. The 7-day strengths and CO2 uptake results are shown in Figure 9. For both the chosen blends, the compressive strengths and CO2 uptake under a low CO2 concentration are noticed to be lower than those under a higher CO2 concentration. Even though studies using modified mixture design or processing parameters were not carried out as part of this study, it is possible that the strengths and CO2 uptake can be enhanced through such measures for low CO2 concentrations (Figure 9).

Mixtures processed through consolidation and extrusion
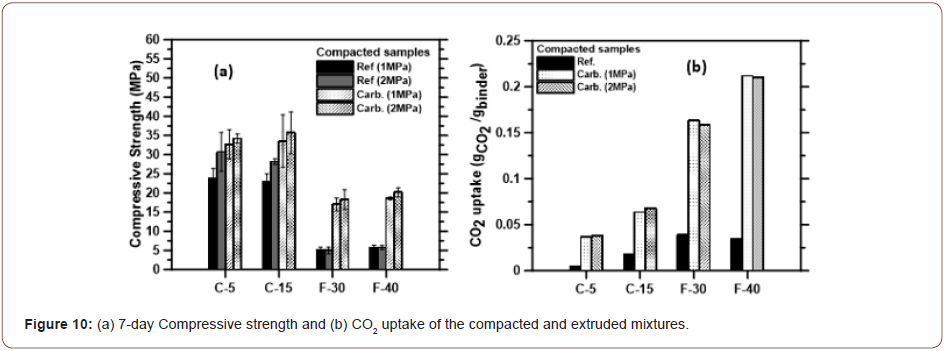
The compressive strengths and CO2 uptake of selected, conventionally cured and carbonated (at ~75% CO2 concentration) Class C and Class F fly ash-portlandite blends processed through consolidation and extrusion are shown in Figure 10. The consolidation pressures applied were 1 MPa and 2 MPa respectively. Due to the lower w/b used for their synthesis, and the effect of consolidation, the saturation levels in the Class C fly ash-based binders were in between 0.50 and 0.55 (no short-duration, mild heat treatment was applied in this case), whereas those for Class F fly ash-based binders were close to 0.30. The CO2 uptake and the compressive strengths of Class C fly ash binders are in between those for sw of ~0.70 and 0.22 reported earlier. The consolidation and extrusion processing results in highest strengths and CO2 uptake for the Class F fly ash-based binders, aided by the combined effects of consolidation and carbonate product formation. The CO2 uptake is not significantly different for the samples subjected to 1 MPa and 2 MPa consolidation pressure, suggesting that the strength increase noted for the higher applied pressure is simply the effect of improved particle packing. For the extruded mixtures, the improved particle packing could have reduced the rate of CO2 penetration. Nonetheless, it is shown that extrudable fly ash binders with significantly improved properties than conventionally cured systems can be produced through carbonation, making this an attractive processing route for precast components, especially when a source of waste CO2 is readily available (Figure 10).
Microstructural and spectroscopic observations
Scanning electron micrographs of conventionally cast carbonated fly ash-portlandite blends carbonated under high CO2 concentration (~75%) are shown in Figure 11. The blend containing 10% CH for the Class C fly ash mixture (Figures 11(a)-(c)), and that containing 30% CH for the Class F fly ash mixture (Figures 11(d)-(f)) are shown in these figures since they showed the highest strengths. In addition to the amorphous reaction products uniformly distributed in the matrix containing partly reacted fly ash particles, a few crystalline morphologies are also observed under close examination. The amorphous zones were predominantly found to be rich in Ca and Si, with some Al, denoting the presence of C-S-H gel. This is expected since the reaction of some of the CH with fly ash could have been accelerated by the drying regime adopted to reduce sw. Some of the crystalline species were identified as CH particles and some as precipitated calcium carbonate [36–38], as was noticed from EDX spot analysis. As can be noticed from these figures, for both the Class C and Class F fly ash blends, local accumulation of crystalline morphologies is seen. High magnification micrographs also depict the presence of carbonate crystals proximal to the fly ash surfaces. The morphology of calcite crystals is reported to be influenced by the [Ca2+] to [CO3] ratio [4,40]. Excess Ca2+ in the solution is shown to favor the growth of spindle-like or rhombohedral crystals, which is noticed in some of these micrographs. Slow growth of calcite crystals, as in the case of a diffusion-controlled process, also results in a rhombohedral geometry. Incorporation of other ions in the crystal structure of calcite can potentially result in altered morphologies [41]. The longer duration of carbonation, 7 days in this case, is postulated to have resulted in the presence of some larger calcite crystals [42,43] as noticed in these figures. For the carbonated Class C fly ash blend, in addition to C-S-H gel, Ca-deficient and Si-rich regions were also observed under EDX, away from the surface of fly ash particles, likely denoting the formation of a Si-rich gel from the carbonation of C-S-H [39] (Figure 11).
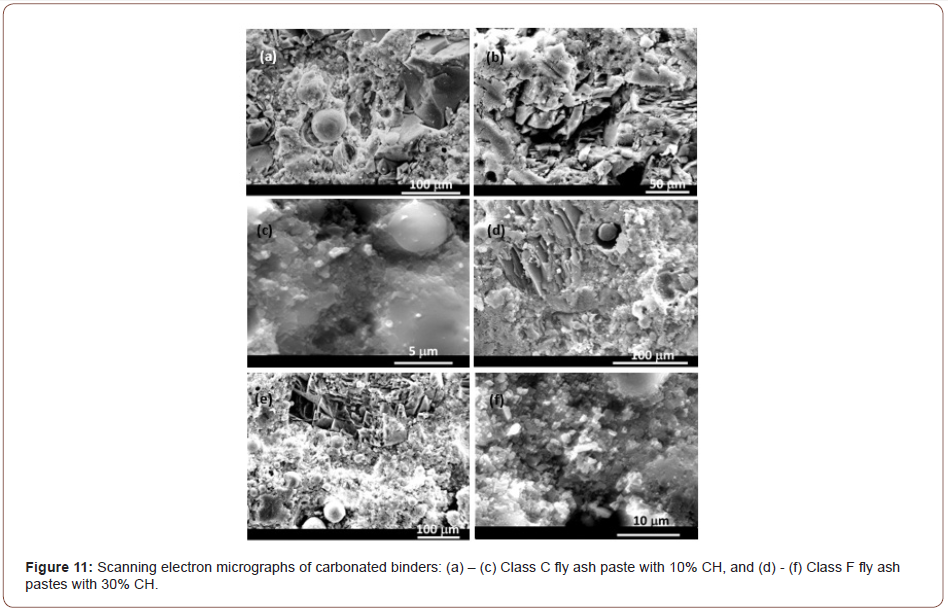
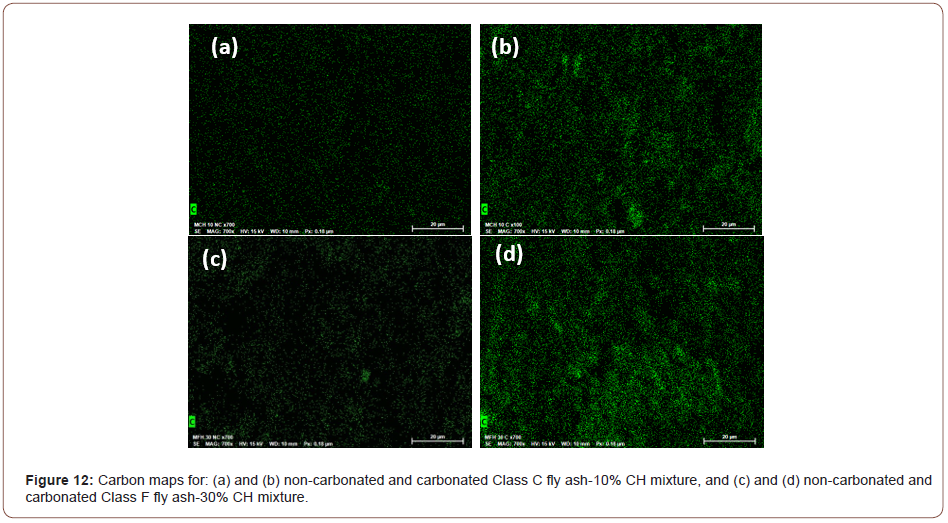
Figure 12 shows the carbon maps obtained from energy dispersive x-ray spectroscopy on the imaged samples, for the Class C and Class F fly ash-CH blends. The relative intensities of carbon in the maps are found to be significantly higher in the carbonated samples than those in the non-carbonated samples, providing a qualitative indication of the efficiency of carbonation. The Class F fly ash blend with 30% CH shows a higher C intensity compared to the Class C fly ash blend with 10% CH, indicating the presence of higher amounts of carbonates, which is also shown in the TG/DTG curves in Figure 7 (Figure 12).
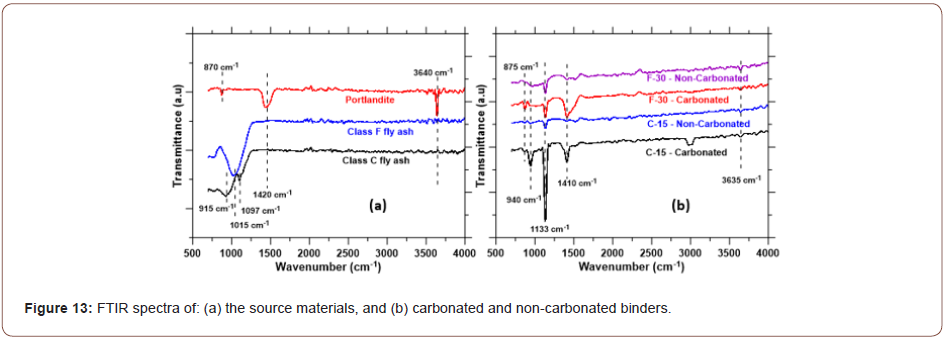
FTIR spectra of the starting materials and selected non-carbonated and carbonated samples are shown in Figures 13(a) and (b) respectively. The spectra for Class C fly ash shows a peak at around 1100 cm-1, corresponding to the asymmetric stretching vibrations of Si-O(Si), and another one around 915 cm-1, attributable to Al-O vibrations [44,45] as shown in Figure 13(a). This is generally associated with Al in the octahedral position, confirming the presence of mullite [46]. The major band for Class F fly ash appears at 1015 cm-1, which is generally attributed to the asymmetric stretching vibration of Si-O or Si-Al bonds present in aluminosilicate structures. The strong and sharp band at 3640 cm-1 in the portlandite spectrum corresponds to the vibration of O-H bond from the hydroxides [47]. The peak at 870 cm-1 can be indicative of Ca-O bonds, or weak out-of-plane bending of CO32- [48], while the peak at 1420 cm-1 is attributed to the C-O bonds from carbonates, which is a result of some carbonation of portlandite exposed to atmosphere.
Figure 13(b) presents the FTIR spectra of the carbonated and non-carbonated Class C fly ash binder with 15% CH content, and Class F fly ash binder with 30% CH content. A prominent peak is observed at around 1130 cm-1, which is attributable to the stretching vibrations of Si-O bonds in the original reaction products. This peak is observed for both carbonated and non-carbonated binders synthesized from Class C and Class F fly ashes. While typical C-S-H gel bands are observed in the 970 cm-1 range for cement hydration products, a shift to ~1140 cm-1 is noted to indicate Al substitution for Si and the formation of predominantly C-A-S-H structures [49] from the aluminosilicates in the fly ashes. In the absence of Portland cement, such reaction products can be expected. The peak at 940 cm-1 can also be attributed to the Si-O stretching vibrations. The peak at 1410 cm-1, prominent for the carbonated binders, corresponds to the asymmetric stretching of CO32-. This strong peak is rather sharp for the carbonated Class C fly ash binder, while broad for the Class F fly ash binder. All the carbonated binders show a peak at 875 cm-1, which could be attributed to the out-of-plane bending of CO32-, especially because they are absent in the non-carbonated binders. A weak peak is also noticed at 3635 cm-1, denoting the presence of hydroxides, which has been indicated in the TG/DTG curves especially for the Class C fly ash binders. However, the FTIR spectra clearly show that, for both carbonated and non-carbonated binders, the added CH has been mostly consumed (likely through a combination of carbonation and conventional reaction with fly ash, for the carbonated samples), which is in line with the thermal analysis and strength results (Figure 13).
Summary and Conclusions
The development of cement-free binding agents through the carbonation of Class C and Class F fly ashes augmented with portlandite at ambient conditions has been elucidated. The proportions of the binders were designed so as to facilitate the fabrication of shape stable mixtures, either through a conventional casting process or extrusion. The rheological parameters of the mortars required to ensure shape stability was brought out. Increasing portlandite content increased the yield stress of both Class C and Class F fly ash suspensions. Extrusion yield stress determined using capillary rheology experiment was shown to be a promising approach to quantify the extrudability of such mixtures and can be used for mixture selection and qualification. The compressive strength and CO2 uptake of the binders were found to be significantly influenced by the saturation levels of the samples, since pore moisture retards the diffusive transport of CO2. For Class C fly ash-CH blends, a lower saturation level was able to provide a mortar compressive strength of more than 35 MPa and a CO2 uptake of about 8% by mass of the binder, after ambient temperature carbonation. Thermal analysis and SEM images confirmed the transformation of a significant amount of portlandite into carbonates for this specimen. For Class F fly ash-CH blends higher added CH contents resulted in increased CO2 uptake (~16% by mass of the binder) but the strength was around 15 MPa, attesting to the difference in the nature of the reaction products. However, the enhancement in strength relative to the non-carbonated sample was highest for the specimen with 30% CH, at more than 300%. Thermal analysis showed that the added portlandite was entirely consumed towards carbonate formation in Class F fly ash-CH blends, which was supported by electron micrographs and FTIR spectroscopy. A simple measure based on the fraction of initial voids that remain after carbonation or conventional curing was used to evaluate the efficiency of carbonation. For selected Class C and Class F fly ash-CH systems designed with a lower w/p to facilitate extrusion processing, the strengths after 7 days of carbonation were higher than those conventionally cast. This study has shown that properly designed fly ash-CH binder systems can be efficiently carbonated to produce cement-free binders with satisfactory compressive strengths for a variety of applications. The type of fly ash, amount of portlandite used, w/p, fresh binder treatment to adjust pore water saturation, and the type of processing can be tailored to deliver desired compressive strengths. With their capacity to sequester CO2 and mitigate the CO2 emissions and energy demand associated with OPC manufacturing, the sustainability benefits of these binders outweigh those common in the concrete industry, e.g., high volume fly ash concretes. The durability of such binders is yet to be investigated in detail.
Acknowledgment
The authors acknowledge the funding from Department of Energy, National Energy Technology Laboratory (DE-FE0029825), and the National Science Foundation (CMMI: 1463646) for this work. The contents of this paper reflect the views and opinions of the authors, who are responsible for the accuracy of the datasets presented herein, and do not reflect the views and/or policies of the funding agencies, nor do the contents constitute a specification, standard or regulation.
Conflicts of Interest
No conflict of interest.
References
- Olivier JGJ, Peters J AHW, Janssens-Maenhout G, Muntean M (2013) Trends in global CO2 2013 Report. Netherlands Environmental Assessment Agency PBL, Netherlands.
- RM Andrew (2018) Global CO2 emissions from cement production, 1928-2018. Earth System Science Data 10: 195-217.
- (2018) Technology Roadmap - Low-Carbon Transition in the Cement Industry.
- R Chang, S Kim, S Lee, S Choi, M Kim, et al. (2017) Calcium Carbonate Precipitation for CO2 Storage and Utilization: A Review of the Carbonate Crystallization and Polymorphism. Front Energy Res 5: 1-12.
- A Ćwik, I Casanova, K Rausis, K Zarębska (2019) Utilization of high-calcium fly ashes through mineral carbonation: The cases for Greece, Poland and Spain. Journal of CO2 Utilization 32: 155-162.
- A Ćwik, I Casanova, K Rausis, N Koukouzas, K Zarębska (2018) Carbonation of high-calcium fly ashes and its potential for carbon dioxide removal in coal fired power plants. Journal of Cleaner Production 202: 1026-1034.
- HY Jo, JH Kim, YJ Lee, M Lee, SJ Choh (2012) Evaluation of factors affecting mineral carbonation of CO2 using coal fly ash in aqueous solutions under ambient conditions. Chemical Engineering Journal 183: 77-87.
- L Ji, H Yu, X Wang, M Grigore, D French, et al. (2017) CO2 sequestration by direct mineralisation using fly ash from Chinese Shenfu coal. Fuel Processing Technology 156: 429-437.
- G Montes-Hernandez, R Pérez-López, F Renard, JM Nieto, L Charlet (2009) Mineral sequestration of CO2 by aqueous carbonation of coal combustion fly-ash. J Hazard Mater 161(2-3): 1347-1354.
- RR Tamilselvi Dananjayan, P Kandasamy, R Andimuthu (2016) Direct mineral carbonation of coal fly ash for CO2 Journal of Cleaner Production 112(Part 5): 4173-4182.
- W Liu, S Su, K Xu, Q Chen, J Xu, et al. (2018) CO2 sequestration by direct gas–solid carbonation of fly ash with steam addition. Journal of Cleaner Production 178: 98-107.
- A Ebrahimi, M Saffari, D Milani, A Montoya, M Valix, et al. (2017) Sustainable transformation of fly ash industrial waste into a construction cement blend via CO2 Journal of Cleaner Production 156: 660-669.
- CW Noack, DA Dzombak, DV Nakles, SB Hawthorne, LV Heebink, et al. (2014) Comparison of alkaline industrial wastes for aqueous mineral carbon sequestration through a parallel reactivity study. Waste Manag 34(10): 1815-1822.
- L Ji, H Yu, R Zhang, D French, M Grigore, et al. (2019) Effects of fly ash properties on carbonation efficiency in CO2 mineralisation. Fuel Processing Technology 188: 79-88.
- A Mazzella, M Errico, D Spiga (2016) CO2 uptake capacity of coal fly ash: Influence of pressure and temperature on direct gas-solid carbonation. Journal of Environmental Chemical Engineering 4(4): 4120-4128.
- A González, N Moreno, R Navia (2014) CO2 carbonation under aqueous conditions using petroleum coke combustion fly ash. Chemosphere 117: 139-143.
- Committee on Developing a Research Agenda for Utilization of Gaseous Carbon Waste Streams, Board on Chemical Sciences and Technology, Division on Earth and Life Studies, National Academies of Sciences, Engineering, and Medicine (2019) Gaseous Carbon Waste Streams Utilization: Status and Research Needs, National Academies Press, Washington, DC, USA.
- Z Wei, B Wang, G Falzone, ECL Plante, MU Okoronkwo, et al. (2018) Clinkering-free cementation by fly ash carbonation. Journal of CO2 Utilization 23: 117-127.
- I Mehdipour, G Falzone, EC La Plante, D Simonetti, N Neithalath, et al. (2019) How microstructure and pore moisture affect strength gain in portlandite-enriched composites that mineralize CO2. ACS Sustainable Chemistry & Engineering 7: 13053-13061.
- E Gartner, T Sui (2018) Alternative cement clinkers. Cement and Concrete Research 114: 27-39.
- JJ Benbow, J Bridgwater (1993) Paste flow and extrusion, Clarendon Press, Oxford, UK.
- J Powell, S Assabumrungrat, S Blackburn (2013) Design of ceramic paste formulations for co-extrusion. Powder Technology 245: 21-27.
- N Roussel, C Stefani, R Leroy (2005) From mini-cone test to Abrams cone test: measurement of cement-based materials yield stress using slump tests. Cement and Concrete Research 35(5): 817-822.
- Z Zhou, MJ Solomon, PJ Scales, DV Boger (1999) The yield stress of concentrated flocculated suspensions of size distributed particles. Journal of Rheology 43: 651-671.
- SAO Nair, H Alghamdi, A Arora, I Mehdipour, G Sant, et al. (2019) Linking fresh paste microstructure, rheology and extrusion characteristics of cementitious binders for 3D printing. Journal of the American Ceramic Society 102(7): 3951-3964.
- H Alghamdi, SA Nair, N Neithalath (2019) Insights into material design, extrusion rheology, and properties of 3D-printable alkali-activated fly ash-based binders. Materials & Design 167: 107634.
- PFG Banfill (2006) Rheology of fresh cement and concrete Rheology Reviews.
- M Thiery, G Villain, P Dangla, G Platret (2007) Investigation of the carbonation front shape on cementitious materials: effects of the chemical kinetics. Cement and Concrete Research 37(7): 1047-1058.
- A Younsi, P Turcry, E Rozière, A Aît-Mokhtar, A Loukili (2011) Performance-based design and carbonation of concrete with high fly ash content. Cement and Concrete Composites 33(10): 993-1000.
- W Liu, YQ Li, LP Tang, ZJ Dong (2019) XRD and 29Si MAS NMR study on carbonated cement paste under accelerated carbonation using different concentration of CO2. Materials Today Communications 19: 464-470.
- A Morandeau, M Thiéry, P Dangla (2014) Investigation of the carbonation mechanism of CH and C-S-H in terms of kinetics, microstructure changes and moisture properties. Cement and Concrete Research 56: 153-170.
- J Li, Q Yu, H Huang, S Yin (2019) Effects of Ca/Si Ratio, Aluminum and Magnesium on the Carbonation Behavior of Calcium Silicate Hydrate. Materials 12(8): 1268.
- V Shah, K Scrivener, B Bhattacharjee, S Bishnoi (2018) Changes in microstructure characteristics of cement paste on carbonation. Cement and Concrete Research 109: 184-197.
- H Alghamdi, N Neithalath (2019) Synthesis and characterization of 3D-printable geopolymeric foams for thermally efficient building envelope materials. Cement and Concrete Composites 104: 103377.
- K Vance, G Falzone, I Pignatelli, M Bauchy, M Balonis, et al. (2015) Direct carbonation of Ca (OH)2 using liquid and supercritical CO2: implications for carbon-neutral cementation. Industrial & Engineering Chemistry Research 54(36): 8908-8918.
- Ö Cizer, C Rodriguez-Navarro, E Ruiz-Agudo, J Elsen, D Van Gemert, et al. (2012) Phase and morphology evolution of calcium carbonate precipitated by carbonation of hydrated lime. J Mater Sci 47: 6151-6165.
- SA Yaseen, GA Yiseen, Z Li (2019) Elucidation of Calcite Structure of Calcium Carbonate Formation Based on Hydrated Cement Mixed with Graphene Oxide and Reduced Graphene Oxide. ACS Omega 4(6): 10160-10170.
- D Ergenç, R Fort (2018) Accelerating carbonation in lime-based mortar in high CO2 Construction and Building Materials 188: 314-325.
- WJ Long, Y Gu, F Xing, KH Khayat (2018) Microstructure development and mechanism of hardened cement paste incorporating graphene oxide during carbonation. Cement and Concrete Composites 94: 72-84.
- J Jiang, Q Zheng, D Hou, Y Yan, H Chen, et al. (2018) Calcite crystallization in the cement system: morphological diversity, growth mechanism and shape evolution. Phys Chem Chem Phys 20: 14174-14181.
- L Fernández-Díaz, JM Astilleros, CM Pina (2006) The morphology of calcite crystals grown in a porous medium doped with divalent cations. Chemical Geology 225(3-4): 314-321.
- T Roncal-Herrero, JM Astilleros, P Bots, JD Rodríguez-Blanco, M Prieto, et al. (2017) Reaction pathways and textural aspects of the replacement of anhydrite by calcite at 25° American Mineralogist 102(6): 1270-1278.
- M Altiner, M Yildirim (2017) Production of precipitated calcium carbonate particles with different morphologies from dolomite ore in the presence of various hydroxide additives. Physicochemical Problems of Mineral Processing 53(1): 413-426.
- Y Liu, F Zeng, B Sun, P Jia, IT Graham (2019) Structural Characterizations of Aluminosilicates in Two Types of Fly Ash Samples from Shanxi Province. North China Minerals 9(6): 358.
- W Mozgawa, M Król, J Dyczek, J Deja (2014) Investigation of the coal fly ashes using IR spectroscopy. Spectrochim Acta A Mol Biomol Spectrosc132: 889-894.
- A Fernández-Jiménez, A Palomo (2005) Mid-infrared spectroscopic studies of alkali-activated fly ash structure. Microporous and Mesoporous Materials 86: 207-214.
- M Galván-Ruiz, J Hernández, L Baños, J Noriega-Montes, ME Rodríguez-García (2009) Characterization of Calcium Carbonate, Calcium Oxide, and Calcium Hydroxide as Starting Point to the Improvement of Lime for Their Use in Construction. Journal of Materials in Civil Engineering 21: 694-698.
- P Yu, RJ Kirkpatrick, B Poe, PF McMillan, X Cong (1999) Structure of Calcium Silicate Hydrate (C-S-H): Near-, Mid-, and Far-Infrared Spectroscopy. Journal of the American Ceramic Society 82(3): 742-748.
- K Kupwade-Patil, SD Palkovic, A Bumajdad, C Soriano, O Büyüköztürk (2018) Use of silica fume and natural volcanic ash as a replacement to Portland cement: Micro and pore structural investigation using NMR, XRD, FTIR and X-ray microtomography. Construction and Building Materials 158: 574-590.
-
Hussam Alghamdi, Aashay Arora, Emily Ford, Narayanan Neithalath. Carbonation Processing and Characterization of Fly Ash-Portlandite Blends as Cement-Free Binding Agents. Cur Trends Civil & Struct Eng. 8(1): 2021. CTCSE.MS.ID.000676.
-
Fly ash mortars, Construction materials, Concrete, Limestone, Temperature, Carbonation, Environment, Compressive strength, Yield stress
-

This work is licensed under a Creative Commons Attribution-NonCommercial 4.0 International License.


