 Research Article
A Parametric Study on the Effects of Shear Wall Locations in a Typical Five-Story Reinforced Concrete Structure Subjected to a Severe Earthquake
Nader Zad* and Dr. Hani Melhem
Kansas State University, United States of America
Nader Zad, Department of Civil Engineering, Kansas State University, Manhattan, Kansas, United States of America.
Received Date: August 23, 2021; Published Date: September 15, 2021
Abstract
To minimize earthquake-induced damages in structures, one of the most reliable ways to design and construct earthquake-resistant buildings is to utilize reinforced concrete shear walls because they increase the structural resistance to lateral loads and effectively stiffens and strengthens the structure. This is known as the best seismic-resistant design method that ensures the stability of multi-story buildings against lateral forces when subjected to strong earthquakes. This paper investigates the effects of the shear wall location in a typical low-rise building to improve earthquake resistance. The study initially models a five-story reinforced concrete structure without shear walls and then adds shear walls at different locations in the structure. SAP2000 is used to perform dynamic analysis under the 1994 Northridge earthquake, an example of severe seismic excitation. Response modal nonlinear time-history dynamic analysis is utilized to obtain an accurate representation of the structure’s behavior. The response of the building with and without shear walls is analyzed and compared for various locations of the shear walls in the structure. Study results show that shear walls effectively reduce horizontal displacements and story drifts to achieve compliance with seismic design codes. The use of shear walls also significantly reduces shear stresses, bending moments, and displacements of various members of the structure. Numerical values and maximum percent of possible changes in the design parameter are reported in the paper. Various seismic demands of the elastic models (with and without shear walls) have been evaluated and compared. The presented work claims that shear walls effectively reduce shear stresses. It is a fact that increasing the stiffness of the structure in severe seismic zones could simultaneously attract more seismic forces, and if the reinforcement is not detailed appropriately, it could reduce the ductility of the structure. The structural elements, including frame elements and the shear walls are inelastic.
Keywords:Modal; Nonlinear; Time history; Dynamic analysis; Northridge; Reinforced concrete structure; Shear walls; SAP2000
Introduction
Time history
Dynamic loading caused by earthquakes, wind, traffic, or blasts is most commonly represented by time histories. Time histories can be obtained from earthquake ground motion measurements, structural responses during earthquakes, structural measurements during dynamic tests, or outputs of time history analyses of structures. The most general definition of time history data is data that is time stamped. Some applications require the ground motion precise time with date and hours, including minutes, seconds, and milliseconds. Universal time can be used to avoid confusing time zone and daylight savings time differences. To pinpoint the epicenter of an earthquake, all individual recordings must use the exact same reference time, otherwise wave travel time computation cannot be carried out correctly and the epicenter cannot be precisely located. When evaluating an individual earthquake acceleration recording or a tri-axial set of recordings, the actual recording time is of minimal importance, although exact timing of the recordings is required to locate the earthquake epicenter and hypo center, compared to a constant time interval between samples. Early analog recordings of earthquakes are discretized with nonuniform time steps, and special algorithms are devised; modern digital recordings use constant time steps. Synchronization of the time signal is essential for large dynamic tests that usually involve several advanced data acquisition systems. If synchronization is overlooked in the planning stages, then subsequent data analysis can be very challenging [1].
Time series
Time series analysis analyzes data to extract meaningful statistics and other data characteristics. Because time series data are ordered in time, their analysis is distinct from other common data analysis problems that have no ordering of observations. An example of such unordered data would be the height and weight of students in a class. While this information can be rearranged and ranked, the order in which the students’ weights and heights were measured is typically irrelevant for comparison if the measuring occurred within a reasonable time frame [1].
Single degree of freedom dynamics
Undamped free vibration: The simplest dynamic system has only a single mass and stiffness (spring). Mass and stiffness of a simple structure can often be approximated and idealized as a single degree of freedom (SDOF) system. SDOF refers to the motion of mass that can be predicted using formulations presented in this section. If the dynamic system has an energy dissipation mechanism, it can be approximated using viscous damping that accounts for motions of system decay after the removal of excitation [1]. The idealized representation of an undamped SDOF system therefore consists of a spring with stiffness, k, and a mass, m. Coordinate x determines the position of mass m and is expressed as x(t) since it varies with time [1]. Predicted vibration of the system continues forever since no energy dissipating mechanism will reduce the motion over time.
Damped free vibration: An SDOF with mass ma, spring stiffness ka, and a damper with a constant value ca is shown in Figure 1 (Figure 1).

Any device is a damper device if it reduces the oscillation amplitude of a system by dissipating energy [1].
Harmonic excitation: Harmonic excitation refers to a specific type of forcing function composed of one or more sinusoidal components [1]. Figure 2 shows a damped SDOF system with an applied force f(t) that is a function of time.

k: spring stiffness
cv: damping coefficient
m: mass
l0: undeformed position
x: motion direction
Capturing an SDOF system’s maximum displacement response: Depending on the base excitation characteristics and system’s natural frequency, the maximum absolute displacement response can occur either during the excitation phase or during the free vibration phase [1].
Summary of earthquake characteristics
Various earthquake record characteristics should always be computed for a range of angles and, when appropriate, the median geomean value should be used to form the basis of regressions or to judge how well a record meets selected criteria. When processing large numbers of records, individual records and their characteristics must be inspected for abnormalities. To aid in such evaluations, detailed plots of individual record sets are required, allowing a user to verify that no potential manipulations of records adversely affected the time histories. The key is to consistently plot the strong motion records and their characteristics and to examine them carefully before embarking on extensive, costly time history analysis projects for which such records are used as input. Although significant effort is not required to rerun a set of time histories after the original set is rejected or revised, substantial resources are needed to reinterpret, post-process, and document the new results. Thus, the individual carrying out dynamic analysis, not the person who provides the time histories, is responsible for conducting a thorough review of input records before they are used for dynamic analysis. If an individual is unqualified to fully evaluate input motions, then he or she is also generally not qualified to carry out dynamic analyses without proper technical guidance [1]. In nonlinear dynamic analysis, a series of ground motions to represent seismic demands associated with select hazard levels. A computer model representing nonlinear response characteristics of the structural framing is assembled to simulate dynamic response to the selected earthquake ground motions [2]. The usual application selects two sets of earthquake ground motions, one to represent a Service Level Earthquake (SLE) level and another to represent a Maximum Considered Earthquake (MCE) level [2].
Shear walls
A shear-wall-frame structure, which uses the wall and frame to resist lateral load, is typically used in buildings ranging from 8 to 30 stories [3].
Literature Review
Chandurkar et al. [4] determined the optimal location for shear walls in a multi-storied building and studied shear wall effectiveness using four models. Kurma et al. [5] conducted pushover analysis on two multi-storied reinforced concrete (RC) frame buildings: one building had 10 stories with five bays in X direction and five bays in Y direction, and the second building contained 15 stories. The shear wall was used to study their resisting lateral forces, and the paper highlighted the effect of a shear wall on the building when a wall was located along the long and short sides of the building. Tidke et al. [6] used five models to study the effect of seismic loading relative to shear wall placement in various locations in a building. Sanjeev et al. [7] considered a spatial configuration of a 20-storied structure with a maximum 70 m height; each story had a height of 3.5 m with a shear wall, with bracing at various locations in the building.
Numerical Study
Figure 3 shows the unscaled response spectra (Figure 3).
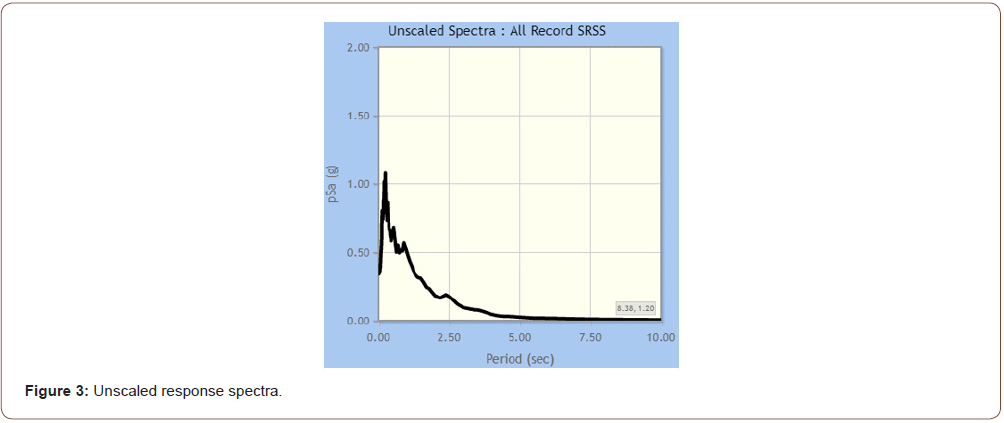
An accelerogram, which measures the peak ground acceleration, duration, and frequency content of an earthquake, can be integrated to obtain time variations of ground velocity and ground displacement [8].
Building description
The building in this study was a five-storied concrete with and without shear wall building with concrete flat slabs supported by concrete columns. Figures 4 & 5 show the floor plan and elevation of the building model (Figures 4,5).
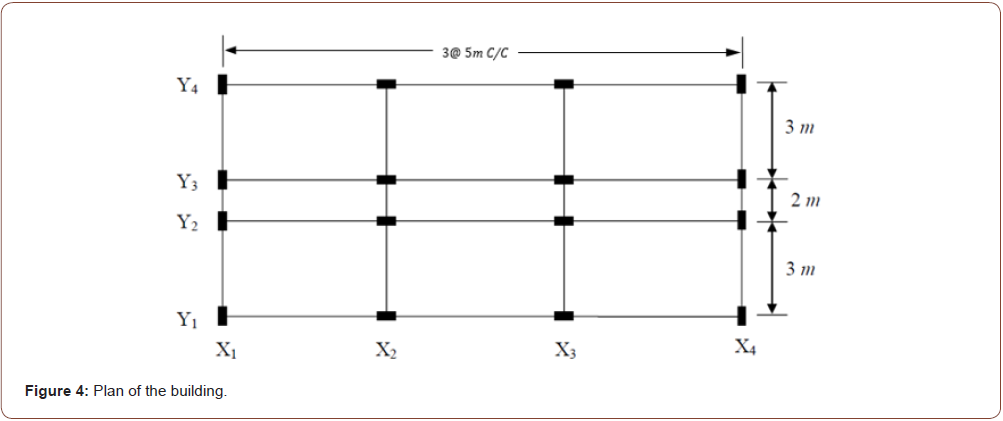
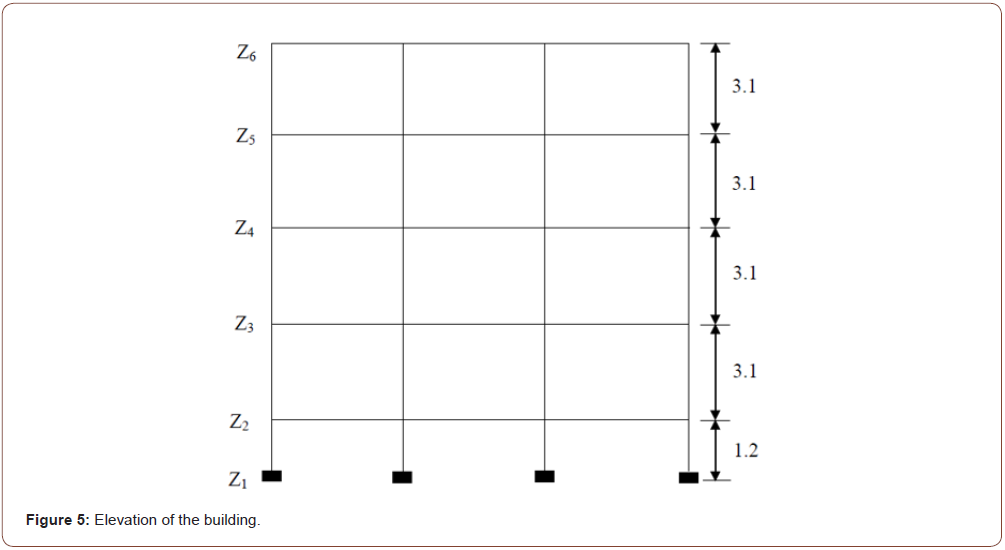
Building details are as follows:
1. Grade of concrete used is M20 (M20 is 20 MPa strength achieved after 28 days of curing) and grade of steel used is Fe415 (the number 415 indicates that the yield tensile strength of steel is 415 N/mm2). These steels are used as rebar in beams, columns and shear walls.
2. Floor heights are 3.1 m.
3. Parapet heights are 1.5 m.
4. Slab Thicknesses are 150 mm.
5. External wall thicknesses are 230 mm and internal wall thicknesses are 150 mm.
6. Sizes of columns are 300 mm × 450 mm and sizes of beams are 300 mm × 450 mm.
7. Live loads on floors are 3 KN/m2 and live loads on roof are 1.5 KN/m2.
8. Floor finishes are 1 KN/m2 and roof treatments are 1.5 KN/ m2.
9. Building frame type is Special Moment Resisting Frame (SMRF).
10. Density of concrete is 25 KN/m3and density of masonry wall is 20 KN/m3.
The shear walls were shell-thin members, and 304.8 mm thick.
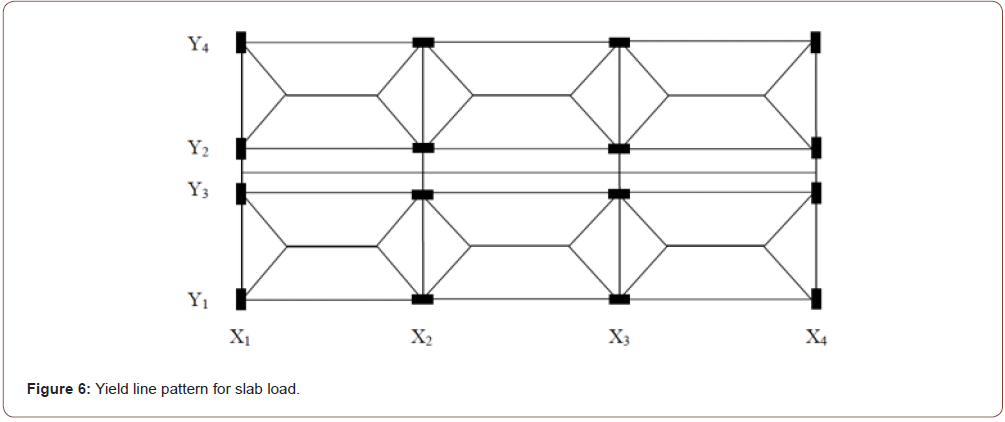
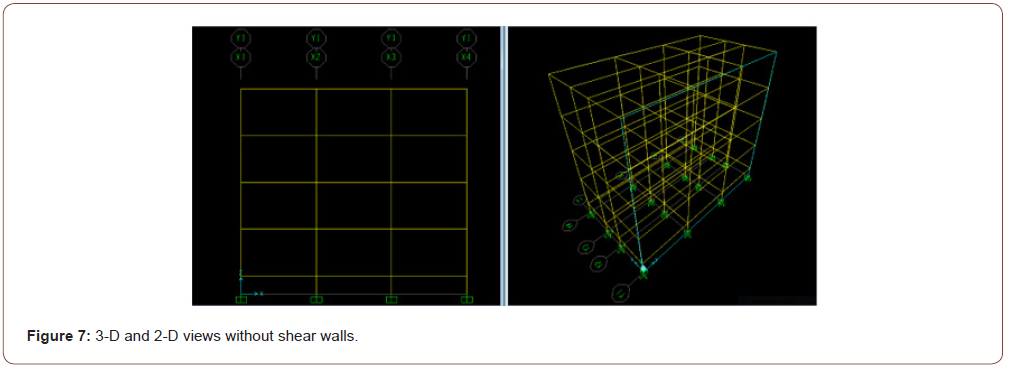
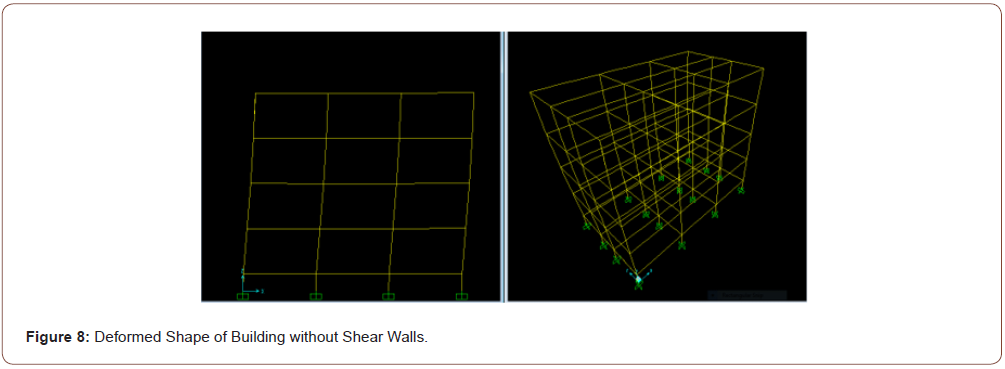
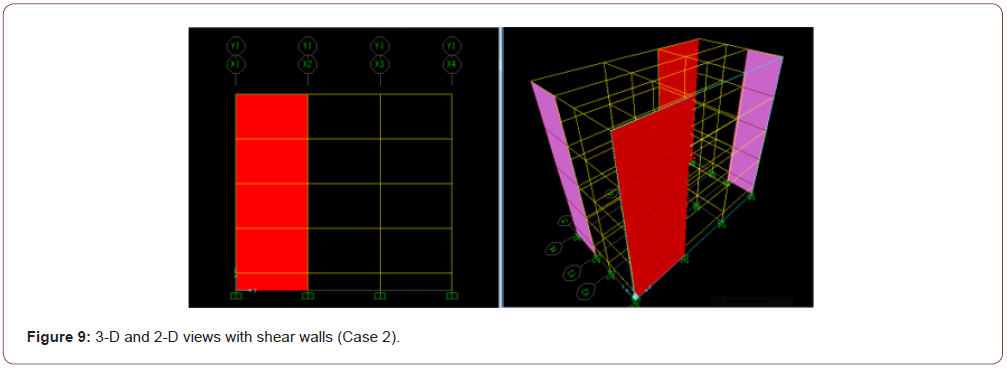
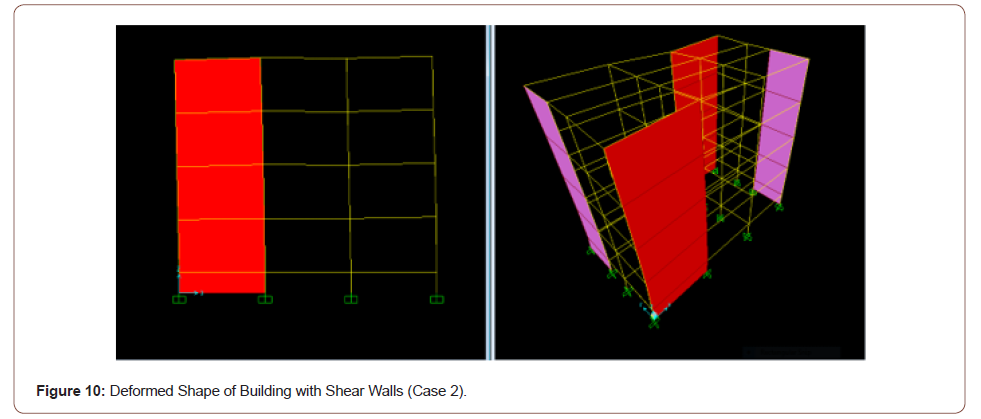
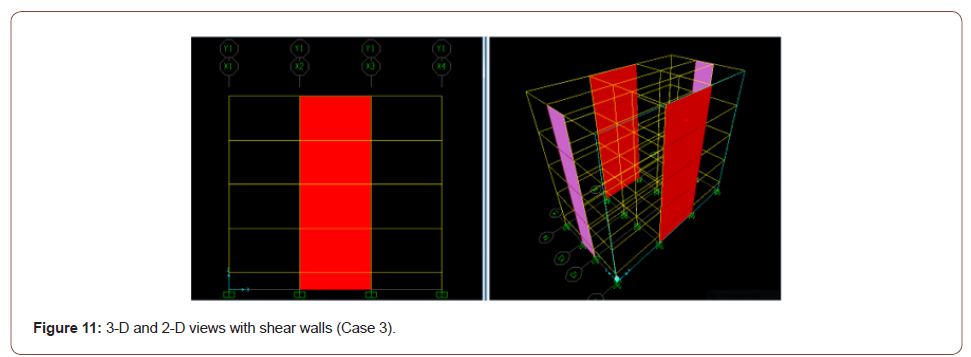
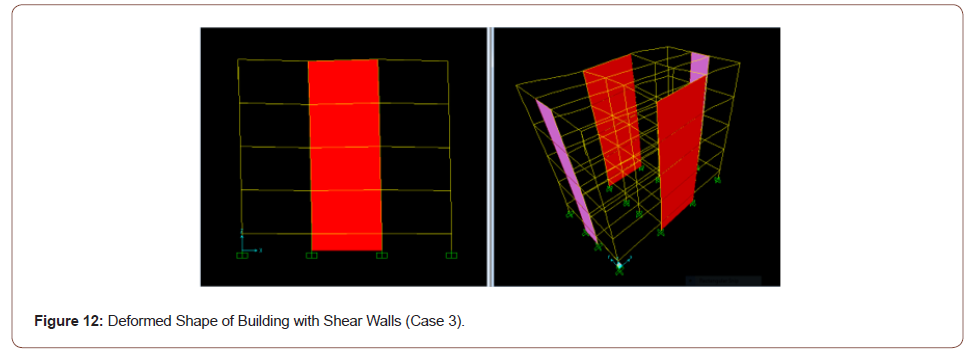
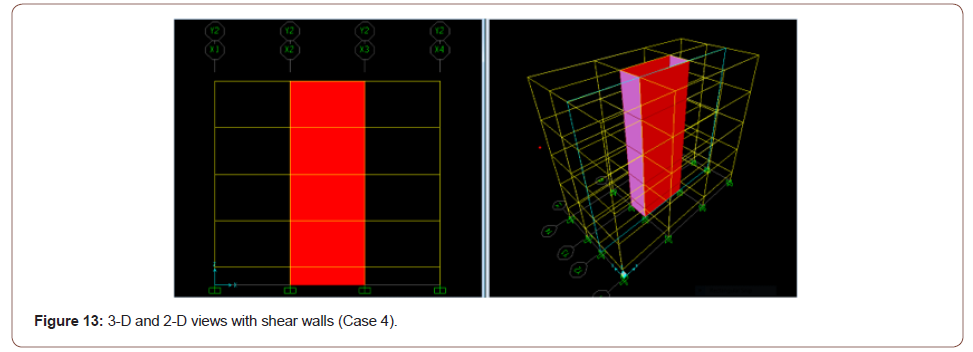
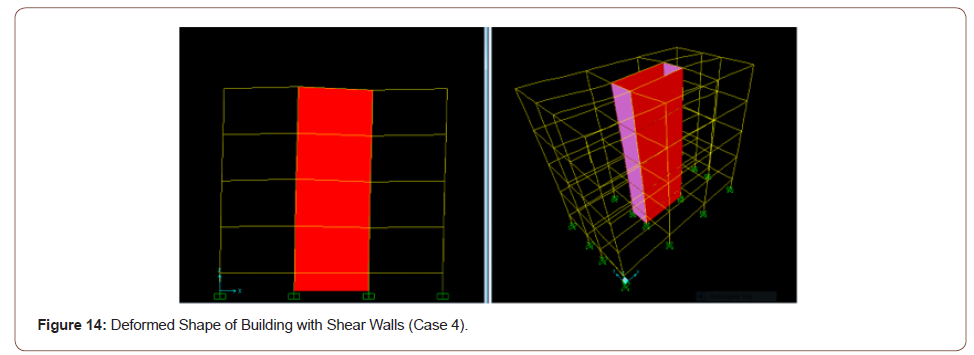
This research’s main objective is to determine the optimum shear wall locations under three dimensions of earthquake excitation using SAP2000. SAP2000 automatically utilizes conventional meshing to mesh any areas drawn with more than four joints. Therefore, three models of shear wall locations have been used in this research and were compared to the base model without shear walls (Case1). In Case 2, the shear walls are located on the perimeter of the structure at the left of each of the four building faces. In Case 3, the shear walls are also located at the perimeter of the structure but at the center of each face. In Case 4, the shear walls are located at the core of the structure. These different cases are described in detail in the following sections.
Without shear walls - Case 1: Figure 7 depicts the isometric (3-D) and the two-dimensional (2-D) views of the structure without shear walls, and Figure 8 shows the corresponding deformed shape typically obtained in this study for such a case (Figures 7,8).
With shear walls - Case 2: Figure 9 depicts the isometric (3-D) and the two-dimensional (2-D) views of the structure with shear walls located at the left edge of the structure faces, and Figure 10 shows the corresponding deformed shape typically obtained in this study for such a case (Figures 9,10).
With shear walls - Case 3: Figure 11 depicts the isometric (3-D) and the two-dimensional (2-D) views of the structure with shear walls located on the perimeter of the structure at the center of each of the four faces, and Figure 12 shows the corresponding deformed shape typically obtained in this study for such a case (Figures 11,12).
With shear walls - Case 4: Figure 13 depicts the isometric (3- D) and the two-dimensional (2-D) views of the structure with shear walls located at the core of the structure, and Figure 14 shows the corresponding deformed shape typically obtained in this study for such a case (Figures 13,14).
Numerical Comparison
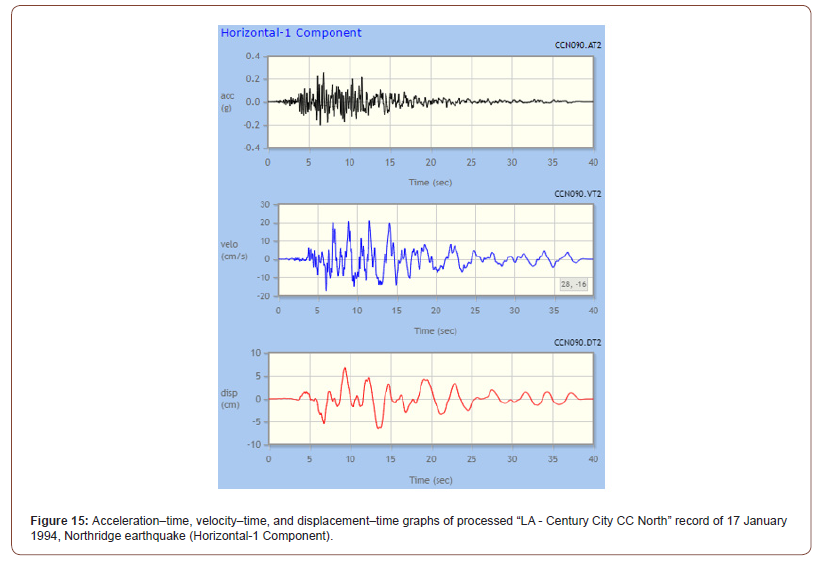
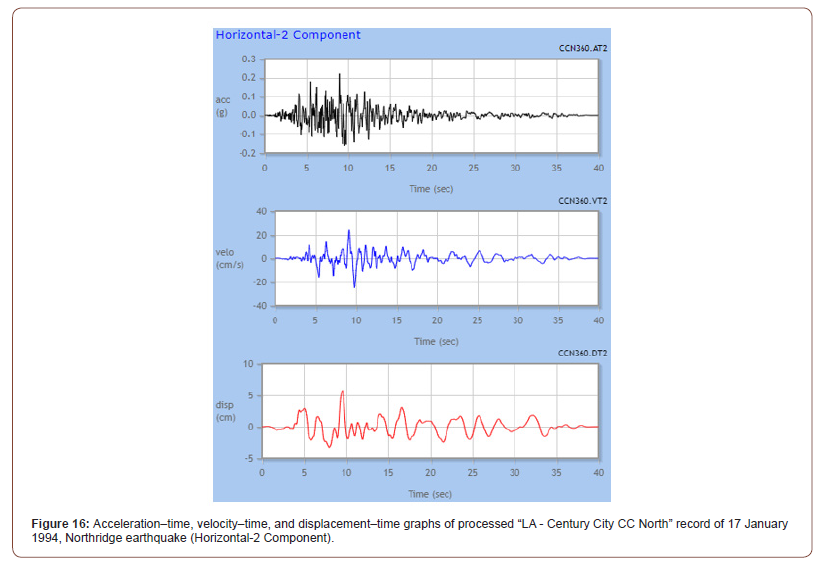
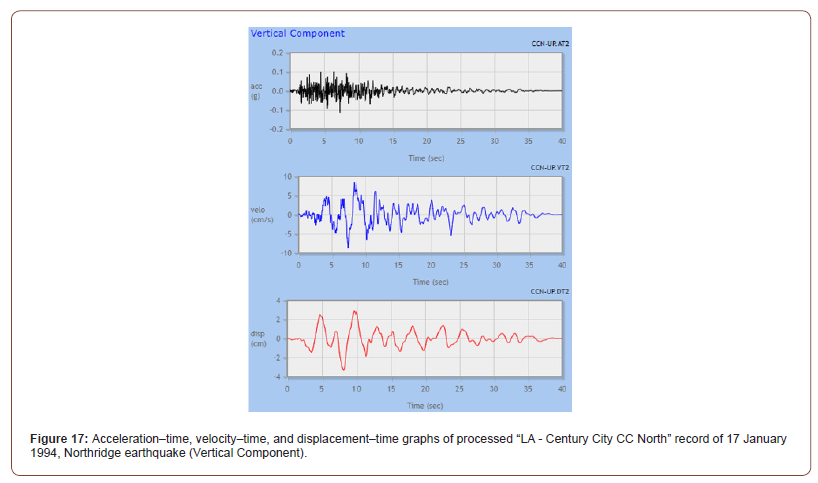
The presented results are the seismic demands obtained from an individual earthquake (1994 Northridge). The 1994 Northridge earthquake was used in this study as the source of dynamic excitation. Figure 15 shows the unscaled time series of the earthquake record Horizontal-1 Component, while Figure 16 shows the unscaled time series of its Horizontal-2 Component. Figure 17 shows the unscaled time series of the earthquake record Vertical Component. In the current research, the dynamic analysis was carried out using two different records of load time histories. Figures 18 & 19 depict the two records of the load time history (LACC_NOR-1.TH) and (LACC_NOR-2.TH), respectively (function graphs in the X and Y direction) (Figures 15-19).


Results
The tables below show results of the nonlinear time history analysis of the structure without shear walls as well as data analysis of the structures with shear walls in different locations (Tables 1-4).
Table:1Structural time period for nonlinear time history analysis without and with shear walls in different locations.

Table:2Structural frequency for nonlinear time history analysis without and with shear walls in different locations.

Table:3Design base shear for nonlinear time history analysis without and with shear walls in different locations.

Table:4Base moment for nonlinear time history analysis without and with shear walls.

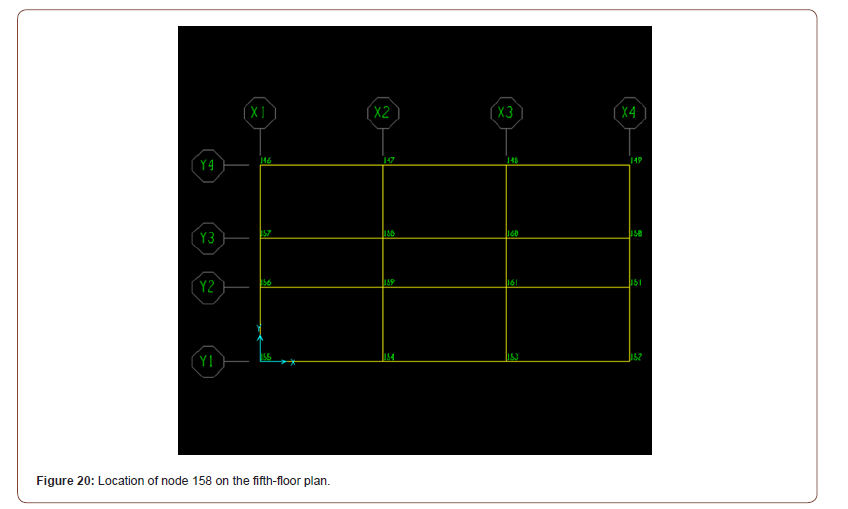
Table:5Drifts for nonlinear time history analysis without and with shear walls in different locations.
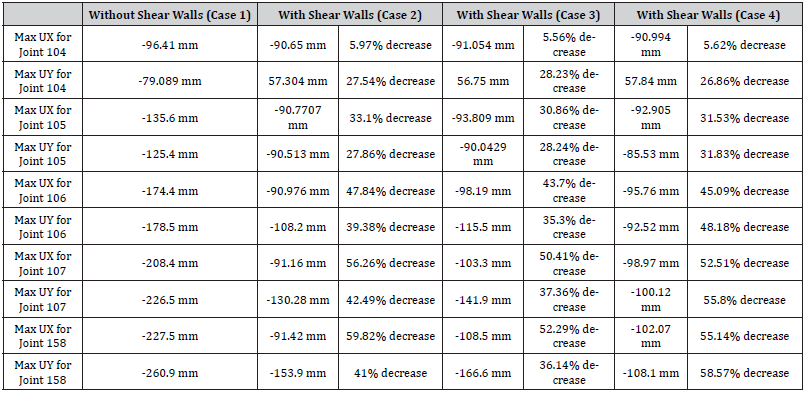
Tables 5 through 7 show maximum horizontal displacements and story drifts at specific nodes (joints) of the structural numerical model. These nodes are shown in Figure 20. Nodes 104, 105, 106, 107, and 158 are located on the X2-Y3 axis for Node 158 as shown in the figure. It is worth noting that in Cases 2 and 3, these nodes are far from the shear walls, while in Case 4, these nodes are inside the shear walls (Figure 20) (Tables 5-7).
Table:6Drifts for nonlinear time history analysis without and with shear walls in different locations.
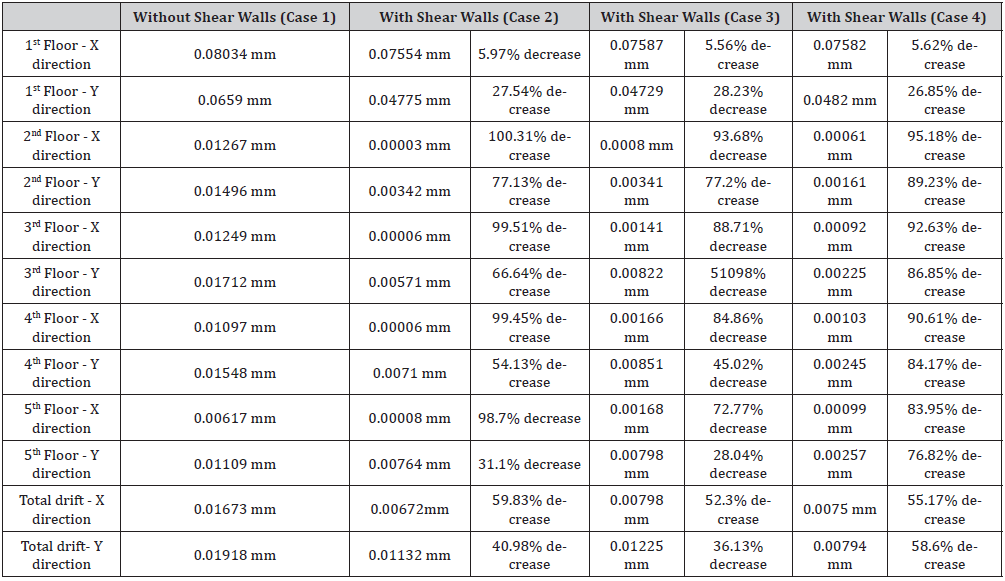
Table:7Total weight of building for nonlinear time history analysis without and with shear walls in different.

Table 7 shows that in terms of the total weight of the building, cases 3 and 4 have the same effects (about 60% heavier than Case 1). Case 2 is slightly lighter than Cases 3 and 4 (but still about 55% heavier than Case 1).
Interpretation of the Results
Tables 8 & 9 show the best behaviors of the structural time periods and frequency, respectively, in the five different modes among all cases with shear walls (Cases 2,3, and 4) and their comparison to the results the structure without shear walls (Case 1). For example, periods and frequencies of mode 1 were compared for Cases 2, 3, and 4; then, the best value (behavior) was selected and compared to Case 1 (values and corresponding percentage change) (Tables 8,9).
Table:8Structural time period comparison for nonlinear time history analysis by adding the shear walls in different locations.

It can be observed from Table 8 that adding shear walls to the structure in different locations leads to a decrease of the structural time period ranging between nearly 57.84% and 72.88%. Also, it can be concluded from Table 9 that adding shear walls to the structure in different locations leads results in an increase of the structural frequency ranging between nearly 137.23% and 213.2%. Table 10 shows the best behaviors of the structural design base shear in the X and Y directions for Case 2 (case of maximum absolute base shear value); This indicates that adding shear walls to the structure at these corresponding locations results in an increase of the structural design base shear in X and Y directions. Such increases will lead to a safer and more conservative design (Table 10).
Table:9Structural frequency comparison for nonlinear time history analysis by adding the shear walls in different locations.

Table:10Design base shear comparison for nonlinear time history analysis by adding the shear walls in different locations.

Table 11 shows the maximum absolute value of structural base moment in X and Y directions (Cases 2 and 4); This indicates that adding shear walls to the structure at these corresponding locations provides an increase of the structural base moment in X and Y directions. Such increases will also lead to a safer and more conservative design. The increased base moment has resulted in increased deformation capacity (Table 11).
Table 12 shows the maximum absolute horizontal displacements in X and Y directions and their corresponding shear wall case (location) (Table 12).
Table:11Base moment comparison for nonlinear time history analysis by adding the shear walls in different locations.

Table:12Maximum displacements comparison for nonlinear time history analysis by adding the shear walls in different locations.

As it can be seen in Table 12, the horizontal displacements are significantly decreased when the shear walls are added at the different locations. The addition of the shear walls causes a decrease in the joints maximum horizontal displacement in the X direction that ranges between 5.97% and 59.82%, and a decrease in joint maximum horizontal displacement in the Y direction ranging from 28.23% to 58.57%. These are considered significant improvements to the structure performance during such a powerful earthquake. Table 13 shows the maximum absolute structural drift in X and Y directions and their corresponding shear wall case (location) (Table 13).
Table:13Drifts comparison for nonlinear time history analysis by adding the shear walls in different locations.

As shown in Table 13, the decrease in floor drifts of the structure in the X direction ranges from 5.97% to 99.76%, and in the Y direction from 28.23% to 89.23%. These are considered significant improvements to the structure performance during such a powerful earthquake. When referring to Table 7, it is clear from the above results that the improvements in the structure seismic resistance and performance are quite beneficial in exchange for the increase in the building weight (59.52% when the shear walls are added (about 55% for Case 2, and 60% for Cases 3 and 4).
Conclusion
This study analyzed a structure with and without shear walls to determine the effects of shear walls and shear wall locations on a building’s response to a severe earthquake event (the 1994 Northridge earthquake was selected). Nonlinear modal time history analysis is also called Fast Nonlinear Analysis (FNA), which is more meticulous and effective than direct integration time history analysis. Response modal nonlinear time history analysis is conducted because it most accurately depicts the correct structural behavior. Structural frequency for various modes, design base shear, base moment, and total building weight increased with shear walls, while structural time periods for various modes, maximum story displacements, and story drifts decreased significantly with shear walls. Numerical values and maximum percentage of increase and decrease have been reported in the paper. Study results also showed that shear walls are required to resist lateral loads in a structure, and shear walls significantly affect individual framing members and lead to an increase in column base shear force (up to 135%) and column base moments (up to 320%), as well as a decrease horizontal displacement (up to 60%) and story drifts (up to 100%). It should be noted that maximum story drifts often govern the design according to most building codes.
Acknowledgment
None.
Conflict of Interest
No conflict of interest.
References
- Felber Andreas J (2017) Applied Time History Processing and Interpretation: Strong Motion Record Manipulation for Dynamic Analysis with Tips and Tricks for Data Evaluation. Vancouver, British Columbia: EDI Experimental Dynamic Investigations, Ltd.
- Moehle Jack P (2015) Seismic Design of Reinforced Concrete Buildings. New York: McGraw-Hill Education.
- Wight James K (2021) Reinforced Concrete: Mechanics and Design. Hoboken: Pearson.
- Chandurkar PP, Pajgade PS (2020) Seismic Analysis of RCC Building with and Without Shear Wall. International Journal of Modern Engineering Research (IJMER) 3(3): 1805–1810.
- Kurma Chandana, Siva Vignan G, Sai Krishna Teja T (2018) Non-Linear Analysis of Multistoried Building with and without Shear Wall. International Journal of Engineering Research & Technology (IJERT) 7: 23–28.
- Tidke Kiran, Rahul Patil, Gandhe GR (2016) Seismic Analysis of Building with and Without Shear Wall. International Journal of Innovative Research in Science, Engineering and Technology (IJIRSET) 5: 17852–17858.
- Sanjeev, Lokesh G, ahebgouda Patil, Lingaraj Shastri (2017) Dynamic Analysis of Multi Storied Building with and without Shear Wall and Bracing. GRD Journals- Global Research and Development Journal for Engineering 2: 44–51.
- Xiao Shaoping, Earthquake-Response Spectra. University of Iowa-College of Engineering.
-
Nader Zad, Dr. Hani Melhem. A Parametric Study on the Effects of Shear Wall Locations in a Typical Five-Story Reinforced Concrete Structure Subjected to a Severe Earthquake. Cur Trends Civil & Struct Eng. 7(5): 2021. CTCSE.MS.ID.000675.
-
Modal, Nonlinear, Time history, Dynamic analysis, Northridge, Reinforced concrete structure, Shear walls, SAP2000
-

This work is licensed under a Creative Commons Attribution-NonCommercial 4.0 International License.


