 Review Article
Twenty Strange Years in the World of Rock Mechanics and Engineering Geology
Nick Barton, Department of Rock Engineering, Nick Barton & Associates, Norway
Received Date:February 10, 2025; Published Date:February 19, 2025
Abstract
Those working in the hard, to moderately hard, rocky-end of our ‘geo’ subjects (as opposed to our nearer-surface soil specialists) inevitably have rather more challenging site investigation tasks prior to designing and optimizing tunnelling and mining projects. The geologic complexities of jointed and sometimes faulted rock masses cannot be readily sampled and tested in the way that soil, or concrete or steel can be brought into the test laboratories. The scope and manpower needs for the myriads of site investigations, designs and constructions are huge. This is clear if we include transport tunnels for road and rail, city metro when tunnels and stations are mostly in rock, hydropower and pumped storage projects, underground and open-pit mining projects, and major dam projects in steep-walled river valleys. All of them are expensive constructions and mostly in rock. There are therefore tens of thousands of geologists, engineering geologists and rock engineers involved, and hundreds of thousands perhaps millions developing and working in the related civil engineering and mining projects. Clearly this is a trillion-dollar industry as emphasized by the reality of a recent 2.5 billion dollar claim when things went badly wrong at a major hydropower project. This article focusses on the strengths and shortcomings of methods of rock mass description and modelling of tunnels, caverns and rock slopes. It addresses in particular the problems with the Hoek-Brown GSI (geological strength index) and its widespread application in unrealistic but simply performed continuum models. These are colouful productions but are misleading our students and likely misleading the owners who pay for cut-price analyses. A radical rethink is needed if rock engineering design is to be of actual use to our numerous clients.
Rock Mass Characterization Methods RMR, Q and GSI
Because of the difficulty of testing rock masses at sufficient scale it has been common practice for the last 50 years to use quantitative rock mass characterization methods. Following an earlier Terzaghi method for steel-arch supported tunnels that originated in the USA when steel was cheap, the three most commonly used ‘western’ methods (among at least 35 other proposals: Erharter et al. [1]) have been Bieniawski’s RMR (rock mass rating) originating in 1973, Barton’s Q-system (quality, or lack of quality) originating in 1974, and Hoek’s GSI (geological strength index) originating in 1994. RMR and GSI share a more or less equal numeric range of about 5 to 95 and have a ‘joint condition’ description in common, adapted from Bieniawski,1989.
The Q-value scale by comparison stretches from 0.001 (exceptionally poor) to 1000 (exceptionally good) and is designed to more easily reflect the orders of magnitude ranges of shear strength, deformability and permeability of rock masses. According to a recent international review using several hundred respondents from numerous countries [1] the Q-system is the most frequently used rock mass characterization method around the world for underground projects. It provides rock quality classes, for instance based on core-logging, and supplies tunnel and cavern support recommendations, plus some stope stability numbers used in designing large mining excavations. It has also been adapted for TBM prognosis (QTBM) and for selecting stable rock slope angles (QSLOPE). It has been simply linked to tunnel deformation, to tunnel support pressure, to the cost and duration of tunnelling, and to depth-dependent permeability, P-wave velocity, and deformability. Each of the above were summarized recently in a keynote paper with key co-authors [2].
GSI as compared to Q or RMR is an ultra-simple numeric characterization of the rock mass quality followed by application of the GSI rating in the ultra-complex Hoek-Brown equations that supposedly link GSI to the cohesive and frictional strength of rock masses if they could be simplified as isotropic continua (i.e. unjointed and unfaulted). Estimates of the apparent unconfined compressive strength of the ‘continuum’ rock masses and their assumed deformation modulus are also provided using GSI. Unfortunately, despite wide-spread use in many countries for the last two decades, and strong and successful marketing by a Canadian software company who have mostly specialized in FEM analyses of continua, it turns out that the estimated rock mass quality (or geologic strength index rating GSI) is utilized a remarkable 16 times in the Hoek-Brown (Hoek et al. 2002) equation for the Mohr- Coulomb parameter ‘c’ (cohesion), also 12 times in the H-B equation for friction angle ‘ϕ’ and 10 times for the estimate of uniaxial strength ‘σcm’. To add to this uncertainty and ambiguity there is a disturbance factor D that appears 7 times and 6 times in the H-B equations for ‘c’ and ‘ϕ’. As readers might imagine, any ‘error’ in the GSI estimate is inevitably amplified with this extraordinary over-use of GSI in key input data, making the subsequent numerical analyses of questionable value. Yet GSI has been used by thousands and is taught in university courses alongside RMR and Q and other subjects of rock mechanics theory and practice.
The Distribution of Rock Mass Classification and Characterization
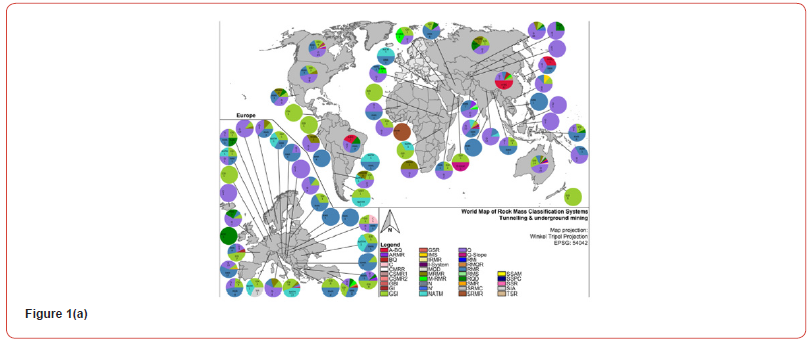
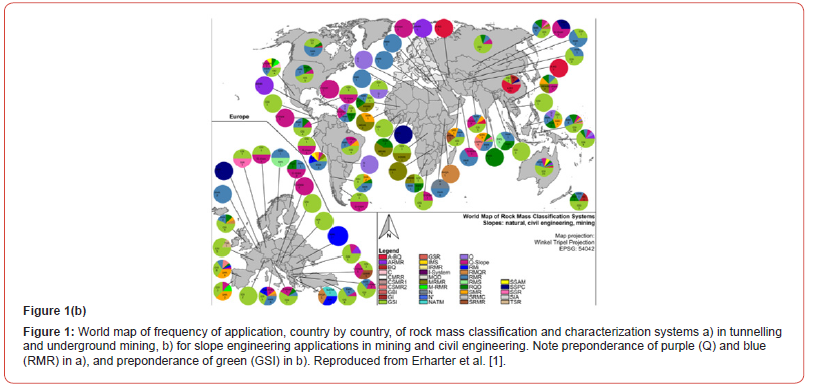
As will be seen when studying Figures 1a &1b, reproduced from Erharter et al. [1], the distribution of rock mass characterization methods is quite different for underground and surface applications. This is linked of course with the fact that Hoek’s GSI does not provide tunnel support recommendations. It is instead strongly linked to providing estimates of input parameters for FEM modelling, usually for modelling tunnels or rock slopes as continua.
The Surprising Over-Exposure of GSI in Hoek- Brown Equations
It is possible to imagine that many readers think they have misunderstood what was written above, about GSI’s multiple use in key equations that thousands are using in numerical models. This is because it is clearly absurd and spreads uncertainty. The writer of this article, for instance, developed a commonly used equation for the peak shear strength of rock joints [3] which includes the parameters JRC (joint roughness coefficient) and JCS (joint wall strength). These readily obtained, meaningful index numbers are used to calculate the role of joint roughness caused by the interlock of asperities. So now imagine that the peak friction angle thus obtained (say 42°) needed JRC to appear 16 times, and JCS to appear 12 times in ‘a page-wide’ Barton equation for shear strength to obtain this value of 42°. The profession would not have taken any of this seriously, and the writer’s ‘absurd equation’ would have immediately disappeared without trace fifty years ago. However, as it is in fact a simple and logical equation, it is still used in modelling, such as in Itasca’s and Cundall’s UDEC, known as UDEC-BB since 1985. (BB stands for Barton-Bandis: see later).

Note that JRC and JCS appear just once as is conventional. The Hoek-Brown equations that are proposed for estimating the stressdependent values of ‘c’ and ‘ϕ’ for rock masses have an absurd level of repetition of GSI as can be seen in Figure 2. Sadly for our profession they are used by thousands who are perhaps unaware of what is coded in rented commercial software. They just select values for: mi s a σci D GSI and confining pressure, and the software gives them input for colourful FEM stress, deformation and ‘plastic zone’ plots.
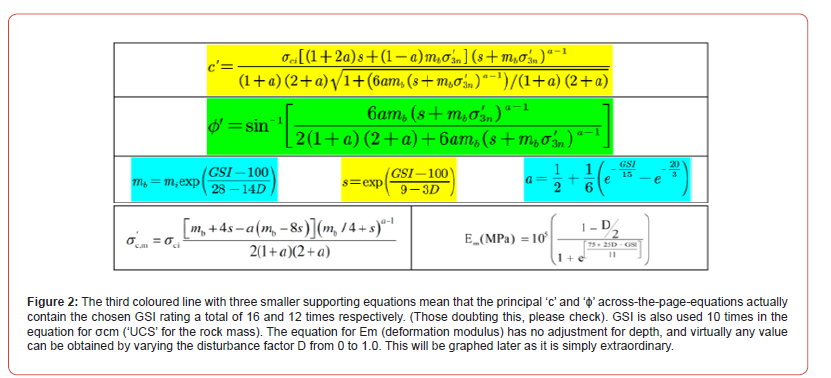
One can only wonder at the consequences of ‘an error’ in GSI (itself a very weak parameter) since it will appear 16 and 12 times in these two principal equations. Worse still, rock masses do not reach failure by the H-B assumed Mohr-Coulomb-based addition of ‘c’ and σn tan ‘ϕ’. The cohesion (for instance of intact bridges between rock joints) is overcome at smaller strain than the mobilization of ‘friction which remains’, as correctly stated by Müller, 1966 a long time ago. Most individuals and even software companies are continuing to make the classic modelling error of adding the ‘c’ and ‘ϕ’ components. This is not how jointed rock masses fail. A more correct progressive failure model (CcSs) will be shown later.
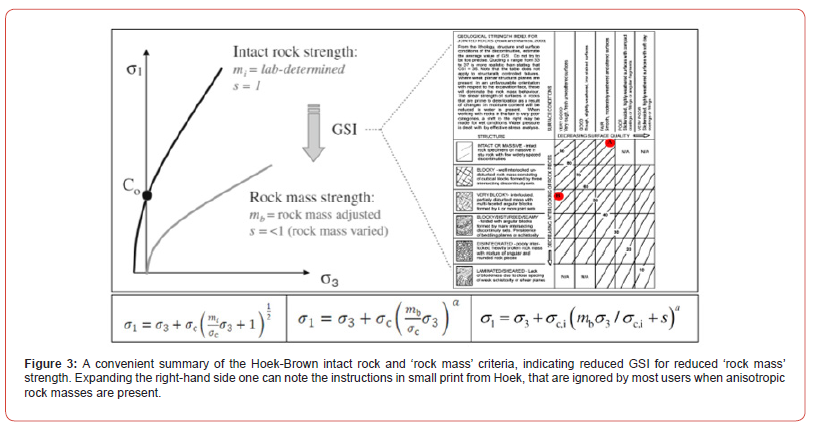
The GSI-rating selection scheme shown in Figure 3 is based on a brief encounter with ‘geology’ (the sketches) followed by what could truly be called black-box modelling. With reference to the (Bieniawski) x-axis on the GSI chart, why does slickensiding have to be ‘highly weathered’ and with clay-filling? Why cannot rougher joints have clay filling and be weathered as they of course can be in reality, and in the Q-system? GSI is actually the least ‘geo-logical’ method in use in rock engineering. Yet it is used by thousands since ‘simple’.
One may wonder why the profession has adopted a modified intact rock strength equation and assumed it applies to rock masses which are so very different from the numerous but very small intact rock triaxial test samples of approximately 30 cm3 volume that were utilized in the original (and genuinely empirical) intact rock criterion. The writer had always assumed that the lab-determined mi was an important part of the intact rock H-B strength criterion. Recently, the range of mi for sandstone is reported to be from 4 to 35, for limestone from 4.5 to 40, for shale 3.7 to 25, for slate 1.4 to 31, and for gneiss 5.3 to 32 [4]. One can then wonder if mb (see Figure 2) is also only poorly linked to rock type. Despite this, GSI use continues world-wide.
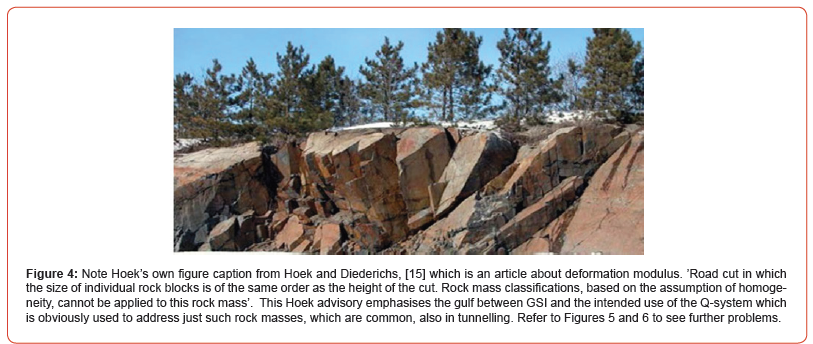
The Hoek instructions about ‘homogeneity’ given in the Figure 4 caption can never apply to the Q-system since rock masses are often anisotropic [5], therefore starting with RQD (used for core logging). The usually anisotropic rock mass structure’s least favourable pair of Jr and Ja is applied to the least favourable joint set or clay-filled discontinuity when evaluating the simple equation for Q. (Note that RQD/Jn represents relative block size, and tan-1 Jr/Ja represents inter-block frictional strength):

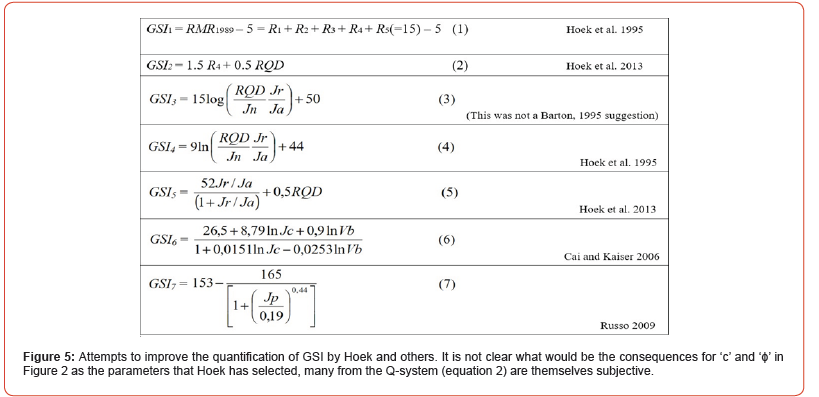
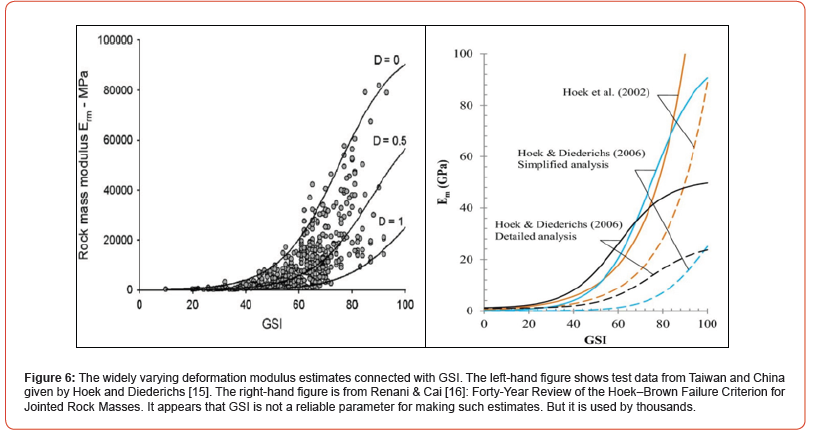
One may seriously ask how continuum modelers are choosing deformation modulus. Perhaps by waiting for the results of the modelling and adjusting the disturbance factor D? Several private communications to the writer have stated such, and if this is so it seems hardly a defensible method for developing and presenting modelling results to a client.
The Contrasting Worlds of Continuum and Discontinuum Modelling
A good introduction to the contrasts is given by the Figure 7 modelling results, which were produced before GSI existed. Both modelling methods: FLAC and UDEC are the result of Peter Cundall’s important developments, marketed successfully by Itasca.
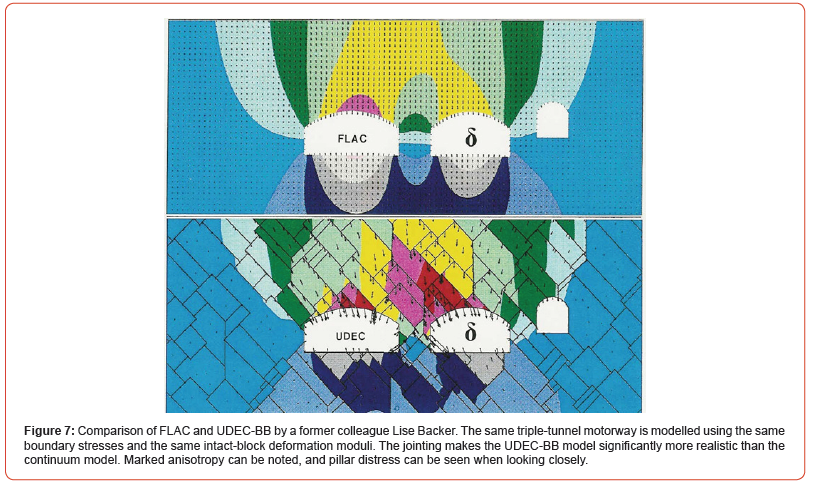
Many designers have been using continuum modelling for their tunnel studies. Most have presumably accepted that when their models plot plastic zones, they need to take note and perhaps suggest longer rock bolts. (Usually not correct but understood). In fact the Rocscience modelling package of Phase 2 FEM (today RS2) using GSI and H-B formulations (Figure 2) was proved in an international court case to be providing grossly exaggerated ‘plastic’ zones. These were claimed to be of 10m to 14m diameter in relation to a 3.5m span pressure tunnel which was driven for 7km without the need for shotcrete support. The court case arose due to a claim against the contractor for ‘an insufficiently supported’ tunnel. In fact, only the invert had been damaged by a much too fast drainage (20m/hour) when those monitoring strains in the penstock became worried and asked for fast emptying. Six nations were involved in this landmark court case. Figure 8 suggests how to select more appropriate modelling methods.
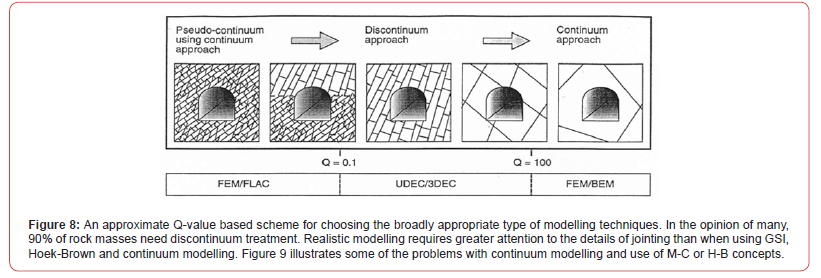
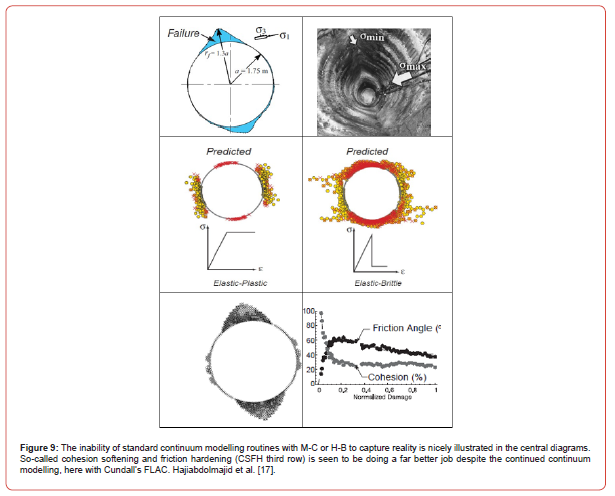
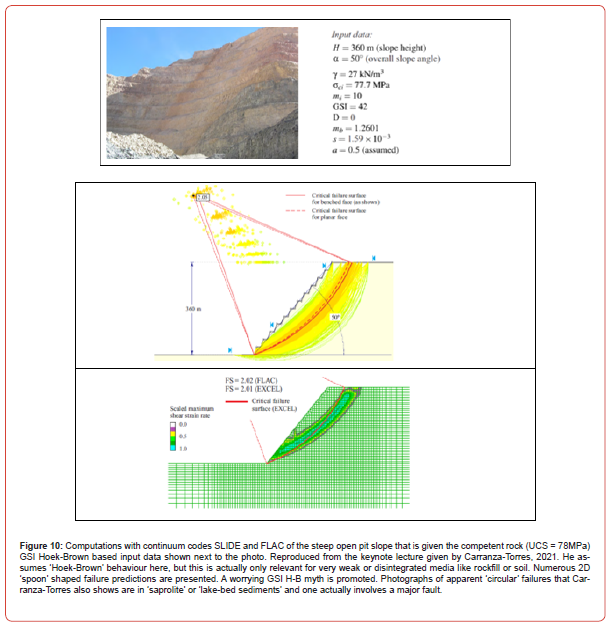
It is in fact the continuum modelling of rock slopes that most clearly reveals the incorrect nature of the GSI H-B modelling scheme because there is visual evidence of reality which is mostly ‘hidden’ around tunnels. The problem is the thousands of published but hardly ever observed ‘circular’ or ‘spoon-shaped’ failures that the modelers presumably feel comfortable with since rock mechanics literature is full of such. Reality is usually different, with joint sets and faults being involved and the possibility of monitoring the usually progressive actual failures. Rock masses do not fail ‘with the click of a finger’ suggested by the Mohr-Coulomb or Hoek-Brown addition of the ‘c’ and ‘σn tan ϕ’ components, linear (M-C) or nonlinear (H-B). Let us examine an extract from a well-written (but continuum-based) keynote paper: Figure 10.
A more recent strain-softening model that includes cohesion weakening and frictional hardening (CSFH) is the Itasca Model for Advanced Strain-Softening (IMASS) introduced by Ghazvinian et al. 2020. IMASS was developed to represent a weak rock mass’s response to stress changes (i.e., rock mass yield, modulus softening, density adjustment, dilation, cohesion weakening, and frictional strengthening). A basic assumption is that the peak strength envelope is similar to the post-peak envelope for the case of very weak rock masses. In other words, it is assumed that the rock mass is already damaged, resulting in ductile behavior. A shear strength equation for rockfill [6] is incorporated. The IMASS model is being increasingly implemented where large strain and ductile behavior is expected in the case of open pits with poor rock mass conditions (e.g. Cacino et al. [7]).
Discontinuum Modelling when this is more Appropriate
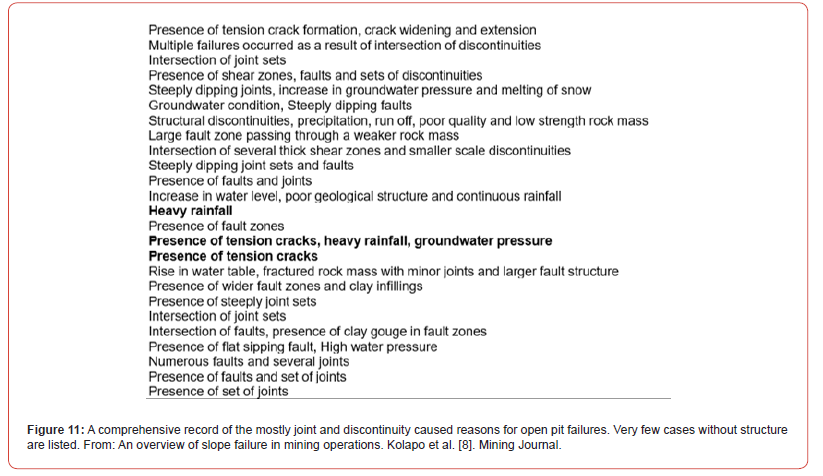
A recent study of open-pit failures from many countries by Kolapo et al. [8] has shown a great dominance of discontinuity or joint related causes. Their compilation, which is reproduced in Figure 11, has only been modified by highlighting the cases where natural joints or faults or shear zones are not specifically reported. Perhaps the first case should also have been highlighted.
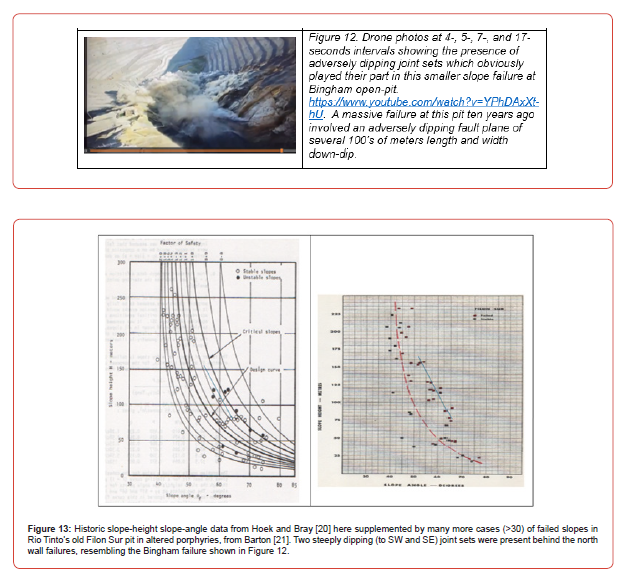
In Figure 12 ‘stills’ are reproduced from a drone video sequence that helps to illustrate the very frequent presence of joints and/or faults that are usually registered when open-pit slope failures are investigated. Figure 13 caption shows slope height-angle data from an open pit which also had steep joints.

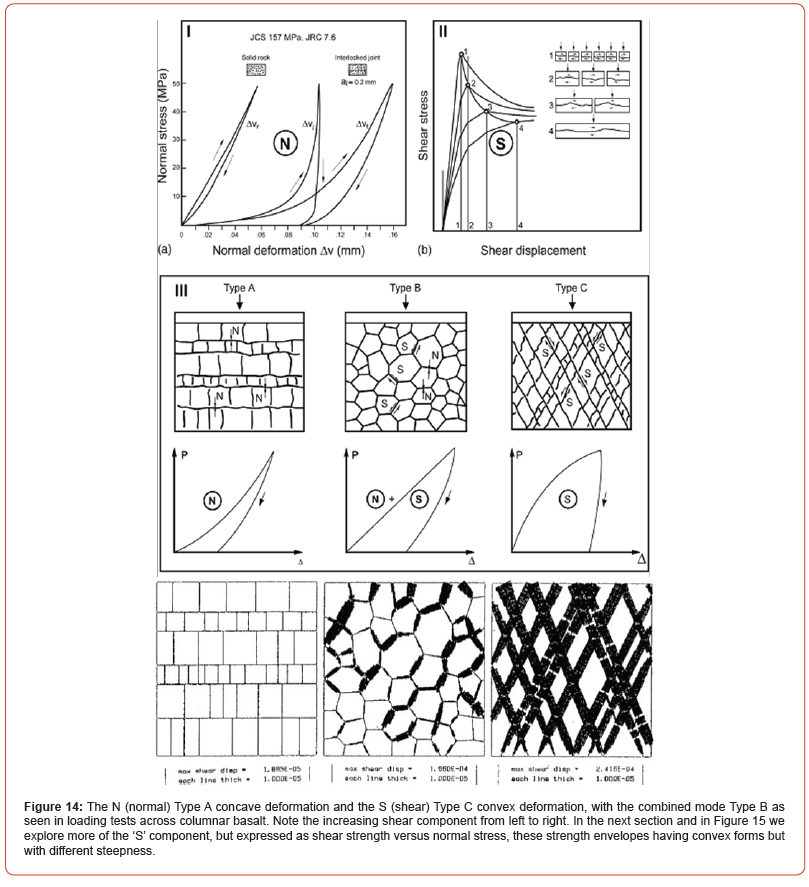
In Figure 14 the two principal stress-deformation components for rock joints that differentiate discontinuum from continuum modelling are shown. The very frequent presence of rock joints, in fact sets of intersecting rock joints, is what often differentiates the reality from the GSI-based assumption of homogeneity with no joints modelled once the GSI value is chosen (Figure 3) and ambiguous H-B equations are ‘mobilized’ in FEM.
The normal stress-closure curves (N) for real rock joints shown in Figure 14 are from Bandis et al. 1983, and the shear stressdisplacement curves (S with scale effects) are from Bandis et al. [9]. The N, N+S and S load-deformation trends for the three imaginary ‘plate-loaded’ rock mass assemblies are from Barton, 1986.
Chryssanthakis et al. [10] matched the three styles of deformation using UDEC-BB after this code became available in 1985. The relative lack of shear (left), combined shear and closure (N+S) for the basalt columns, and greatly dominating shear (S) in the case of the conjugate jointing serve as illustration of serious differences between what we learn from discontinuum and continuum codes. The concave, linear and convex P vs Δ modes have each been recorded in large-scale plate-loading or flatjackloading in situ tests in tunnels [11].
Realities of Progressive Failure: Rock Mass Shear Strength Components
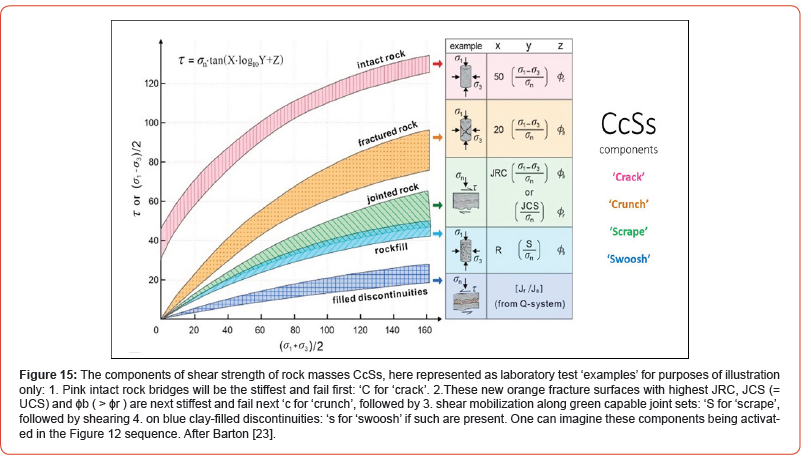
It would not be possible to monitor a potential rock slope failure, as is common practice in large open-pits, if Mohr-Coulomb or Hoek- Brown had been relevant models. These widely used methods represent shear failure assuming ‘click-of-the-fingers simultaneous ‘c plus σn tan ϕ’ mobilization and are the source of major errors in our subject. Perhaps they are appropriate for soil, sand or rockfill. Shear failure in rock masses is actually process-dependent, because it is shearing strain / shear displacement dependent, as described in four stages in the Figure 15 caption.
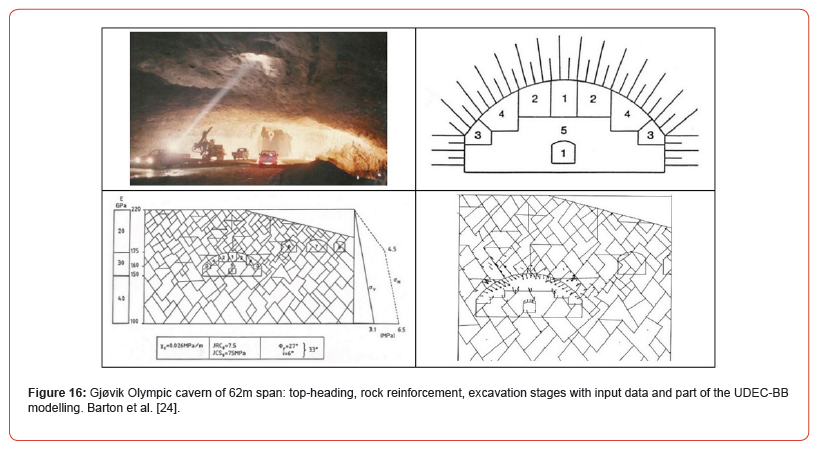
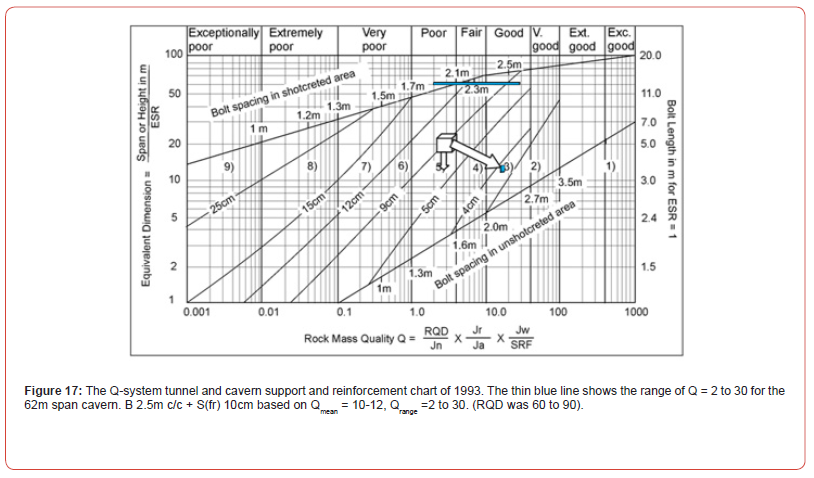
The Barton-Bandis shear strength criterion in UDEC-BB has displacement dependent mobilization and degradation of JRC, and corresponding adjustment of physical and hydraulic joint apertures. It also has built-in scaling of shear strength in relation to block size – specifically the spacing of cross-jointing for the relevant joint set. Figure 16 is an example of UDEC-BB application for design checks of the Gjøvik cavern of 62m span. We see the wide ‘topheading’ (excavation stages 1 through 5) and the well-controlled deformation assisted by quite high horizontal stress. Seven MPBX extensometers showed maximum deformations in the 7 to 8mm range, almost identical to the modelling. The location of the cavern on the Q-system support chart of 1993 developed by Grimstad is shown in Figure 17. See Barton et al. [1] for the details of tunnel and cavern Q-based support and its updating.
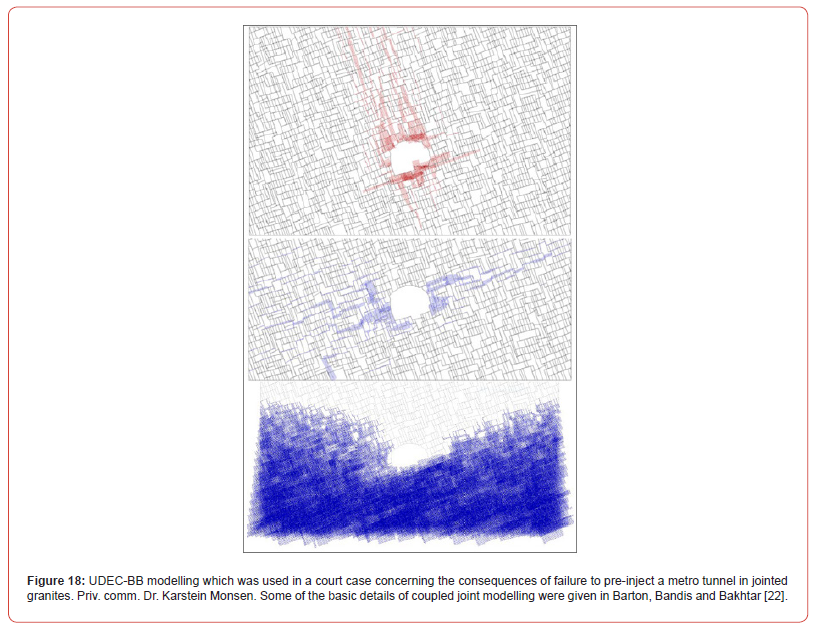
A result which can be obtained with distinct element modelling but obviously not with continuum modelling is illustrated in Figure 18. It depicts UDEC-BB modelling of a metro tunnel that should have been pre-injected by the contractor. Principal shearing (red) and inflow (blue) are shown on different joint sets due to JRC differences causing lower shear strength, or larger joint apertures respectively. A wedge in the floor is removed so that the locally outsize deformation and inflows do not disturb the graphics. The dark blue is of course drawdown of the modelled water in the two joint sets. Models that give valuable insight obviously take much longer than Figure 7a.
Conclusions
a. Unfortunately, and surprisingly the simple but misleading GSI
number for ‘rock mass quality’ (the ‘geological strength index’)
appears respectively 16, 12 and 10 times in the Hoek-Brown
equations for the presumed shear strength of rock masses for
‘c’ and ‘ϕ’ and ‘σcm’. This is because of the three supporting
equations for mb s, and a. These include the disturbance factor
D, which is poorly quantified yet also appears 7 and 6 times in
the H-B equations for presumed rock mass ‘c’ and ‘ϕ’.
b. It means presumably that errors of judgement in selecting
an appropriate GSI value (and D value) will be amplified in
the estimates of H-B ‘c’, ‘ϕ’, ‘σ cm ‘and ‘Em.’ The latter has no
adjustment for depth or stress level so is often incorrect.
c. Rock masses are most often jointed and faulted and anisotropic
so modelling as if isotropic continua is a highly suspect
approximation. An international court case has proved that the
GSI, H-B, FEM modelling that is used by so many exaggerates
the dimension of yield zones commonly known as ‘plastic
zones’.
d. It is well known by those with slope stability experience
in open pit mines that unless the rock is extremely weak or
intensely fractured and altered or weathered it does not fail
in the form of circular or spoon shaped surfaces. Capable joint
sets perhaps with individual fault planes as relief surfaces are
the most common form of failure and major wedge failures
tend to dominate as a result.
e. The simultaneous addition of ‘c’ and ‘σn tan ϕ’ as in classic
linear Mohr-Coulomb, and in non-linear Hoek-Brown is
basically an erroneous calculation method because the cohesive
component has higher stiffness and attracts the highest shear
stresses and fails first, if at all. This is followed by mobilization
of friction. Cohesion softening and friction hardening CSFH is
fundamentally more correct, but a more comprehensive model
that allows for true progressive failure is CcSs.
References
- Erharter GH, N Bar, TF Hansen S Jain, T Marcher (2024) International Distribution and Development of Rock Mass Classification: A Review. Rock Mechanics and Rock Engineering.
- Barton N, E Grimstad, R Abrahão, N Bar (2024) Celebrating 50 years of Q system development for infrastructure design and follow-up. Proc. ISRM symp. New Dehli, Keynote lecture pp. 37.
- Barton N (1973) Review of a new shear strength criterion for rock joints, Engineering Geology, Elsevier, Amsterdam 7: 287-332.
- Davarpanah SM, Sharghi M, Vasarhelyi B, Á Török (2022) Characterization of Hoek–Brown constant mi of quasi-isotropic intact rock using rigidity index approach. Acta Geotechnica 17: 877–902.
- Barton N, E Quadros (2015) Anisotropy is everywhere, to see, to measure and to model. Rock Mechanics and Rock Engineering 48: 1323-1339.
- Barton N (2008) Shear strength of rockfill, interfaces and rock joints and their points of contact in rock dump design. Keynote lecture, Workshop on Rock Dumps for Mining, Perth.
- Cancino C, L Lorig J Bu, N Bar (2024) Back-analysis for more reliable mine plans at Pueblo Viejo Gold Mine. Slope Stability, Belo Horizonte, Brazil pp. 13.
- Kolapo P, G Oniyide KO Said, AI Lawal, M Onifade (2022) An overview of slope failure in mining operations. Mining Journal 2(2): 350-384.
- Bandis S, Lumsden A, Barton N (1981) Experimental studies of scale effects on the shear behaviour of rock joints. Int. J. Rock Mech Min Sci and Geomech Abstr 18: 1-21.
- Chryssanthakis P, Monsen K, Barton N (1991) Tunnelling in jointed rock simulated in a computer. (In Norwegian). Tunneller og Undergrunnslanlegg, NTNF, Oslo pp. 23-28.
- Barton N (1986) Deformation phenomena in jointed rock. 8th Laurits Bjerrum Memorial Lecture, Oslo. Geotechnique 36(2): 147-167.
- Bieniawski ZT (1989) Engineering Rock Mass Classifications: A Complete Manual for Engineers and Geologists in Mining, Civil, and Petroleum Engineering, New York, Wiley pp. 272.
- Hoek EC, Carranza Torres, B Corkum (2002) Hoek-Brown failure criterion – 2002 Edition. Proc. NARMS-TAC Conference, Toronto 1: 267-273.
- Müller L (1966) The progressive failure in jointed media. (In German). Proc. of ISRM Cong, Lisbon 3(74): 679-686.
- Hoek E, MS Diederichs (2006) Empirical estimation of rock mass modulus E. International Journal of Rock Mechanics & Mining Sciences 43: 203–215.
- Renani HR, M Cai (2021) Forty-Year Review of the Hoek–Brown Failure Criterion for Jointed Rock Masses. Rock Mech. and Rock Eng 55(4):1-23.
- Hajiabdolmajid V, CD Martin, PK Kaiser (2000) Modelling brittle failure. Proc. 4th North American Rock Mechanics Symposium, NARMS Seattle J Girard, M Liebman, C Breeds, T Doe (Eds.), pp. 991-998.
- Carranza Torres C (2021) Computational tools for the analysis of circular failure of rock slopes. Keynote Lecture. In Proceedings of EUROCK 2021, Torino, Italy.
- Ghazvinian E, Garza Cruz T, Bouzeran L, Fuenzalida M, Cheng Z, et al. (2020) Theory and Implementation of the Itasca Model for Advanced Strain Softening (IMASS). MassMin (2020), Proc 8th Int Conf & Exhib. on Mass Mining, Virtual Conference, Santiago, Univ of Chile, pp. 451-461.
- Hoek E, JW Bray (1976) Rock Slope Engineering. Institution of Mining and Metallurgy. 2nd Edition, pp. 402.
- Barton NR (1971) A model study of the behaviour of steep excavated rock slopes. PhD thesis, Imperial College, Univ of London, UK pp. 377.
- Bandis S, Lumsden AC, Barton N (1983) Fundamentals of rock joint deformation. Int J Rock Mech Min Sci and Geomech. Abstr 20(6): 249-268.
- Barton N (1999) General report concerning some 20th Century lessons and 21st Century challenges in applied rock mechanics, safety and control of the environment. Proc. of 9th ISRM Congress, Paris, Balkema, Netherlands 3: 1659-1679.
- Barton N, By TL, Chryssanthakis P, Tunbridge L, Kristiansen J, et al. (1994) Predicted and measured performance of the 62m span Norwegian Olympic Ice Hockey Cavern at Gjø Int J Rock Mech Min Sci Geomech Abstr 31(6): 617-641.
-
Nick Barton*. Twenty Strange Years in the World of Rock Mechanics and Engineering Geology. Cur Trends Civil & Struct Eng. 11(4): 2025. CTCSE.MS.ID.000768.
-
:Rock Mechanics; Engineering Geology; rock slope angles; cohesion weakening; Iris Publishers; Iris Publishers Group
-

This work is licensed under a Creative Commons Attribution-NonCommercial 4.0 International License.


