


 Research Article
Thermal and Chemical Validation of the Compatibility of Virgin and Recycled Asphalt Binders
Received Date:June 10, 2024; Published Date:June 25, 2024
Abstract
It has been decades since recycled asphalt shingles (RAS) or reclaimed asphalt pavement (RAP) were utilized in asphalt mixes. The compatibility of the recycled binder included in RAP or RAS and the virgin asphalt binder (VAB) is crucial to the performance of the total binder-recycled binder and VAB-in asphalt mixes. Thus, asphalt binders were extracted from four Superpave asphalt mixes: Twelve field and twelve plant mixes. RAP or RAS, as well as VABs of various performance grades, were encompassed in these mixes. Different manufacturing practices were used in the field and plant mixtures: Plant mixes were gathered behind the paver during construction, and field mixes were taken as cores two weeks later. The plant mixtures had been reheated in the laboratory before being compacted with a Superpave gyratory compactor. Rheological testing, thermal analysis, and chemical analysis were conducted to investigate the compatibility of VABs and recycled binders for extracted asphalt binders and short-term aged VABs. Rheological analysis revealed the compatibility of polymeric components and asphalt binders; however, thermal and chemical analyses gave insight into the compatibility of the binders’ fractions. Understanding these analyses provides a perspective on the compatibility of recycled binders and VABs, which influences the total binder performance.
Keywords:Compatibility; RAP; RAS; TGA; FTIR; colloidal instability index; asphaltene index
Introduction
Regarding asphalt binder, compatibility, also known as stability, represents the balance of soluble and insoluble components of a colloid that governs its flow qualities [1]. Asphalt binders are micellar systems or colloidal made up of asphaltenes suspended in maltenes (saturates, aromatics, and resins) [2,3]. Thus, asphalt binder is composed of four fractions: Saturates, aromatics, resins, and asphaltenes (SARA). The balance of asphalt fractions has been linked to durability, performance, and physical characteristics, which is widely used as compatibility proof [4]. Furthermore, the solubility of two asphalt binders can be used to determine their compatibility [5]. Binder compatibility deteriorates with aging due to the volatilization of lighter oils in the asphalt and the increase in asphaltene level caused by binder oxidation. A more compatible asphalt binder has more soluble (lighter) fractions, making it softer and more ductile [1,4,5]. Compatibility is crucial for polymer-modified asphalt, affecting stability and phase separation. Compatibility refers to the interaction degree between asphalt and polymers [6]. Discussing recycled binders, it is reasonable to infer that the binder in reclaimed asphalt binder (RAP) is mobilized if a virgin asphalt binder (VAB) is completely or to a certain extent soluble in RAP binder or contrariwise [5]. For asphalt mixes with RAP, if the RAP binder is entirely soluble in the VAB, the RAP binder is mobilized throughout the mixing process and compatibility is achieved. Nonetheless, assuming complete blending and mobilization when there is incompatibility and partial solubility between recycled and virgin binder is problematic [7].
In the NCHRP D9-12, McDaniel et al. [8] classified the blending between the RAP binder and the VAB into 3 types: No blending, the RAP being treated as black rocks, complete or 100 percent blending, and partial blending. Most investigations have found that the RAP binder is partially mobilized and blended during the mixing stage [8-10]. Furthermore, it has been demonstrated that the degree of RAP/VAB blending and mobilization is varied and depends on internal and external parameters. External parameters include the mixing temperature, the duration spent at that temperature (mixing time), the mixing method, and the percentage of RAP [5,7,11]; however, the compatibility of the RAP binder and VAB is an internal parameter [7]. Increasing the proportion of RAP in mixes maximized the interactions between the RAP binder and VAB [12]. Reheating plant-fabricated lab-compacted mixes in the lab before the compaction process increased the interaction between the recycled binders and VABs and boosted the exchanged components in these mixes compared to the same mixes gathered from the field without reheating [13]. By introducing a rejuvenator to an aged binder, the inter-diffusion rate between VAB and aged binder may be enhanced to its maximum level, increasing recycling efficiency [14]. This agreed with a previous study conducted by Deef-Allah and Abdelrahman [12], Evoflex, as a rejuvenator, boosted the interaction between the VAB and RAP binder by raising the contribution of the RAP binder in the mixes.
Measuring the compatibility of modified asphalt binders directly is challenging [6]; however, the compatibility of the modified asphalt binders was judged rheologically. Based on prior studies [15,16], Han plots and black diagrams, along with the Cole- Cole plot, were chosen to investigate the compatibility of polymermodified asphalt [6,16-18]. Han plot reflects the relationship between the components of complex shear modulus (|G*|)- viscous or loss modulus (Gʺ) and elastic or storage modulus (Gʹ) [16-18] while the black diagram indicates the relationship between the |G*| and phase angle (δ) [16]. Cole-Cole plots were used to detect the compatibility of polymer-modified asphalt by analyzing the relationship between the components of complex viscosity (η* = ηʹ + iηʺ) in the complex plane (ηʹ, ηʺ) [16,19,20]. Cole-Cole plots have been regularly used to investigate polymer-modified asphalt compatibility [16], and these plots were shown to be the most practical approach for determining compatibility with polymermodified asphalt [16]. The presence of symmetrical parabolas has been seen as confirmation of compatibility, with any variation from this symmetry being linked to incompatibility for polymermodified asphalt [15,16,19,21].
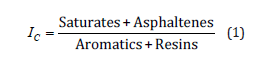
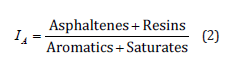
Compatibility of modified asphalt binders can be validated chemically. The colloidal instability index (IC)-developed by Gaestel [22]-indicates the colloidal stability of asphalt binders [22]. The lowest and highest polarity components of an asphalt binder are saturates and asphaltenes, respectively. The presence of intermediate polarity components such as aromatics and resins improves the solubility of asphaltenes in a colloidal system. As a result, as the IC increases, the asphalt binder’s system becomes less stable [23]. Also, the asphaltene index (IA) defines the changing rate of asphaltene’s content [24] and can be used to reflect changes that occurred in asphalt compatibility. Limited to no thermal analyses of asphalt binders were conducted and related to the compatibility. Therefore, the major purpose of this study was to confirm the compatibility of virgin and recycled asphalt binders rheologically. The results are then linked to the chemical analysis using Fourier Transform Infrared (FTIR) qualitative and quantitative analyses. Additionally, the Ic and IA chemical indices were assessed and correlated with the other findings. Finally, thermal verdicts of asphalt binders were conducted and linked to compatibility findings derived from rheological and chemical measurements.
Materials and Methods
Materials
Four asphalt mixtures were designed and produced following Superpave, each of which was manufactured in a drum-mix plant in Missouri. Throughout construction, twelve plant mixes were gathered; these plant mixes constituted four asphalt mixes, as presented in Table 1. Before separation, the plant mixtures were warmed to 100±5 °C in the laboratory, then heated to the needed temperature for compaction as indicated in the job mix formula (JMF) and compacted via a gyratory compactor. After two weeks of the construction technique’s discontinuation, cores were obtained from twelve field mixes, all of which exemplified the same four asphalt mixes displayed in Table 1. RAS or RAP existed in each of the four asphalt mixtures. Table 1 shows the asphalt binder replacement (ABR) using RAS or RAP. Table 1 also exhibits the total asphalt content (AC) percentage of total mass, which includes VABs and recycled binders (as represented in the JMF), as well as the performance grades (PGs) of VABs, and additives.
Table: Descriptions of asphalt mixtures.

ABR: Asphalt binder replacement; AC: Asphalt content; RAP: Reclaimed asphalt pavement; RAS: Recycled asphalt shingles; VAB’s PG: Virgin asphalt binder’s performance grade; a Anti-stripping agent (Morelife T280); b Anti-stripping agent (IPC-70); c Warm-mix additive (PC 2106); d Warm-mix additive (Evotherm); e Rejuvenator (Evoflex)
Methods
Asphalt Binders’ Extraction and Recovery
Method A in the ASTM D2172 / D2172M-17e1 [25] was utilized to extract asphalt binders from mixtures employing a centrifuge extractor, Figure 1(a), and trichloroethylene (TCE). A filterless centrifuge, Figure 1(b), was utilized to remove the mineral matter from the effluent. After mineral matter removal, asphalt binders were recovered utilizing a rotary evaporator (Figure 1(c)), per the ASTM D5404 / D5404M-12(2017) [26], from the asphalt binder dissolved in TCE. The extracted AC% values were compared with the total AC% values to investigate the interactions between the recycled and virgin binders.
FTIR Analysis
A Nicolet iS50 FTIR spectrometer was utilized to assess the molecules’ vibrations in binders, note Figure 1(d). Qualitative and quantitative FTIR investigations were used to investigate the polymeric components in rolling thin film oven aged VABs (RTFO AVABs) and extracted asphalt binders (EABs). The attenuated total reflection procedure was implemented with the samples on a diamond crystal. Using wavenumbers ranging from 4000 to 400 cm−1 and 32 number scans at a resolution of 4, the experiment was created.
VABs’ Short-Term Aging
For VABs, short-term aging was performed utilizing the RTFO per ASTM D2872-19 [27].
Asphalt Binders’ Rheological Analysis
The rheological characteristics of RTFO AVABs and EABs were determined using a dynamic shear rheometer (Figure 1(e)) per ASTM D7175-15 [28]. The researchers examined samples having a thickness of 1 mm and a diameter of 25 mm.
A. Temperature Sweep (TS) Analysis
After extracting asphalt binders from various asphalt mixes with RAS or RAP, the TS was utilized to determine the changes that happened in the binders. This was accomplished by a comparison of the values of the (|G*|/sinδ) rutting parameter of RTFO AVABs and EABs at various temperatures. Each asphalt binder was subjected to a TS test twice, two samples were taken from the same can, and the results were averaged. Several temperatures were chosen, starting with VAB’s high PG temperature and progressing to 106 °C in 6 °C increments. The experiment was stopped if the asphalt binders failed before 106 °C, indicating a |G*|/sinδ value of less than 2.2 kPa.
B. Frequency Sweep (FS) Analysis
The FS was employed to investigate the changes in modified asphalt binders’ compatibilities [6,15-20]. The test was conducted on binders after they were extracted from various mixtures including RAS or RAP. For each binder, two samples were examined, and the average results were evaluated. Various temperatures were used, 52, 58, 64, and 70 °C, with various frequencies (15.9 to 0.016 Hz) through FS testing. Han plots and black diagrams for RTFO AVABs and EABs were examined at 60 °C as a reference temperature using the results of the FS test. Cole-Cole plots were analyzed at 70 °C and 90 °C for the binders before and after the extraction process, respectively.
Thermal Analysis
Thermogravimetric analysis (TGA), Figure 1(f), of asphalt binders was performed before and after the extraction and recovery operations to assess their thermal analysis and monitor the binders’ compositional changes. A Discovery TGA was utilized to investigate the asphalt binders’ thermal properties according to the ASTM E1131-20 [29]. The 15–25 mg asphalt samples were heated from ambient temperature to 750 °C at a rate of 50 °C/ min using a high-resolution dynamic technique and a 60 ml/min nitrogen flow rate. The thermal characteristics of asphalt binders were examined by observing the parameters of the thermograph (TG) such as the percentage of residue (char) at 750 °C, onset temperature(Tonset), and endset temperature (Tendset). Binder compositional changes were predicted using the Tonset [30]. In ISO 11358-1 [31], the Tonset is described as the point where the starting-mass baseline intersects with the tangent to the TG curve at the highest gradient, which is known as the inflection point. Additionally, the shapes and parameters-the temperature at the first peak (T1) and the temperature at the second peak (T2)- of the derivative of thermograph (DTG) curves during thermal degradation were examined.
Colloidal Instability and Asphaltene Indices
Utilizing a thin-layer chromatography-flame ionization detector Iatroscan, Figure 1(g), the components of asphalt binders were evaluated using a 0.5-gram sample of asphalt binder diluted in 20 mL of dichloromethane of high-performance liquid chromatography grade. The procedures of this test were explained in previous studies [32,33]. After the components of asphalt binders (SARA) were evaluated [13], the IC and IA indices were calculated using Equations 1 and 2, respectively.
Based on previous studies [34-36], if the IC < 0.7, the asphalts’ colloidal structures are stable, and if the IC > 0.9 then the asphalts’ colloidal structures are unstable. For IC values between 0.7 and 0.9, the colloidal stability is uncertain. Other studies [23,37] suggested that the IC’s maximum value is 0.5 because higher than 0.5 IC values appear to be colloidally unstable. Low IC values, lower than 0.22, indicate the possibility of tender (soft) asphalt binders. The IC is expressed by the subsequent equation:
The is described by the following equation:
Results and Analysis
Extraction Analysis
The total AC-as expressed in the JMF-and the extracted AC percentages were compared for plant and field mixtures, as exemplified in Figure 2. The extracted AC% from field mixtures showed lower values than the total AC% for three mixtures (MO 13- 1, US 54-6, and US 63-1). For the US 54-1 field mixture, the extracted AC% was the same as the total AC%. However, the extracted AC% from plant mixtures presented higher values than the extracted AC% from field mixtures and near the total AC%. The average AC% difference, calculated from Equation 3, reflected the precision of the extracted AC%. The average AC% difference for field mixtures was 5.35%. Nevertheless, the average AC% difference for plant mixtures was 1.26%. These results illustrated that more interactions took place between the recycled binders and VABs in plant mixtures than happened in field mixtures because the extracted AC% from plant mixtures were more precise than the AC% extracted from the field mixtures. More components were exchanged between VABs and recycled binders in plant mixtures than occurred in field mixtures [13] because plant mixtures were reheated in the laboratory. The average AC% difference is expressed by the subsequent equation:

were, n is the number of samples.


FTIR Analysis
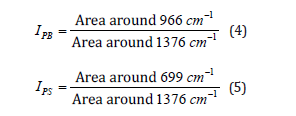
Figure 3 depicts FTIR analyses for RTFO AVABs and EABs. Each binder was examined twice, and the average results were analyzed. From Figure 3(a), the MO 13-1 VAB was modified by styrene butadiene styrene (SBS); therefore, the MO 13-1 RTFO AVAB showed two SBS peaks for wavenumbers ranging between 1000 cm−1 and 600 cm−1. The first peak was at 966 cm−1, which represents the C─H bending of trans-alkene in polybutadiene (PB). At 699 cm−1, the second peak was located, which was for C─H out-of-plane bending in the monosubstituted aromatic ring in polystyrene (PS). The MO 13-1 EABs showed the PB and PS peaks; however, these peaks were stronger for EABs from plant mixtures than those of EABs from field mixtures. The PB index at 966 cm−1 (IPB) and PS index at 699 cm−1 (IPS) were calculated using Equations 4 and 5, respectively [38,39]. It was observed that the IPB and IPS values were higher for plant EABs than those of field EABs, as deemed in Figure 3(d).
Shingles were enhanced with SBS during the manufacturing process [40]. Consequently, EABs from the US 54-1 plant mixture had PB components at 966 cm−1 and 911 cm−1 and PS at 699 cm−1 (Figure 3(b)). The C─H bending of terminal-alkene in PB was located at 911 cm−1. SBS peaks at 966 cm−1 and 699 cm−1 (IPB and IPS) were significantly higher for EABs from the US 54-1 plant mixture than those of EABs from the US 54-1 field mixture, note Figure 3(d). Furthermore, the IPB for the US 54-1-F EAB was zero. No polymeric components were noted for the US 54-6 EABs (Figure 3(b)) and the US 63-1 EABs (Figure 3(c)). Reheating the plant mixtures in the laboratory before the compaction technique improved the interactions between the virgin and recycled binders, which increased the intensities of the PB and PS components in EABs from plant mixtures than those of EABs from field mixtures.
Rheological Analysis TS Results
Figure 4 depicts the results of the TS test-|G*|/sinδ measured at different temperatures-for the MO 13-1 RTFO AVAB and EABs. The use of 17% ABR using RAP in mixtures increased EABs’ rutting resistance compared to RTFO AVAB. EABs from plant mixtures presented a higher rutting resistance and thus resulted in the values of |G*|/sinδ higher than the values of EABs from the field mixtures. This observation took place because plant mixtures were reheated to the compaction temperature, which increased the components exchanged between VAB and RAP binder [13].

Figure 5 displays the results of the TS test for the US 54 RTFO AVAB and EABs. Using RAP or RAS in the asphalt mixtures increased |G*|/sinδ of EABs in comparison to RTFO AVAB. The US 54-6 EABs showed lower |G*|/sinδ values than the US 54-1 EABs. The US 54-1 mixture had a 2% greater percentage of ABR by RAS than the ABR by RAP in the US 54-6 mixture. Furthermore, the air-blown asphalt inside RAS is stiffer than the RAP’s aged asphalt binder [41, 42]. The US 54-1-F EABs had |G*|/sinδ values greater than the US 54-6-F EABs and lower than the US 54-6-P EABs. However, the US 54-1- P EABs had the highest |G*|/sinδ values, which was related to the interactions between the RAS and VAB in the US 54-1 plant mixture. The |G*|/sinδ values of EABs from plant mixtures were greater than those of EABs from field mixtures. This corresponded to the FTIR findings discussed in a previous study [13]: The FTIR indices recorded for EABs from plant mixtures showed those binders underwent more aging than EABs from field mixtures. This meant that there were more component exchanges between recycled binders and VABs in plant mixtures. Additionally, EABs from the US 54-1 plant mixtures showed the SBS polymeric components that were included in RAS. Thus, there were components exchanged between the RAS binder and the US 54-1 plant mixture’s VAB. However, the polymeric components’ exchanges between the RAS binder and VAB of the US 54-1 field mixtures were not achieved: The SBS components were not recognized in the spectra of EABs from US 54-1 field mixtures [13].


Figure 6 shows |G*|/sinδ measured at different temperatures for the US 63-1 RTFO AVAB and EABs. The |G*|/sinδ values of plant mixtures’ EABs were higher than those of field mixtures’ EABs. More interactions between the VAB and RAP binder occurred in plant mixtures than in field mixtures, which increased the aged components exchanged in plant mixtures and detected by FTIR in a previous study [13]. VABs with the same PG (58−28) were used in both the US 54 and US 63-1 mixtures; however, the US 54 VAB was stiffer than the US 63-1 VAB. This concluded because the US 63-1 RTFO AVAB had a lower |G*|/sinδ (Figure 6) than the US 54 RTFO AVAB (Figure 5). The |G*|/sinδ values of the US 63-1 EABs were improved when the ABR percentage was increased by RAP from 31% for the US 54-6 mixture to 35% for the US 63-1 mixture. EABs from the MO 13-1 plant mixtures presented higher |G*|/sinδ values than EABs from the US 54-6 and US 63-1 plant mixtures. However, the ABR percentages by RAP in the MO 13-1 mixture were lower than the ABR percentages by RAP in the US 54-6 and US 63-1 mixtures. This occurred because the MO 13-1 mixture contained a stiffer VAB than the VABs included in the US 54-6 and US 63-1 mixtures. Accordingly, selecting the PGs of VABs in the mixtures played a crucial role, considering the percentages of RAP or RAS, in controlling the |G*|/sinδ values of EABs.
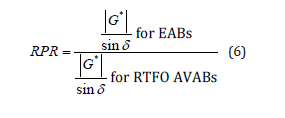
Rutting Parameter Ratio (RPR)
The RPR of EABs is shown in Figure 7. The RPR at high PG temperature of VABs was calculated from Equation 6. The RPRs for EABs from the US 54-1 plant mixture with 33% ABR by RAS had the greatest values, which were between 103 and 151. For EABs from plant mixtures containing RAP, the RPR values were between 6 and 15. Even though the US 54 VAB was stiffer than the US 63-1 VAB, the RPR values of the US 63-1 EABs were greater than the RPR values of the US 54-6 EABs. The ABR% by RAP in the US 63-1 mixture was greater than in the US 54-6 mixture by 4%. The VAB was the same in the US 54-1 and US 54-6 mixtures, while EABs from the US 54-1 mixtures yielded greater RPR values than EABs from the US 54-6 mixtures. This demonstrated how the air-blown asphalt component in RAS increased EABs’ stiffness. The RPR values of EABs from the MO 13-1 mixture, including 17% ABR by RAP and a stiff VAB with a PG of 64−22H, were like that of US 54-6 EABs containing a soft VAB with a PG of 58−28 and 31% ABR by RAP. This meant that the PGs of VABs, in conjunction with the percentages of RAP or RAS, were in charge of EABs’ high-temperature performance. The RPR is expressed by the subsequent equation:

The highest RPR values for EABs from plant mixtures were recorded for EABs from the US 54-1 mixture because this mixture contained RAS. The RAS binders are stiffer than the RAP binders [41, 42]. However, for EABs from field mixtures, the highest RPR values were noted for EABs from the US 63-1 mixture with a 35% ABR using RAP. This was the case because more interactions between the RAS binder and VAB were achieved within the plant mixture than in the field mixture. EABs from plant mixtures presented higher RPR values than EABs from field mixtures. Additionally, the difference between the RPR values of EABs from plant and field mixtures containing RAP was lower than the difference between the RPR values of EABs from the field and plant mixture containing RAS. This happened because the interaction between RAP binders and VABs is more readily than the interaction between RAS binders and VABs. This agrees with the results discussed in previous studies [13,43,44].
FS Results A. Cole-Cole Plots
The relationships between the real component (ηʹ) and the imaginary component (ηʺ) of the complex viscosity for RTFO AVABs are shown in Figure 8. For the MO 13-1 RTFO AVAB, Figure 8(a), ηʺ descends after climbing as the value of ηʹ increases, resulting in a peak in the curves. Thus, the Cole-Cole plot for the MO 13-1 RTFO AVAB shows a parabola, indicating the compatibility between SBS-detected by FTIR-and asphalt binder. The VAB of the MO 13-1 mixture was modified by SBS. However, the US 54 and US 63-1 VABs did not contain polymeric components. Therefore, Cole-Cole plots of the US 54 and US 63-1 RTFO AVABs in Figure 8(b) and Figure 8(c), respectively, deemed a decrease in the value of ηʺ with the increase of ηʹ, and no peaks were observed.

The Cole-Cole plots for EABs are shown in Figure 9. Parabolic Cole-Cole plots were observed in Figures 9(b) and 9(d) for the MO 13-1-P and US 54-1-P EABs, respectively. In a previous study [45], by analyzing the Cole-Cole plots, it was found that the best symmetrical parabola had the highest correlation coefficient (R) value. Therefore, the best symmetrical parabolas were noted for the US 54-1-P EABs because they had the highest R values. The MO 13-1 VAB was modified by SBS, and the US 54-1 mixture included shingles that were modified by SBS. However, the Cole-Cole plots for the MO 13-1-F EABs in Figure 9(a) and US 54-1-F EABs in Figure 9(c) did not show the parabolic trend. Thus, reheating the plant mixes in the laboratory before the compaction process increased the exchanged components between VAB and recycled binders [13], which increased the compatibility of SBS and asphalt binders. This agreed with the FTIR results: More SBS components were detected in the MO 13-1-P and US 54-1-P EABs when compared to those of EABs from field mixtures. This agrees with the interrupted shear flow test discussed in a previous study [13]: The released SBS polymeric components in the US 54-1-P EABs formed threedimensional network structures increasing EABs’ stiffness and elasticity.

B. Han Plots and Black Diagrams
Figure 10 depicts Han plots, modified Cole-Cole plots, for RTFO AVABs and EABs. A downward shift towards the inclined line and to the right side of the curve was seen for EABs. The maximum shift was observed for EABs from plant mixtures. This revealed that EABs’ elastic behavior had improved [46]. Figure 11 shows black diagrams of RTFO AVABs and EABs. All EABs showed a shift towards the |G*| axis and the right-hand side of the curve. By demonstrating larger |G*| values and lower δ values, this implies that stiffness and elasticity were enhanced [47]. The US 54-1 EABs from a plant mixture with a 33% ABR by RAS showed the maximum shift. These enhancements in stiffness and elasticity are preferred to resist rutting, which was assured by the multiple stress creep recovery test discussed in a previous study [13]. Because the plant mixtures were reheated before the compaction stage in the laboratory, more components were exchanged between the RAP or RAS binders and VABs in the plant mixtures than in the field mixtures [13]. Thus, in plant mixtures, RAP or RAS binders and VABs interacted more than in field mixtures. Consequently, the stiffness and elasticity of EABs from plant mixtures were shown to be higher than EABs from field mixtures.


Colloidal Instability and Asphaltene Indices
Table 2 depicts the IC values for RTFO AVABs and EABs. Lower IC values reflected more colloidal stability [34-36]. Resins play a critical role in asphaltenes’ stability [48]. Because of the repulsive forces between resin molecules in the solution and adsorbed resins on the asphaltenes surface, asphaltenes suspension is thought to be generated by resins that are adsorbed to the surface of asphaltenes, keeping them afloat [49]. EABs had lower saturates plus asphaltenes percentages and higher aromatics plus resins percentages than RTFO AVABs except for the US 54-1-P EAB. Thus, EABs from the US 54-1 field, US 54-6, and US 63-1 mixtures showed more colloidal stability than RTFO AVABs. This occurred due to the interactions between the virgin and recycled binders in asphalt mixes that alter the fractions of the total asphalt binders. The highest IC value was recorded for the US 54-1-P EAB that contained RAS, which reflects the lowest colloidal stability. The reheating method improved the swelling of the SBS polymer by absorbing additional low molecular weight fractions from the asphalt binders (aromatics), lowering the maltene percentage while increasing the asphaltene percentage.
Table:Colloidal instability and asphaltene indices.

IC: the colloidal instability index; IA : asphaltene index
The IA values are presented in Table 2 for RTFO AVABs and EABs. Asphaltenes and resins increase with aging but saturates and aromatics decrease. This occurred as a result of aromatics converting to resins, which are then converted to asphaltenes [50-52]. Thus, RTFO AVABs had higher percentages of asphaltenes plus resins, lower percentages of aromatics plus saturates, and thus higher IA values than those of VABs. The rheological results indicated higher stiffness of EABs than RTFO AVABs due to aged components included in the RAP and RAS binders. Accordingly, EABs had higher asphaltenes plus resins percentages, lower saturates plus aromatics percentages (higher IA) values compared to RTFO AVABs, as presented in Table 2. Because the plant mixtures were reheated in the laboratory before compaction, more interactions and components were exchanged between RAP or RAS binders and VABs in plant mixes than in field mixes [13]. FTIR analysis revealed that these components were aged components in RAP or RAS binders and SBS polymeric components in RAS binders [13]. Consequently, EABs from the plant mixtures contained higher percentages of asphaltenes plus resins, lower percentages of saturates plus aromatics, and higher IA values than the EABs from the field mixtures.
Figure 12 depicts the relationship between the IC and IA indices for asphalt binders before and after the extraction procedure. A polynomial trendline was chosen to show the relationship, with outliers eliminated and portrayed in a faded color. The chart revealed a direct relationship between the IC and IA indices. Binders with the greatest IA had the highest IC, resulting in the lowest compatibility or colloidal stability. For example, US 54-1-P had the lowest compatibility due to its high IA and IC indices. This was interpreted by the rheological results: US 54-1-P EAB demonstrated the maximum compatibility between SBS and asphalt binder because SBS swelled more aromatics, increasing the asphaltene percentage while decreasing colloidal stability-compatibility-in the asphalt fractions.
Thermal Analysis
The TGA results were assessed in this section by explaining the changes in the TGs and DTGs of RTFO AVABs and EABs. The TGs presented three stages: The first was a plateau that lasted from the predetermined initial heat temperature (e.g., room temperature) to Tonset. Few chemical reactions occurred in the first stage; moisture and low molecular weight components were volatilized [53,54]. The second stage of the TG signified the weight loss from Tonset to Tendset; this weight loss was attributed to the pyrolysis of asphalt SARA fractions [54,55]. The third stage of the TG represented a steadystate zone until the final heat temperature was reached when no mass loss can be shown at the termination of thermal degradation. At the end of the third region, the remaining components were the undecomposed residual coke and ash [54,56].
Depending on the asphalt binder composition, the DTG exhibited two or three stages. The absence of mass loss in the first stage indicates the presence of few physical or chemical interactions. In this stage, the [d(Weight) / d(T)] was zero. In the second stage, thermal degradation began to produce volatiles, and [d(Weight) / d(T)] gradually declined. Weak chemical bonds were destroyed in this region, resulting in the production of small gases. In the third area, molecule cracking occurred quickly, and strong bonds were disrupted. In a gas form, larger molecules disintegrate into smaller ones. In this stage, the [d(Weight) / d(T)] went to the peak (lowest value) and subsequently to zero. The thermal deterioration was too sluggish after this region, and the coke was the only component left at the end [3,57]. TGA results for RTFO AVAB and EABs from the MO 13-1 field and plant mixtures are shown in Figure 13. RTFO AVAB and EABs from field mixtures revealed three stages on the DTGs. Nevertheless, the second region started to disappear for EABs from plant mixtures (Figure 13(c)). In the DTG, the asphaltene showed one peak; however, the maltene exhibited two peaks [58]. As a result, the disappearance of the second stage in the DTG revealed a reduction in maltene for EABs [see Figure 13(c)].
The TGs and DTGs’ parameters were determined and are shown in Table 3. The residue percent at 750 °C, Tonset, and Tendset were the TGs’ parameters [see Figure 13(a)]. The DTGs’ parameters (T1 and T2) are presented in Figure 13(a). The residue percentages in all EABs were greater than in the RTFO AVAB, indicating a higher asphaltene content, as discussed in Table 2. Tonset, Tendset, T1, and T2 values for EABs from plant mixtures were the highest. The rheological results supported these findings: EABs from plant mixtures were the stiffest, whereas field mixtures’ EABs were the softest. In plant mixtures, there were more interactions and components exchanged between VAB and RAP binder. Also, due to the reheating process, SBS included in the MO 13-1 VAB absorbed more aromatics and swelled, which increased the stiffness and elasticity properties of EABs. Tonset, Tendset, T1, and T2 values were lower in EABs from field mixtures than in RTFO AVAB, which might be due to the antistripping agent’s action (Morelife T280). However, EABs from field mixtures were stiffer than RTFO AVAB due to the higher residue (coke and ash) percentages recorded for EABs, indicating a higher asphaltene content.

TGA results for the US 54-6 RTFO AVAB and EABs are shown in Figure 14. For RTFO AVAB, DTGs revealed three stages. The second stage, however, began to vanish for EABs from the field and plant mixtures. As a result, as illustrated in Figure 14(b) and Figure 14(c), the disappearance of the second stage in the DTG revealed a reduction in maltene for EABs. The TGs and DTGs’ parameters were determined and are shown in Table 4. The residue percentages in all EABs were greater than in the RTFO AVAB, indicating a higher asphaltene content. This agreed with the chemical results presented in Table 2. EABs from plant mixtures had the highest residue percentage, T1, T2, Tonset, and Tendset. The rheological results confirmed these findings: Plant mixtures’ EABs were the stiffest, followed by field mixtures’ EABs, while RTFO AVABs were the softest.
Figure 15 depicts the TGA results for the US 54-1 RTFO AVAB and EABs. DTGs revealed three stages for RTFO AVAB and EABs from field mixtures. The second DTG’s stage of EABs from plant mixtures began to diminish, as indicated in Figure 15(c). EABs from plant mixtures were the stiffest: This interpreted the disappearance of the second region for the DTG. The TGs and DTGs’ parameters were calculated and are shown in Table 5. The residue percentages in all EABs were greater than in the RTFO AVAB, showing a greater asphaltene composition. The chemical results in Table 2 support these findings. EABs from plant mixtures had the highest residue percentage, T1, T2, Tonset, and Tendset. The rheological findings reinforced these findings: EABs from plant mixtures were the stiffest, followed by field mixtures’ EABs, whilst RTFO AVABs were the softest. T1, T2, Tonset, and Tendset values were lower in EABs from field mixtures than in RTFO AVAB, which might be due to the antistripping agents (Morelife T280 and IPC 70) and warm mix additive (PC 2106). Even so, EABs from field mixtures were stiffer than RTFO AVAB due to the higher residue percentages recorded for EABs.

Table 3:Thermal analyses for the MO 13-1 binders.

TG: thermograph; DTG: derivative of thermograph; Tonset: onset temperature; Tendset: endset temperature; T1: the temperature at the first peak of DTG;T2: the temperature at the second peak of DTG.

Table 4:Thermal analyses for the US 54-6 binders.

Table 5:Thermal analyses for the US 54-1 binders.


TGA results for the US 63-1 RTFO AVAB and EABs are seen in Figure 16. For RTFO AVAB (Figure 16(a)), DTGs disclosed three stages. Even so, the second stage vanished in EABs [see Figures 16(b) and 16(c)]. EABs from plant mixtures had the highest Tonset values (see Table 6), indicating that these binders had the highest stiffness. Tonset values of EABs from field mixtures were lower than RTFO AVAB, which was attributed to the action of the warm mix additive (Evotherm) and rejuvenator (Evoflex). The Evotherm and Evoflex had Tonset values of 295.61 °C and 226.75 °C, respectively, as shown in Figure 17. However, as compared to RTFO AVABs, EABs from field mixtures exhibited higher stiffness, which was attributable to the higher residue percentages for EABs, as seen in Table 6. Increasing the amount of residues in EABs reflected an increase in the asphaltene composition of the EABs, which returned to the aged components in the RAP binders.
Table 6:Thermal analyses for the US 63-1 binders


Tonset of the US 63-1 RTFO AVAB was higher than the Tonset values of the MO 13-1 and US 54 RTFO AVABs. However, the residue percent for the US 63-1 RTFO AVAB, 13.69%, was the lowest when compared to the residue percent of the US 54 RTFO AVAB (13.90%) or the MO 13-1 RTFO AVAB (16.96%). The lowest residue percent was related to the asphaltene percentage in the asphalt binder, which interpreted that the US 63-1 RTFO AVAB had the lowest asphaltene percentage and hence the lowest stiffness when compared to the US 54 or the MO 13-1 RTFO AVABs. This was consistent with the rheological results. Figure 18 demonstrates the relationship between TGA residue % and chemical indices (IC or IA) for asphalt binders before and after the extraction technique. A polynomial trendline was chosen to fit the correlation, with outliers removed and depicted in a faded color. The graph showed a clear direct correlation between residue % and the IC or IA indices. The binders with the highest residue % had the highest IA and IC indices, indicating the lowest compatibility or colloidal stability.

Conclusions
The compatibility of VAB and recycled binders was investigated
in this study. This was accomplished by extracting asphalt binders
from the plant and field mixtures including VABs of various PGs,
various percentages of ABR using RAP or RAS, and additives.
Four Superpave asphalt mixtures were used in the plant and field
mixes. The fabrication technique was the only change between the
field and plant mixes: Plant mixtures were gathered from behind
the paver throughout the pavement construction stage, and field
mixtures were sampled two weeks later. The plant mixtures were
then reheated in the laboratory to compaction temperature and
compacted with a Superpave gyratory compactor. The rheological,
chemical, and thermal characterizations of EABs and short-term
aged VABs were investigated. The following conclusions were
drawn from this study:
a. Rheological properties, in conjunction with the chemical and
thermal characteristics of asphalt binders, may reflect the
compatibility of virgin and recycled asphalt binders.
b. Rheological properties can help interpret the compatibility
between polymers and asphalt binders; nevertheless, they may
misconstrue the compatibility between the asphalt fractions.
c. Thermal and chemical analyses can determine the colloidal
stability and, in turn, the compatibility of the total asphalt
binder’s fractions, which may be misled by the rheological
characteristics alone.
d. Modified asphalt binder can show rheological compatibility
between the modifier (e.g., SBS) and asphalt binder; however,
thermal and chemical analyses reveal colloidal instability of
the same binder’s fractions.
Acknowledgment
The Missouri Department of Transportation (MoDOT) provided the field samples and related information to the authors, which they gratefully acknowledge.
Funding
This work was funded by MoDOT under project No. TR201807.
Conflict of Interest
The authors declare no conflicts of interest.
References
- Cucalon LG, King G, Kaseer F, Arambula Mercado E, Martin AE, et al. (2017) Compatibility of recycled binder blends with recycling agents: rheological and physicochemical evaluation of rejuvenation and aging processes. Ind Eng Chem Res 56 (29): 8375-8384.
- Brown ER, Kandhal PS, Roberts FL, Kim YR, Lee D-Y, et al. (2009) Hot mix asphalt materials, mixture design, and construction, Third Edit: NAPA Research and Education Foundation, Lanham, Maryland, USA.
- Deef-Allah E, Abdelrahman M (2021) Investigating the relationship between the fatigue cracking resistance and thermal characteristics of asphalt binders extracted from field mixes containing recycled materials. Transp Eng 4.
- Petersen JC (2009) A review of the fundamentals of asphalt oxidation chemical, physicochemical, physical property, and durability relationships, Transportation Research Circular E-C140, Washington, DC, USA.
- Sreeram A, Leng Z (2019) Variability of RAP binder mobilisation in hot mix asphalt mixtures. Constr Build Mater 201: 502-509.
- Liang M, Xin X, Fan W, Zhang J, Jiang H, et al. (2021) Comparison of rheological properties and compatibility of asphalt modified with various polyethylene. Int J Pavement Eng 22 (1): 11-20.
- Sreeram A, Leng Z, Hajj R, Bhasin A (2019) Characterization of compatibility between aged and unaged binders in bituminous mixtures through an extended HSP model of solubility. Fuel 254: 115578.
- McDaniel RS, Soleymani H, Turner P, Peterson R (2000) Recommended use of reclaimed asphalt pavement in the Superpave mix design method. Technical Report, NCHRP D9-12.
- Sreeram A, Leng Z, Zhang Y, Padhan RK (2018) Evaluation of RAP binder mobilisation and blending efficiency in bituminous mixtures: An approach using ATR-FTIR and artificial aggregate. Constr Build Mater 179: 245-253.
- Zhao S, Huang B, Shu X, Moore J, Bowers B (2016) Effects of WMA technologies on asphalt binder blending. J Mater Civ Eng 28 (2): 04015106.
- Noferini L, Simone A, Sangiorgi C, Mazzotta F (2017) Investigation on performances of asphalt mixtures made with reclaimed asphalt pavement: Effects of interaction between virgin and RAP bitumen. Int J Pavement Res Technol 10(4): 322-332.
- Deef-Allah E, Abdelrahman M (2022) Interactions between RAP and virgin asphalt binders in field, plant, and lab mixes. World J Adv Res Rev 13(1): 231-249.
- Deef-Allah E, Abdelrahman M, Ragab M (2022) Components’ exchanges between recycled materials and asphalt binders in asphalt mixes. Adv Civ Eng Mater 11(1): 20210105.
- Ding Y, Huang B, Shu X, Zhang Y, Woods ME (2016) Use of molecular dynamics to investigate diffusion between virgin and aged asphalt binders. Fuel 174: 267-273.
- Dong F, Yu X, Chen J, Liu S, Chen Q (2017) Investigation on compatibility and microstructure of PCBs-modified asphalt. J Appl Polym Sci 134 (25).
- Becker Y, Müller AJ, and Rodriguez Y (2003) Use of rheological compatibility criteria to study SBS modified asphalts. J Appl Polym Sci 90 (7): 1772-1782.
- Airey GD (1997) Rheological characteristics of polymer modified and aged binder. Ph.D. dissertation, Univ. Nottingham, USA.
- Ashish PK, Singh D, Bohm S (2017) Investigation on influence of nanoclay addition on rheological performance of asphalt binder. Road Mater. Pavement Des 18(5): 1007-1026.
- Ait-Kadi A, Brahimi B, Bousmina M (1996) Polymer blends for enhanced asphalt binders. Polym Eng Sci 36(12): 1724-1733.
- Liang M, Liang P, Fan W, Qian C, Xin X, et al. (2015) Thermo-rheological behavior and compatibility of modified asphalt with various styrene-butadiene structures in SBS copolymers. Mater Des 88: 177-185.
- Ajji A and Utracki LA (1996) Interphase and compatibilization of polymer blends. Polym Eng Sci 36 (12): 1574-1585.
- Gaestel C, Smadja R, Lamminan K (1971) Contribution to knowledge of the properties of road bitumens. General Review of Roads and Aerodromes. 466: 85-92.
- Oliver JWH (2009) Changes in the chemical composition of Australian bitumens. Road Mater. Pavement Des 10(3): 569-586
- Oyekunle LO (2007) Influence of chemical composition on the physical characteristics of paving asphalts. Pet Sci Technol 25 (11): 1401-1411.
- ASTM D2172 / D2172M-17e1 (2017) Standard Test Methods for Quantitative Extraction of Asphalt Binder from Asphalt Mixtures. West Conshohocken, PA: ASTM International.
- ASTM D5404 / D5404M-12 (2017) Standard Practice for Recovery of Asphalt from Solution Using the Rotary Evaporator. West Conshohocken, PA: ASTM International.
- ASTM D2872-19 (2019) Standard Test Method for Effect of Heat and Air on a Moving Film of Asphalt (Rolling Thin-Film Oven Test). West Conshohocken, PA: ASTM International.
- ASTM D7175-15 (2015) Standard Test Method for Determining the Rheological Properties of Asphalt Binder Using a Dynamic Shear Rheometer. West Conshohocken, PA: ASTM International.
- ASTM E1131-20 (2020) Standard Test Method for Compositional Analysis by Thermogravimetry. West Conshohocken, PA: ASTM International.
- Jiménez-Mateos JM, Quintero LC, Rial C (1996) Characterization of petroleum bitumens and their fractions by thermogravimetric analysis and differential scanning calorimetry. Fuel 75 (15): 1691-1700.
- ISO 11358-1 (2014) Plastics-Thermogravimetry (TG) of Polymers- Part 1: General Principles. International Organization for Standardization. First edit.
- Holleran G, Holleran I (2010) Bitumen chemistry using cheaper sources - an improved method of measurement by TLCFID and the characterisation of bitumen by rheological and compositional means. in 24th ARRB Conf., Melbourne, Australia.
- Jiang C, Larter SR, Noke KJ, Snowdon LR (2008) TLC-FID (Iatroscan) analysis of heavy oil and tar sand samples. Org Geochem 39(8): 1210-1214.
- Wang J, Wang T, Hou X, Xiao F (2019) Modelling of rheological and chemical properties of asphalt binder considering SARA fraction. Fuel 238(4): 320-330.
- Ashoori S, Sharifi M, Masoumi M, Salehi MM (2017) The relationship between SARA fractions and crude oil stability. Egypt. J Pet 26 (1): 209-213.
- Xiong R, Guo J, Kiyingi W, Feng H, Sun T, et al. (2020) Method for judging the stability of asphaltenes in crude oil. ACS Omega 5(34): 21420-21427.
- Paliukaitė M, Vaitkus A, Zofka A (2014) Evaluation of bitumen fractional composition depending on the crude oil type and production technology. in the 9th Int. Conf. “ENVIRON. ENG.”, Vilnius, Lithuania.
- Xu G, Gong X, Yu Y, Chen X (2021) A rapid method for the determination of SBS content based on the principle of orthogonal testing. Appl Sci 11 (22): 10911.
- Ye ZC, Chen D, Ling C, Guan FY (2014) Quantifying SBS content in modified asphalt using Fourier transform infrared spectroscopy. Adv Mat Res 1065-1069: 691-695.
- Davis J (2024) Modified asphalt strengthens roofing shingles. The Magazine of the Asphalt Institute.
- Nazzal MD, Kim SS, Abbas A, Qtaish LA, Holcombe E, et al. (2009) Fundamental evaluation of the interaction between RAS/RAP and virgin asphalt binders. Technical Report, Ohio DOT, FHWA/OH-2017-24.
- Alvergue A, Elseifi M, Mohammad LN, Cooper SB, Cooper S (2014) Laboratory evaluation of asphalt mixtures with reclaimed asphalt shingle prepared using the wet process. Road Mater. Pavement Des 15 (sup1): 62-77.
- Buttlar WG, Abdelrahman M, Majidifard H, Deef-Allah E (2021) Understanding and improving heterogeneous, modern recycled asphalt mixes. Technical Report, Missouri DOT, cmr 21-007.
- Deef-Allah E, M Abdelrahman (2022) Characterization of asphalt binders extracted from field mixtures containing RAP and/or RAS. World J Adv Res Rev 13 (1): 140-152.
- Guo W, Guo X, Chang M, Dai W (2018) Evaluating the effect of hydrophobic nanosilica on the viscoelasticity property of asphalt and asphalt mixture. Materials 11 (11): 2328.
- Deef-Allah E, Abdelrahman M, Fitch M, Ragab M, Bose M, et al. (2019) Balancing the performance and environmental concerns of used motor oil as rejuvenator in asphalt mixes. Recycling 4 (1).
- Deef-Allah E, Abdelrahman M, Hemida A (2020) Improving asphalt binder’s elasticity through controlling the interaction parameters between CRM and asphalt binder. Adv Civ Eng Mater 9 (1): 262-282.
- Li J, Huang X, Zhang Y, Xu M (2009) Bitumen colloidal and structural stability characterization. Road Mater Pavement Des 10 (sup1): 45-59.
- Mansoori GA (1997) Modeling of asphaltene and other heavy organic depositions. J Pet Sci Eng 17 (1-2): 101-111.
- Speight JG (2015) Asphaltene deposition. in Asphalt Materials Science and Technology, Oxford, UK, Butterworth-Heinemann pp. 303-337.
- Zhang D, Chen M, Wu S, Liu J, Amirkhanian S (2017) Analysis of the relationships between waste cooking oil qualities and rejuvenated asphalt properties. Materials 10 (5): 508.
- Petersen JC (2009) A review of the fundamentals of asphalt oxidation: chemical, physicochemical, physical property. in Transp. E-Circular E-C140, Transp. Res. Board, Washington, DC, USA.
- Schlepp L, Elie M, Landais P, Romero MA (2001) Pyrolysis of asphalt in the presence and absence of water. Fuel Process. Technol 74 (2): 107-123.
- Zhang C, Xu T, Shi H, Wang L (2015) Physicochemical and pyrolysis properties of SARA fractions separated from asphalt binder. J Therm Anal Calorim 122 (1): 241-249.
- Radhakrishnan CK, Sujith A, Unnikrishnan G (2007) Thermal behaviour of styrene butadiene rubber/poly (ethylene-co-vinyl acetate) blends. J Therm Anal Calorim 90 (1): 191-199.
- Mothé MG, Leite LFM, Mothé CG (2011) Kinetic parameters of different asphalt binders by thermal analysis. J Therm Anal Calorim 106 (3): 679-684.
- Jing-Song G, Wei-Biao F, Bei Jing Z (2003) A study on the pyrolysis of asphalt. Fuel 82 (1): 49-52.
- Puello J, Afanasjeva N, Alvarez M (2013) Thermal properties and chemical composition of bituminous materials exposed to accelerated ageing. Road Mater. Pavement Des 14 (2): 278-288.
-

This work is licensed under a Creative Commons Attribution-NonCommercial 4.0 International License.


