 Research Article
Leveraging Earned Value Analysis for Timely Decision-Making in Construction Projects
Mohammad Azim Eirgash* and Bayram Ateş
PhD, Department of Civil Engineering, Karadeniz Technical University, 61080 Trabzon, Türkiye
Mohammad Azim Eirgash, PhD, Department of Civil Engineering, Karadeniz Technical University, 61080 Trabzon, Türkiye
Received Date:July 03, 2025; Published Date:July 11, 2025
Abstract
Timely and informed decision-making is critical to the successful delivery of construction projects. This paper investigates how earned value analysis (EVA) serves as a powerful methodology for driving data-driven decisions throughout the project lifecycle. By systematically integrating EVA with construction management processes, we demonstrate its effectiveness in tracking project performance, predicting potential delays and cost overruns, and facilitating corrective actions. Through an in-depth analysis of real-world construction project, we examine key EVA indicators - including Cost Performance Index (CPI), Schedule Performance Index (SPI), and Estimate at Completion (EAC) - and their role in enabling project managers to revise schedules and maintain financial control. The findings reveal that EVA provides a suitable framework for early problem detection, risk mitigation, and performance improvement, ultimately leading to more predictable project outcomes. The study concludes with practical guidelines for implementing EVA in construction environments to enhance stakeholder communication and overall project success.
Keywords:Earned Value Analysis; Construction project control; Decision-making; Schedule Performance Index
Introduction
Construction projects are inherently complex, involving multiple stakeholders, tight schedules, and stringent budget constraints. The ability to make timely and informed decisions is crucial to ensuring project success, yet many construction projects still face delays, cost overruns, and performance inefficiencies. Traditional project monitoring techniques, such as simple budgetversus- actual cost comparisons or milestone tracking, often fail to provide a comprehensive view of project health, leaving project managers reactive rather than proactive in addressing deviations [1]. Earned Value Analysis (EVA) was formally developed by the United States department of defense in the 1960s as an integrated control system for major defense acquisition programs [2]. Created to address the need for standardized performance measurement in complex, high-value government contracts, the EVA framework systematically integrated three critical project dimensions: technical scope, scheduled timelines, and budgetary expenditures. This important measurement approach enabled comprehensive project performance evaluation through quantifiable metrics. The methodology’s proven effectiveness in detecting performance variances during project execution led to its gradual adoption across multiple industrial sectors [3,4], with particular penetration in aerospace, manufacturing, and eventually construction industries, where its predictive capabilities for cost and schedule deviations offered significant operational advantages.
EVA facilitates the ongoing reassessment of a project’s estimated total cost at completion during each reporting period, thereby allowing for continuous oversight of the project budget [5]. One of the essential metrics derived from this approach is the cost performance index (CPI). This index is determined by dividing the cumulative earned value by the cumulative actual cost at a specific point in time. The CPI serves as an indicator of the project’s cost efficiency. A value above 1 suggests that the project is operating under budget, whereas a value below 1 indicates cost overruns [6].
A review of the literature reveals that Artun [7] studied the application of EVA in the Turkish construction sector, Yıldız [8] presented a case study from the construction industry using earned value management, Sivri [9] focused on progress monitoring in construction projects in general, Koral [10] utilized EVA as a cost control tool on project control-oriented construction management, and Eirgash [11] applied EVA for construction projects through a project management scheduling engine.
Similarly, Soylu [12] worked on defense industry suppliers, Ceylan et al. [13] applied the earned value technique to digital mapping, Bahar [14] examined earned value analysis in service procurement contracts, Gürbüzer [15] adapted earned value analysis to a shipyard project, Efe and Demirörs [16] investigated the use of earned value analysis in software projects, Eirgash and Baltacı [17] investigated the project scheduling performance of the EVA in construction projects, and Efe [18] focused on integrating the concept of quality into earned value analysis.
Additionally, Khang and Myint [19] applied the traditional method to a real-world cement factory construction project, aiming to give project engineers a more practical understanding of its application. Their study also offered recommendations for addressing potential challenges when implementing the method in actual industrial settings. Pourrostam et al. [20] have examined the causes of delays in Iran’s construction sector. They have determined the most important delay reasons as insufficient site management and supervision, the owner’s delaying of payments, change orders, the contractor’s ineffective planning and work schedule, the contractor’s financial difficulties, slow decision-making, delays in the production of design documents, the owner’s late review and approval of design documents, the consultant’s inadequate management, and problems experienced with subcontractors.
Sabry [21], in his study based on the cost control data of the Hurghada International Airport project, which began construction in Egypt in 2011, introduced a phase-based alternative approach to Earned Value Analysis. In his research, values such as cost variance and schedule variance showed differences between the traditional EVA and the newly proposed phase-based methodology.
Zhang et al. [22] conducted a study to determine the causes of delays in tunnel construction projects by surveying 91 companies, including 87 tunnel consultants and contractors, in China. As a result of this study, a total of 49 delay reasons were identified, with the main ones being complex geological conditions, payment delays by the project owner, the project being tendered at the lowest price, shortage of construction materials, lack of equipment efficiency, low labor productivity, postponement of the project, delays in the supply of construction materials, late handover of the site by the owner to the contractor, and ineffective scheduling of the project by the contractor.
The construction industry possesses unique characteristics due to its complex nature and the singular, non-repeatable essence of its projects. This complexity stems from its organizational structure, which requires the formation of new teams, institutions, and entities for each individual project, encompassing numerous interdependent phases. Consequently, the sector exhibits an inherently intricate framework. This structural complexity presents significant challenges in terms of analytical problemsolving, organizational management, and strategic alignment toward specific objectives [23].
Din et al. [24] conducted a questionnaire study with employers, consultants, and contractors from twenty housing projects in Pakistan to investigate the causes of construction delays. The results identified the main delay causes as: inefficient decision-making processes, client interference, unsafe working environments, change orders, lack of skilled subcontractors, inadequate financial management, and design errors. Additionally, Lipke [25] introduced the concept of “Earned Schedule (ES)” to the earned value management methodology. ES can be used to address certain predictive challenges encountered in the later stages of a project’s life cycle. ES represents the time at which the current earned value should have been achieved. With the inclusion of ES in the methodology, schedule variance and performance indices can be redefined [26].
Moradi et al. [27] proposed a novel evaluation model for EVA tailored to the construction sector. Their model integrates risk analysis to enhance the forecasting of future project performance under uncertain conditions, utilizing linguistic variables expressed through interval-valued triangular fuzzy numbers. Similarly, Mahdi et al. [28] emphasized that construction projects entail unique requirements throughout various stages of the project life cycle. More recent studies have approached the topic from different perspectives. For instance, Nejatyan et al. [29] employed a Delphi survey to identify key success factors for enhancing construction project performance through an EVM-based Value Engineering strategy. It highlights crucial factors like stakeholder coordination, integrated cost-schedule control, and risk-aware decision-making that optimize the EVM-VE integration. The study provides a systematic framework for implementing value-driven performance improvement in construction projects.
Barrientos-Orellana et al. [30] evaluated the accuracy and consistency of deterministic cost prediction methods in EVM. By comparing traditional and modified EVM forecasting approaches, the study identifies situations where combined or weighted techniques yield more reliable outcomes than basic methods. The findings provide actionable recommendations for choosing optimal cost estimation approaches based on project phase and risk levels. Ottaviani et al. [31] presented dynamic Performance Factors (PFs) that enhance Earned Value Analysis (EVA) and Earned Schedule (ES) forecasting without increasing complexity. By automatically adjusting PFs according to project advancement, the method delivers superior cost (EAC) and time estimates. Validation across 65 construction projects demonstrated its consistent outperformance of conventional EVM/ES approaches, offering practitioners an adaptable solution for more reliable project predictions.
Yalçın et. Al [32] This study evaluates how machine learning
(ML) enhances Earned Value Analysis (EVA) for construction
cost forecasting. Through comparative analysis of traditional EVA
versus ML approaches (including regression and neural networks),
the research demonstrates ML’s superior predictive accuracy,
particularly for complex projects. The findings support integrating
data-driven ML models with conventional EVM methods to improve
project control reliability. However, in this study, the construction
project is considered to be applied are small scale context and this
study considers a large-scale construction project. This study is
done to fulfil the following objectives.
a. To improve management control system of a construction
project by keeping the project on time and on budget.
b. To identify and control problems in potential risk areas.
c. To evaluate how EVA influences project outcomes, focusing
specifically on budget control and timeline management
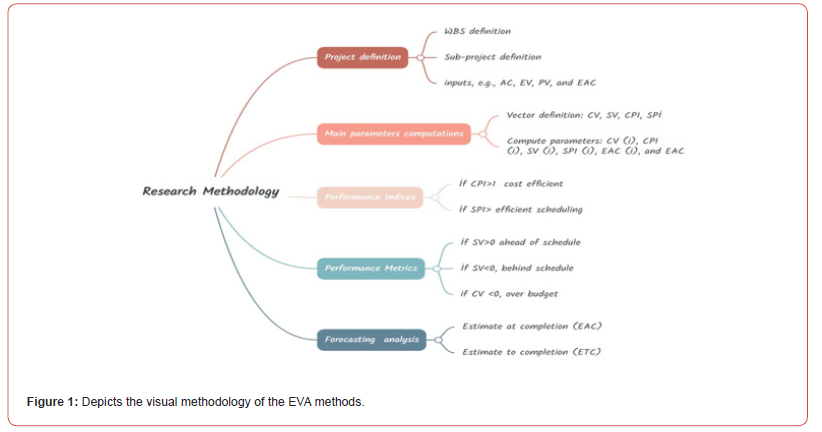
By fulfilling these research goals, the study enhances the existing knowledge base in construction project management and provides practical guidance for professionals seeking to utilize EVA as an effective methodology for optimizing project performance. The methodology followed to perform the EVA is demonstrated in Figure 1.
The structure of this paper is organized as follows: It begins with the fundamental concepts, followed by a clear explanation of the significance of construction projects in relation to Earned Value Analysis, supported by well-illustrated examples. A case study is then presented to demonstrate the practical effectiveness of Earned Value Analysis in managing construction projects. Finally, the paper concludes with a discussion and summary of key findings.
Earned Value Terms
The three-dimensional approach known as EVA (Earned Value Analysis) relies on the following data sources [4,33]: To assess the current status of a project and forecast its future performance, several key data points are utilized. Earned Value Management (EVM) consists of two main components: cost analysis and schedule analysis. For schedule analysis, EVM relies on metrics such as Schedule Variance (SV = EV − PV) and the Schedule Performance Index (SPI = EV / PV). In terms of cost analysis, it uses Cost Variance (CV = AC − PV) and the Cost Performance Index (CPI = AC / PV).
If CV is less than zero and CPI is below one, it indicates the project is over budget. Conversely, if CV is positive and CPI is greater than one, the project is under budget. Likewise, a negative SV and SPI below one signifies a schedule delay, while a positive SV and SPI above one suggests the project is ahead of schedule. When CV equals zero (CPI = 1) and/or SV equals zero (SPI = 1), it means the project is exactly on budget and/or on schedule, respectively. The chart presented in Figure 2 serves as a valuable tool for project managers, allowing them to monitor performance based on ongoing updates of CPI and SPI values. By tracking changes in these indices throughout the project lifecycle, managers can detect deviations from the plan early on and take corrective measures promptly. An example of a well-structured reporting format suitable for management-level updates is depicted in Figure 2.
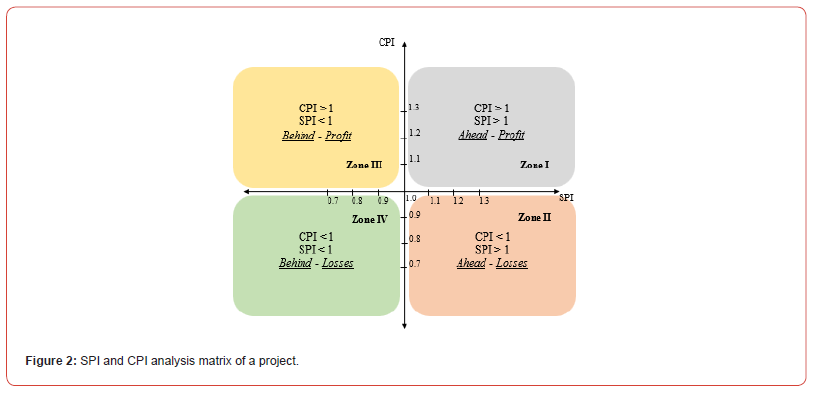
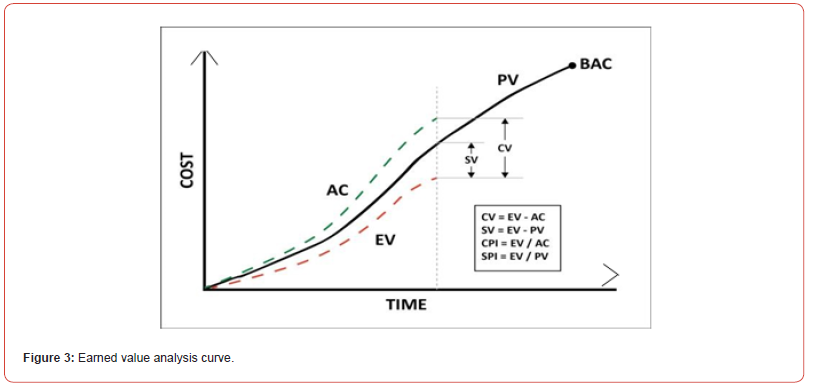
Figure 3 illustrates the earned value analysis chart, which compares the BCWS with BCWP and ACWP across project activities. The analysis uses two key metrics: cost variance to assess budget adherence and schedule variance to evaluate timeline performance. Positive variances indicate favorable outcomes (under budget or ahead of schedule), while negative values signal cost overruns or delays. This visualization enables project teams to quickly identify performance gaps and take corrective actions to maintain financial and schedule control throughout the project lifecycle.
Numerical Example Application
This study examines a large-scale construction project analyzed through EVA. The EVA model was implemented using Excel as well as MATLAB (R2024b) and executed on a system powered by an Intel® Core™ i3 processor (2.40 GHz) with 3 GB of RAM.
Example Problem
A major refinery construction project employed EVM to track progress across more than 150 work packages covering civil works, mechanical installations, and electrical systems. The project commenced with an approved baseline of $450 million and a scheduled duration of 3 years (36 months). Monthly performance assessments were conducted using EVM indicators and they are provided in Table 1.
Results and Discussion
Table 2 presents key performance indicators across multiple evaluation periods of the project. The CV and SV values fluctuate significantly, highlighting varying levels of financial and time performance throughout the project. Notably, three instances show large negative variances (e.g., CV = -$10M to -$20M and SV = -$5M to -$15M), which reflect cost overruns and schedule delays. Conversely, there are periods where positive variances occur (e.g., CV = $5M, SV = $10M), indicating temporary recovery or efficiency gains. The CPI and Schedule Performance Index (SPI) support these findings. CPI values range from 0.875 to 1.051, while SPI values span 0.933 to 1.067. Values below 1.0 suggest inefficiency, either in cost or schedule, while values above 1.0 represent favorable performance. The periods with CPI and SPI above 1.0 (e.g., CPI = 1.032, SPI = 1.067) align with positive variance values, demonstrating periods of improved project control. Forecasting indicators such as ETC and EAC provide insights into future expectations. EAC values vary widely, ranging from $428M to over $514M, compared to the fixed BAC of $450M. The highest EAC value ($514.29M) during a low CPI period reflects the projected impact of poor performance—substantially exceeding the budget. Conversely, a lower EAC ($428.23M) occurs during stronger cost and schedule control, where CPI and SPI exceed 1.
Table 1:Represents the status report of the project.

Table 2:Obtained values of status report of the project.

The data shows the project made good progress but kept struggling with costs and deadlines. While some improvements happened, there’s still a risk of going over budget. To fix this, the team should watch spending more closely and keep tracking performance regularly.
Figure 4 compares the planned budget BAC with the estimated EAC across multiple monitoring periods over the project’s 36-month duration. The horizontal pink line represents the BAC, which remains constant at approximately 45,000,000. This indicates that the project was initially expected to be completed within this fixed budget. In contrast, the blue line with diamond markers shows the EAC at specific time checkpoints, 6th, 12th, 18th, 24th, 30th, and 36th months. The trend of the EAC line reveals significant fluctuations, indicating instability in the project’s financial forecasts over time. At the 6th month, the EAC peaks at around 51,500,000, exceeding the planned budget by over 6.5 million. This early estimate signals a potential cost overrun due to factors such as delays, resource inefficiencies, or underestimated work.
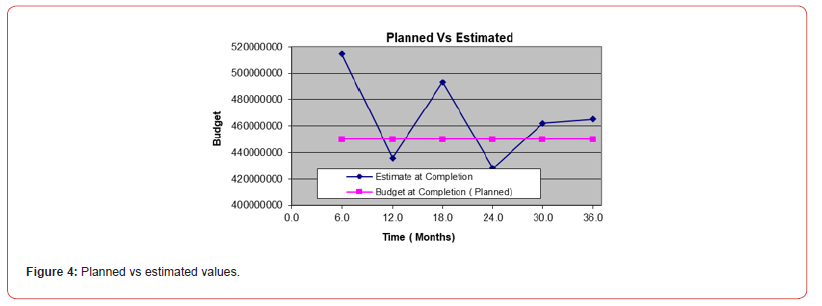
By the 12th month, the EAC drops sharply to about 43,500,000, falling below the BAC, suggesting some recovery through budget control measures or improved performance. However, this improvement doesn’t last long, as the EAC rises again by the 18th month to almost 49,000,000, showing that project costs increased once again. At the 24th month, the EAC once more drops significantly, hitting the lowest point around 42,500,000, below the planned budget, possibly indicating over-optimistic projections or temporary cost savings. Between the 30th and 36th months, the EAC climbs steadily, ending just above 45,000,000, slightly exceeding the original budget, suggesting a marginal overrun at completion.
Based on the graphical representation of BCWS, BCWP, and ACWP values in Figure 5, the project’s financial performance is as follows:
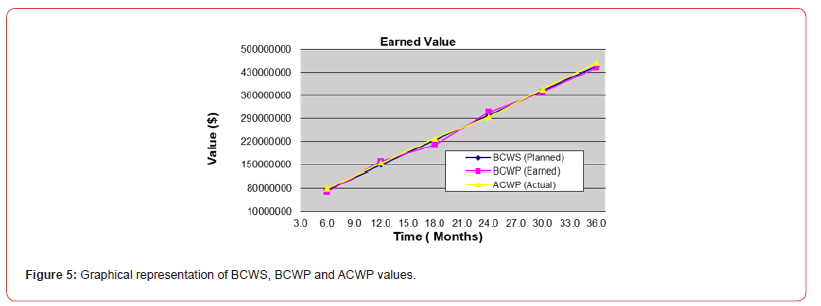
a) The BCWP is significantly lower than the BCWS, indicating
that the project is behind schedule. The earned value has not
met the planned milestones, suggesting delays in project
execution.
b) The ACWP is higher than the BCWP, which means
the project is incurring more costs than the value of work
completed. This indicates a cost overrun.
c) The trend suggests that if the current performance
continues, the project will likely exceed its original budget by a
substantial amount upon completion.
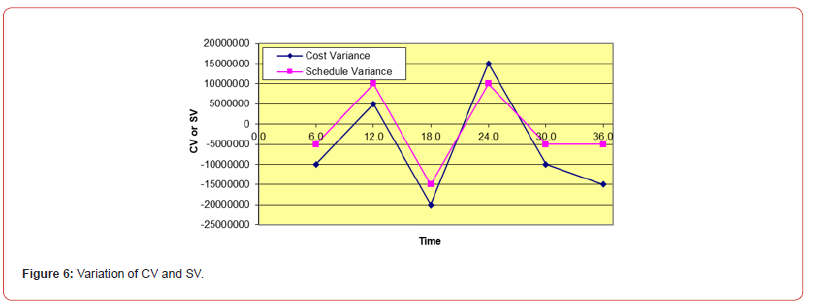
The graph in Figure 6 shows how the project’s budget and schedule performance changed over 36 months. The lines go up and down a lot, which means the project had many problems staying on track. Most of the time, the CV was below zero, meaning the project kept spending more money than planned. The SV was also often below zero, showing frequent delays. The fact that neither line improved much over time suggests the team couldn’t fix these issues properly. In the first year (0–12 months), both budget and schedule were already off track, likely because of poor early planning. Between 12–24 months, there may have been some attempts to improve, but the ups and downs continued. By the final year (24–36 months), things still didn’t get better, meaning the problems grew worse as the project neared the end.
By examining the graphical illustration of the CPI and SPI indices in Figure 7, the following observations can be made.
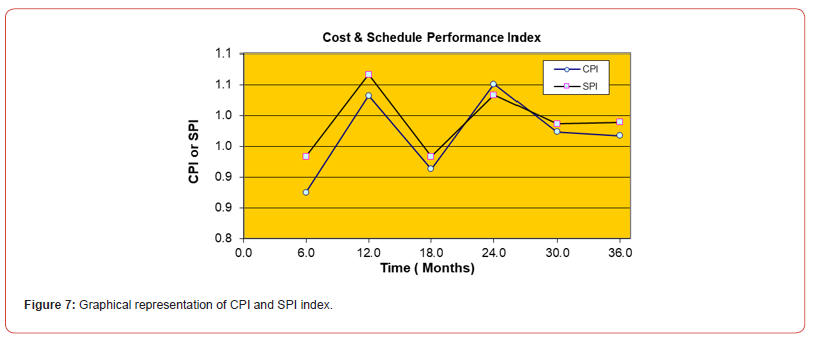
a) Review of the project at the 6th month:
According to Figure 6, both CPI and SPI are below 1.0 at the
6-month mark. A CPI < 1.0 indicates poor cost performance,
meaning the project is spending more than planned for the work
completed. Similarly, an SPI < 1.0 reveals significant schedule
delays, showing slower progress than originally planned. These
metrics suggest early warning signs of inefficiency in budget and
timeline management.
b) Review of the project at the 12th month:
By the 12th month, the CPI and SPI continue to decline, further
confirming deteriorating performance. The CPI remains below
1.0, indicating worsening cost overruns, while the SPI shows
persistent schedule slippage. This trend highlights unresolved
issues in project execution, requiring immediate corrective actions
to prevent further deviations.
c) Review of the project at the 24th month:
At the 24-month mark, the CPI drops sharply, reflecting severe
cost control failures. The SPI also remains below 1.0, though the
schedule performance decline is less drastic than cost performance.
This period likely represents a critical phase where underlying
problems—such as scope creep, resource mismanagement, or
inaccurate forecasting—became unmanageable.
d) Review of the project at completion (36th month):
By project completion, the CPI reaches 0.8, confirming a 20%
budget overrun, while the SPI settles at 0.9, indicating a 10%
schedule delay. The persistent downward trend in both indices
underscores systemic failures in planning and control. The project’s
inability to recover from early inefficiencies led to significant
deviations in both cost and schedule, emphasizing the need for
proactive monitoring and intervention in future initiatives.
Overall review of the project:
Figure 8 presents a comprehensive analysis of the cost and schedule performance of a project with a BAC of $450 million. In the initial stages of the project, there is a clear and favorable alignment among the planned value, earned value, and actual cost. This consistency in the early months reflects sound planning and efficient resource utilization, indicating that the project team was able to manage both time and cost effectively at the start. However, this positive trend does not continue. Beginning around the 18th month, deviations emerge, and by the 36th month, the project shows significant divergence from its original path. The cost variance and schedule variance values fluctuate throughout the project but turn consistently negative in the later phases. These sustained negative variances reveal mounting issues in both cost control and timely delivery. Specifically, negative CVs indicate that the project is spending more than the value it is earning, while negative SVs point to delays in executing planned work.
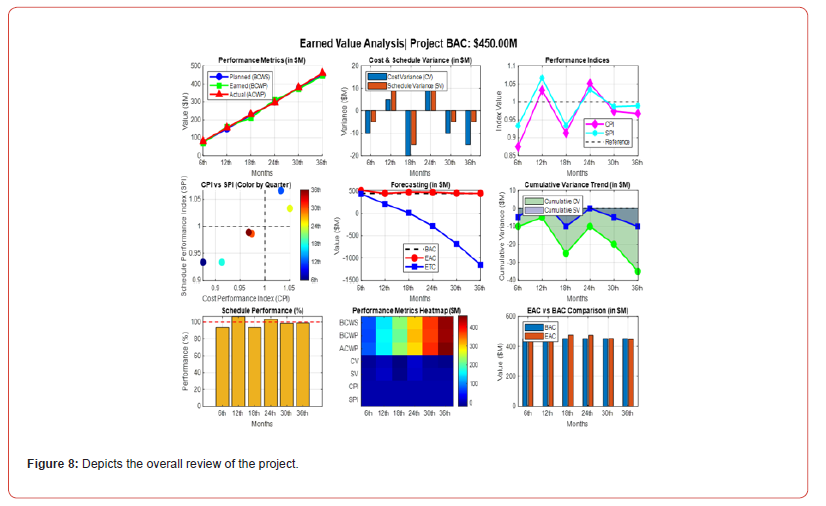
The decline in performance is further reflected in the Cost Performance Index (CPI) and Schedule Performance Index (SPI), which both fall below the benchmark value of 1.0 in several periods, especially toward the final months. A CPI < 1 suggests that costs are escalating beyond planned efficiency levels, and an SPI < 1 indicates that the project is not progressing as fast as scheduled. The inability to bring either index back to acceptable levels suggests that corrective measures were either not implemented effectively or were insufficient to reverse the declining trend. In terms of forecasting, the data indicates a worsening financial outlook. While the BAC remains fixed at $450 million, the EAC shows a steady upward trend, eventually surpassing the planned budget. Simultaneously, the ETC declines in several periods, which may indicate that future work is being underestimated or that resources are being stretched inefficiently. Together, these metrics suggest that without immediate and significant intervention, the project will experience a major budget overrun.
The schedule performance bar chart also supports this finding, showing that the project followed the schedule less closely as it neared the end. Likewise, the performance heatmap gives a quick visual of the overall decline. Darker shades in the ACWP row show rising actual costs, while lighter colors in the CPI and SPI rows suggest that cost and time efficiency were getting worse. Finally, the comparison between EAC and BAC in the closing months of the project clearly shows that the project is projected to exceed its planned budget. The widening gap between these two indicators confirms that financial targets are unlikely to be met under current conditions.
Conclusion
Making timely and well-informed decisions is essential for the successful delivery of construction projects. This study has emphasized the importance of Earned Value Analysis (EVA) as a reliable, data-driven method to monitor and control project performance throughout all stages. When EVA is integrated into typical construction management practices, project teams can better track progress, spot risks early, and take quick action to correct cost and schedule problems.
The performance review of this project highlights serious issues with both cost and time management. From the start, the project struggled to stay within its planned budget and timeline, as shown by ongoing differences between the value of work completed and actual costs. Frequent changes in the EAC reveal that the team had difficulty predicting and managing expenses. Although there were some periods of progress, these were short-lived, and overall, performance worsened as the project moved forward. The main performance metrics tell a clear story. Cost and schedule variances stayed negative for most of the project, meaning that more money was spent and more time was used than originally planned. The CPI and SPI stayed below 1.0, confirming the poor performance, and by the end of the project, it was 20% over budget and 10% behind schedule. These results suggest that the issues were not isolated but rather signs of deeper problems in how the project was managed..
Several reasons may explain these challenges. The initial planning may have been too optimistic, with targets that were hard to reach. The project team seemed to have trouble dealing with problems as they came up, allowing small setbacks to grow larger. Since performance didn’t improve in a lasting way, it appears that corrective actions were either too weak or came too late to make a difference. To avoid these problems in future projects, some key improvements should be made. Better planning at the start, with realistic goals and some built-in flexibility, would help manage uncertainty. Also, carrying out regular and detailed performance reviews could help identify and solve issues earlier when they are easier to handle.
It’s also important to note some limitations of this study. While EVA is a useful method, applying it in real construction projects comes with challenges. One of the main difficulties is measuring how much work has been completed, especially when tasks are complex and progress is uneven. Other barriers include resistance to change from project teams, a lack of understanding of EVA methods, and difficulties fitting EVA into existing project management systems. Additionally, the cost of training, software, and monitoring tools can be high, especially for projects with limited budgets. Lastly, future research could explore how learning curves affect project performance. In construction, teams often become more efficient as they repeat tasks. Studying how this learning effect influences EVA results could offer deeper insights and help improve project management. Answering these questions would strengthen our understanding of how EVA can be more effectively applied in construction.
Data Availability Statement
The datasets used and/or analyzed during the current study are available from the corresponding author upon reasonable request.
Declaration
The authors declare that there is no conflict of interest regarding the publication of this paper.
Funding
This research was not supported by any funding.
References
- Vanhoucke M (2010) Using activity sensitivity and network topology information to monitor project time performance. Omega 38: 359–370.
- Antvik, S (2002) Earned value management in Sweden-Experiences and examples: The Gripen project. Proceedings of the Project Managment Institute Annual Seminars & Symposium, San Antonio, TX, USA, 3 October 2002; Project Management Institute: NewtownSquare, PA, USA.
- Chin Keng T, Shahdan N (2015) The application of Earned Value Management (EVM) in costruction project management. J. Technol. Manag Bus 2: 2289–7224.
- Eirgash MA, Toğan V, Kazaz A (2017) Application Earned Value Based Metrics to Enhance the Performance Measurement of Engineering Project Management. Nevsehir Journal of Science and Technology pp 431-439.
- Mishakova A, Vakhrushkina A, Murgul V, Sazonova T (2016) Project Control Based on Mutual Application of Pert and Earned Value Management Methods. Procedia Engineering 165: 1812-1817.
- Ateş B, Eirgash MA (2025) Proactive and Data-Driven Decision-Making Using Earned Value Analysis in Infrastructure Projects. Buildings 15: 2388.
- Artun B (1998) Kazanılmış Değer Kavramının Türk İnşaat Sektöründe Uygulanması. Yüksek Lisans Tezi, Mimar Sinan Güzel Sanatlar Üniversitesi, İstanbul.
- Yıldız S (2001) Proje yönetiminde kaynak dengelemesi ve kazanılmış değer analizi: İnşaat sektöründe bir uygulama. Yüksek Lisans Tezi. Başkent Üniversitesi, Ankara.
- Sivri G (2001) İnşaat Projelerinde İlerlemenin İzlenmesi Kontrolü ve Proje Bilgi Yönetim Sisteminin Uygulanması. Yüksek Lisans Tezi. İstanbul Teknik Üniversitesi, İşletme Anabilim Dalı, İ
- Koral D (2007) Construction Project Management with an Emphasis on Project Control: A Case Study. MSc Thesis. Istanbul Technical University, Istanbul.
- Eirgash MA (2019) Earned Value Analysis for Construction Projects Using Project Management Scheduling Engine. Am J Civ Eng 7: 121–125.
- Soylu O (2003) Savunma sanayi tedarikleri için proje yönetimi ve kazanılmış değer analizi. Yüksek Lisans Tezi. Gazi Üniversitesi, Ankara.
- Ceylan A, Uyan M, Çay T (2005) Kazanılmış Değer Tekniğinin Sayısal Harita Üretiminde Uygulanması Üzerine Bir Çalış TMMOB Harita ve Kadastro Mühendisleri Odası 10. Türkiye Bilimsel ve Teknik Kurultayı. Ankara.
- Bahar M (2008) Hizmet Alımı Sözleşmelerde Kazanılmış Değer Analizi Modeli ve Bir Uygulama. Yüksek Lisans Tezi. İstanbul Üniversitesi, İ
- Gürbüzer A (2010) Kazanılmış Değer Analizi Metodunun Bir Tersane Projesine Uygulanması. Yüksek Lisans tezi. Gebze Yüksek Teknoloji Enstitüsü, Kocaeli.
- Efe P, ve Demirörs O (2013) Yazılım Projelerinde Kazanılmış Değer Yönetimi Kullanımı. Ulusal Yazılım Mühendisliği Sempozyumu VII, İ
- Eirgash MA, Baltaci Y (2021) Project Monitoring and Early Warning of Time-Cost Overruns in Earned Value Management. Curr Trends Civ Struct Eng 7: CTCSE.MS.ID.000673.
- Efe P (2015) Quality Integrated Earned Value Management. PhD. Thesis. Middle East Technical University, Ankara.
- Khang DB, Myint YM (1999) Time, cost and quality trade-off in project management: A case study. Int J Proj Manag 17: 249-256.
- Pourrostam T, İsmail A (2011) Significant Factors Causing and Effects of Delay in Iranian Construction Projects. Australian Journal of Project Management 25(5): 517-526.
- Sabry RA (2014) Construction Project Forecasting “Practical Use of EV Metrics. Management Studies 2(3): 168-178.
- Zhang D, Zhang H, Cheng T (2020) Causes of Delay in The Construction Projects of Subway Tunnel. Adv Mathematics Risk Analysis Civ Eng.
- Alpay C (2007) Bir İnşaat Projesinin Primavera ile Planlanması. Yüksek Lisans Tezi. İstanbul Kültür Üniversitesi, İ
- Din ZU, Raza A, Khan MB (2020) Comparative Analysis of Factors Causing Delay in Residential Construction Projects in Pakistan, Construction Research Congress.
- Lipke W (2004) The probability of success. The Journal of Quality Assurance Institute 14–21.
- Acebes F, Pajeres J, Galan JM, Lopez Parades A (2013) Beyond Earned Value Management: A Graphical Framework for Integrated Cost, Schedule and Risk Monitoring. Procedia-Social and Behavioral Sciences 74: 181-189.
- Moradi N, Mousavi SM, Vahdani B (2017) An earned value model with risk analysis for project management under uncertain conditions. J Intell. Fuzzy Syst 32: 97–113.
- Mahdi I, Abd Elrashed I, Ahmed S, Lamisse R (2018) Difficulties of implementing earned value management in construction sector in Egypt. Int J Eng Res Stud 5: 15.
- Nejatyan E, Sarvari H, Hosseini SA, Javanshir H (2023) Determining the Factors Influencing Construction Project Management Performance Improvement through Earned Value-Based Value Engineering Strategy: A Delphi-Based Survey. Buildings 13: 1964.
- Barrientos-Orellana A, Ballesteros-Pérez P, Mora-Melià D, Cerezo-Narváez A, Gutiérrez-Bahamondes JH (2023) Comparison of the Stability and Accuracy of Deterministic Project Cost Prediction Methods in Earned Value Management. Buildings 13: 1206.
- Ottaviani FM, De Marco A, Narbaev T Rebuglio M (2024) Improving Project Estimates at Completion through Progress-Based Performance Factors. Buildings 14: 643.
- Yalçın G, Bayram S, Çıtakoğlu H (2024) Evaluation of Earned Value Management-Based Cost Estimation via Machine Learning. Buildings 14: 3772.
- Anbari FT (2003) Earned value project management method and extensions. Proj Manag J 34: 12-23.
-
Mohammad Azim Eirgash* and Bayram Ateş. Leveraging Earned Value Analysis for Timely Decision-Making in Construction Projects. Cur Trends Civil & Struct Eng. 12(1): 2025. CTCSE.MS.ID.000772.
-
: Earned Value Analysis; Construction project control; Decision-making; Schedule Performance Index
-

This work is licensed under a Creative Commons Attribution-NonCommercial 4.0 International License.


