 Research Article
Impact of COVID-19 on E-Scooters Utilization and Users’ Behaviors over Time Before and During the Pandemic in the City of Chicago
Azza Alisawi1, Negaar Minaei2, Hatem Abou Senna3* and Rezwan Hossain4
1MS Student, Department of Civil Environmental Construction Engineering University of Central Florida, USA
2MS, PTP Travel Demand Modeler CDM Smith Maitland, USA
3Associate Professor, Department of Civil Environmental Construction Engineering University of Central Florida, Orlando, USA
4MD, Ph.D. Student, Department of Civil Environmental Construction Engineering University of Central Florida, USA
Hatem Abou Senna, Associate Professor, Department of Civil Environmental Construction Engineering University of Central Florida, Orlando, USA
Received Date:December 29, 2023; Published Date:March 12, 2024
Abstract
This study aims to investigate the usage patterns of shared e-scooters in Chicago, Illinois, United States, before and during the COVID-19 pandemic. Data from two e-scooter pilot programs were examined before the pandemic and the other during the pandemic. The analysis explored the changes in micromobility from a spatial and temporal perspective and conducts a comparative evaluation on the impact of COVID-19 pandemic on e-scooter travel patterns. The analysis revealed that COVID-19 pandemic has had a positive impact on micromobility, leading to an increased demand on shared e-scooters during the pandemic. Trip generation showed a significant increase observed in 2020 compared to 2019. Furthermore, the average trip length increased significantly which can be attributed to the fact that people were inclined towards long distances and using the scooters for commuting as well as nearby errands or recreational purposes which was expressed in the weekend patterns. Additionally, the number of trips increased during the evening peak period from 3:00 pm to 8:00 pm. These insights suggest that e-scooters played a significant role during the pandemic as an alternative mode of transportation, with many users relying on them for their daily commutes and recreational activities. The higher number of trips on weekends and the shift in travel preferences demonstrate the adaptability and value of micro- mobility options like e-scooters during challenging times. The analysis provided valuable insights into the evolution of micromobility patterns in response to the COVID-19 pandemic and other external factors in Chicago. As the city adapts to changing circumstances, shared e-scooters may play a significant role in meeting transportation needs while ensuring safety and convenience for residents.
Keywords:Micromobility; E-Scooter; COVID-19; Spatial and Temporal Analysis; Sustainable Transportation
Introduction
The unique public health issue of COVID-19 had threatened the globe, leading to the implementation of lockdown procedures in cities worldwide in response to the pandemic [1]. During the lockdown, nearly all public buildings, including schools and retail establishments, are closed, and all public gatherings were prohibited [2]. COVID-19 significantly impacted transportation mobility worldwide, leading to travel restrictions, social distancing, gathering bans, stay-at-home orders, and work-from-home policies [3]. These measures were put in place to reduce the spread of the virus and affected all transportation sectors [4,5]. Limiting the movement has had a big impact on how people traveled [6]. A particularly significant growing urban transportation mode is known as Micromobility. Micromobility refers to the individual use of small, lightweight vehicles for short-distance specifically less than 5 miles [7,8]. Examples of micromobility modes include docked and dock- less e-scooters and bike share systems. It is clear that the COVID-19 epidemic has had a particularly significant impact on micromobility [9]. This paper examines the differences before and during the lockdown period on the use of micromobility in the City of Chicago.
Shared electric scooters are a new trend popping up and an important new mode of micromobility in urban transportation in cities around the United States, with the promise of improving mobility, replacing short automobile and ride-hailing trips to reduce congestion, and offering first mile-last mile connectivity [10]. They are shared, convenient, easier to park, and take up less space on roads. Users also can have a fun experience that helps them reach their destination quickly. As the e-scooters market is growing, it created new opportunities for provider companies to make their way in the industry [11]. Especially, with the COVID-19 outbreak, there was a rapid expansion in the use of micromobility. This mode is designed to enable its user to maintain social distancing and is intended for single individuals. People in urban areas are utilizing scooters, bicycles, and other modes in order to decrease the danger of catching an infection when using public transportation, which increased the need to replace short/medium distance journeys with micromobility transit options. As a result, it is important to investigate how micromobility alters travel patterns in response to the COVID-19 pandemic.
The city of Chicago is constantly looking for new and innovative ways to extend and improve transportation alternatives to reduce traffic congestion and move people more efficiently. Therefore, the city launched a four-month e-scooter pilot in 2019 and 2020. The purpose of the e- scooter pilot was to learn more about the potential use of e-scooters as a mode of transportation in Chicago, as well as the operational difficulties they provide and potential solutions [5]. Also, we examine the effects of COVID-19 on e-scooter usage and user behaviors over time during the pilot study that occurred before and during COVID-19. After conducting two electric scooters pilot programs in 2019 and 2020, the City of Chicago has approved the operation of firms that offer a dock-less electric scooter rental program, providing people with a new choice for enjoyable, spaceefficient personal transportation that can help ease the city’s traffic congestion, pollution, and problems with violence in traffic.
Literature Review
There is a growing interest in studying the usage of shared e-scooters as a modern transportation mode in urban cities. Several research has been conducted to investigate the factors that influence users’ trips patterns and travel behavior using various micromobility. Tuli et al. (2021) studied the impact of temporal variables and time-invariant variables on the shared e- scooter demand in Chicago. Results of temporal variables indicated that shared e-scooter demand is higher on days when the average temperature is warmer, wind speed is lower, less rain, and during the weekend. Results related to time-invariant variables indicated that densely populated areas with higher median income, mixed land use, more parks, and bike-sharing stations, generate a higher number of e-scooter trips [12]. Several studies found that there is a significant correlation between e-scooters usage and leisure activity pattern such as dining and drinking, shopping, and recreational activities in the United States [13]. These studies analyzed e-scooters usage patterns and temporal factors and confirmed that most of the e-scooters trips are mostly for short commute and leisure activities [14].
The COVID-19 pandemic had a massive impact on mobility and strongly influenced people’s travel behavior. Therefore, several research studies have been conducted to examine how COVID-19 affected the emerging micromobility trip patterns. Fistola et al, (2022) analyzed the effectiveness of shared e-scooters use in different cities in Italy during COVID-19 and post- COVID phase by conducting questionnaires surveys addressed to university students. The results showed that 78.6% of the users are willing to change their travel habits and replace it with micro- mobility services [15]. Padmanabhan conducted a study using bikeshare data to assess the effect of COVID-19 on bike-sharing in New York City, Boston, and Chicago. Results indicated that the three cities experienced a reduction in trip frequency and an increase in the average trip duration during the study period [9]. COVID-19 outbreak also strongly impacted the public transport such as subway and public buses in big cities like New York City that has been hit harder than smaller cities. Teixeira & Lopes (2020) examined the impact of COVID-19 pandemic on the operation of subway and bike sharing systems (BSS) in New York City. The study revealed that the pandemic has less severe impact on BSS than subway with less ridership drop and an increase in trips’ average duration [16]. Brown & Williams (2023) studied how the patterns of ride-hail trips before COVID-19 pandemic compare with the trips during the pandemic by analyzing aggregated Uber trip data in California [17]. The results showed a significant decrease in ride-hail trips across different regions. Another study in Poland was performed to assess changes in mobility in public transport, as a consequence of the COVID-19 pandemic [18]. Several studies used GPS data to investigate how COVID-19 pandemic has an impact on reducing human travel distance to avoid exposure to the virus and reducing mobility in urban community in response to the government lockdown and stay-at-home order [19,20]. Beria & Lunkar (2021) assessed the impact of COVID- 19 pandemic on human mobility by analyzing a massive aggregated and deidentified data from Facebook users in Italy, France, and UK (21). It is found that each country showed reduction in traveling in a different mobility pattern [22].
While some research has explored the influence of temporal variables on shared e-scooter demand and how the COVID-19 pandemic affected micromobility trip patterns separately, there is a potential gap in the literature to investigate how these factors interact and collectively shape micromobility usage during and post-pandemic. Understanding how temporal variables and the pandemic influenced the adoption and usage of shared e-scooters and other micromobility modes could provide valuable insights for urban transportation planning and policymaking, especially in a post-pandemic context where people’s travel behavior and preferences may have shifted significantly.
E-Scooters Operation
E-scooters companies in Chicago offer on demand fleets that can be rent through an app on smart phones. After you create an account, you will locate a vehicle close by and just scan its QR code to unlock it. To prohibit e-scooter use outside the pilot area, companies were required to geofence their fleet. E-scooters companies set standard pricing equal to $1 to unlock plus $0.39 for each minute and they were required to provide low-cost pricing for low-income users and for those without smart phones [23]. During the E-scooter Pilot Program that ran in 2019 and 2020 [24], the City of Chicago set some requirements to ensure safety and to regulate the operation of the shared e-scooters. The main requirements and characteristics of each pilot study as follows: In 2019, the City’s Department of Business Affairs and Consumer Protection (BACP) issued Emerging Business Permits to 10 vendors (Bird, Bolt, grüv, JUMP, Lime, Lyft, Sherpa, Spin, VeoRide, and Wheels) for a total of 250 electric scooters. These permits allowed operation within a 50 square mile area on the City’s northwest and west sides, including designated zones such as the Bloomingdale Trail (the 606) and areas with summer music events. Operating hours were limited from 5 am to 10 pm, and vendors were required to retrieve all e-scooters from public spaces each night for redeployment the next morning. In 2020, three main vendors, Lime, Bird, and Spin, were granted Emerging Business Permits to deploy a citywide fleet of 10,000 e-scooters across a 212 square mile area. Each vendor was required to deploy 3,333 devices during the study, and the scooters were permitted to operate throughout the city. Furthermore, at least 50% of the fleet had to be docked in “Equity Priority Areas” on Chicago’s South and West Sides, ensuring access and availability in these neighborhoods.
In 2020, Geofencing technology was implemented to establish boundaries and restrict the operation of e-scooters in specific areas, including the Bloomingdale Trail (the 606), Lakefront Trail, Central Business District, and parts of DePaul University, Loyola University, the University of Illinois at Chicago, and the University of Chicago campuses. Unlike the 2019 pilot, the 2020 pilot required all e-scooters to be securely locked to fixed objects in the public right of way, such as bike racks or street signs, at the end of each trip. This measure aimed to minimize sidewalk clutter and obstruction. To gather valuable insights, an online feedback tool was introduced to collect information from both riders and non-riders. Additionally, a survey was developed and administered specifically for shared e-scooter riders. During the pilot, the distribution of trips showed that 28.2% of the rides were taken on Bird e-scooters, 43.7% on Lime e-scooters, and 28.0% on Spin e-scooters.
To ensure users safety, vendors were required to offer riders 998 free helmets, including 718 from Spin, 200 from Lime and 80 from Bird. One operator (Bird) stated in their pilot applications that they would implement “helmet selfie” incentives: riders take a selfie in the e- scooter app and earn ride credits if the app sees the user wearing a helmet. Bird reported 87 selfies collected.
Methodology
Description of Selected Data
For this research, electric scooters trips taken during the 2019 pilot program (from June 15th, 2019 to October 15th, 2019) and the 2020 pilot program (from August 12th, 2020 to December 12th, 2020) are available online in different formats through the City of Chicago Data Portal. Using this portal, we were able to gather data on E-Scooter trips for a four-month period in each pilot study. In 2019, there are 407,296 rows available for analysis. Likewise, in 2020, there are approximately 540,035 rows and each row illustrates an e-scooter journey. The data contained details on the trips such as trip distance (meters), trip duration (seconds), coordinates which represent the beginning and ending of the trip. Also, the areas from which the trip began and where it ended.
The dataset is broken down into more detailed columns such as providing the start and end time of the journey. Regarding the geographical locations, the starting and ending census tract were shown. The starting and ending area names are provided as well as the starting and ending area numbers. Furthermore, the starting and ending centroid latitude, longitude and location were also given. These data were provided in string format. Therefore, it was necessary to be converted into the correct format. The start time of the journey and end time was changed into date and time format. The trip distance and trip duration to be changed into numeric format. Also, the starting and ending census tract, the starting and ending area numbers, the starting and ending centroid latitude, longitude were all converted into numeric values format. The starting and ending area names remain in the same format unchanged.
Having big data to work on, Python was used for analyzing and visualizing our spatial- temporal data. After the data was viewed, it was found that not all entries in the dataset would be valuable for our analysis. Therefore, some conditions were set to clean and minimize the data. The two parameters considered were the trip length (in meters) and the trip duration (in seconds). The trip length had to be at least one hundred fifty meters, or the trip duration should have lasted 90 seconds. Moreover, any rows with missing data entries, such as lacking either the starting or ending trip duration, length, or coordinates, were removed. By applying these guidelines, the number of occurrences was decreased, resulting in a smaller and more manageable dataset.
Analysis Methods
Python and GIS tools were utilized to perform a spatialtemporal data analysis, aiming to gain insights into the changes in micro-mobility patterns in Chicago before and during the Covid- 19 pandemic. A comparative study was conducted, exploring the variations in users’ travel patterns during the two periods. The number of e-scooter trips taken daily throughout the study periods was calculated. Additionally, the dataset was examined based on the day of the week and the hour of the day, categorizing the number of trips accordingly. The analysis process involved importing the required libraries and the dataset, with most operations performed using the Pandas library. To visually present the data, graphical representations were created using Matplotlib and Seaborn. Since the dataset contained over 500,000 rows, it was acknowledged that not all of these entries represented actual trips. To address this, the dataset was filtered based on predefined rules to retain only instances considered to be real trips. Subsequently, necessary columns were converted from string values to a numeric format with the help of the Pandas library to facilitate further analysis. The next step involved examining the entire dataset to observe the recorded number of trips each day, providing insights into trends of trip frequency, whether they were increasing or decreasing over time. Graph plots were used for visualization to aid in understanding the data better. Further analysis looked into the average trip distance and trip duration. Grouping the Data Frame by the mean-value of the time-period column was achieved using the group-by function, which provided the average trip distance and trip duration for both time periods. Overall, Python facilitated the data analysis, allowing researchers to draw meaningful conclusions about the changing micro- mobility patterns in Chicago.
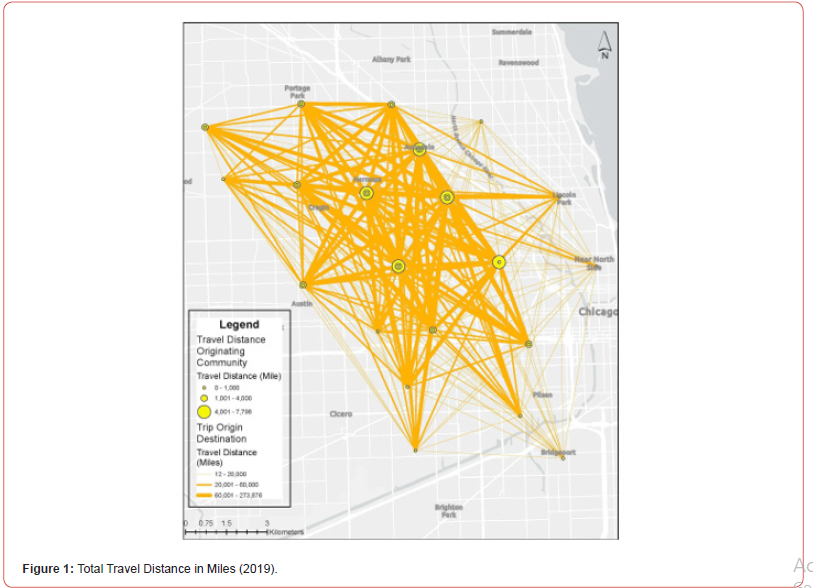
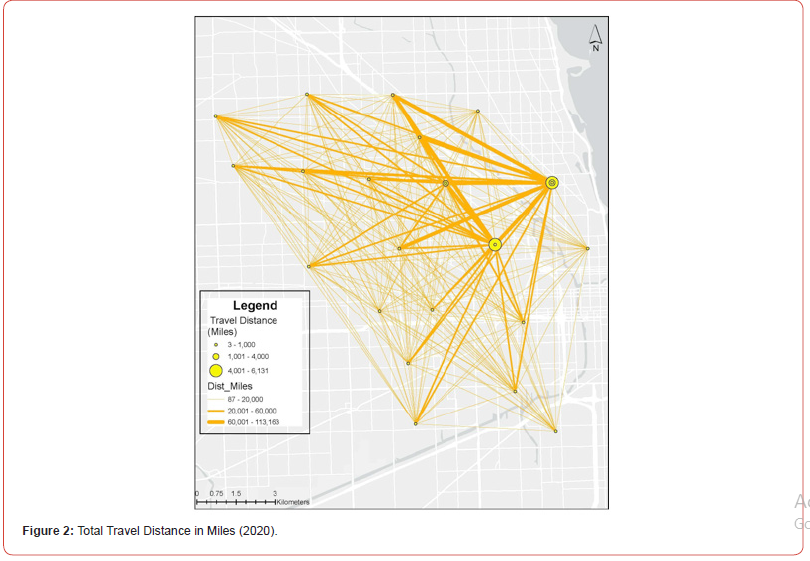
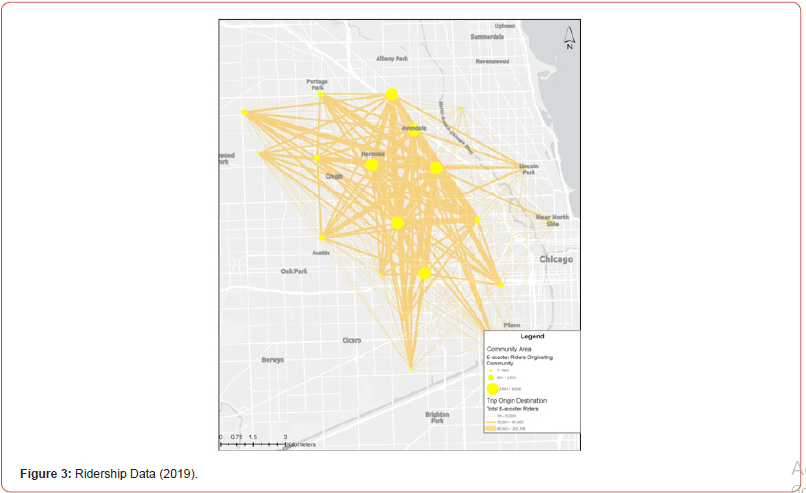
Figures 1 & 2 show the Origin Destination Maps for the 2019 and 2020 E-scooter travel distance in miles, respectively. Each yellow circle represents a community where trips either originated or ended with the average trip length. For example, Figure 1 shows small, medium, and large communities represented by the circle diameter. Looking at the middle circle size, it can be seen that total distance traveled within this community ranged from 1,001- 4,000 miles for the total ridership. The data has been summarized to include the trip duration, trip distance, and ridership. Figure 3 shows the ridership data for the year 2019. By comparison and utilizing the mid-size community (yellow circle), it was determined that the ridership ranged from 501 to 2500. Using the total number of 2500 users and total traveled distance of 4000 miles, therefore an average distance of 1.6 miles per user was conducted during the year 2019 conditions. Using the same analysis, it was determined that in year 2020, there was a total number of users of 4600 who traveled a total distance of 10,000 miles, it is concluded that during the pandemic, users traveled an average distance of 2.17 miles. This shows that the number of users increased dramatically in year 2020 as well as the distance traveled by each user which increased by almost 36%. This is a macroscopic analysis to compare between both years. The following section takes a closer look at the number of trips by day of the week and time of day to understand these variations between year 2019 and 2020.
Results
Variation on Daily E-scooters Ridership
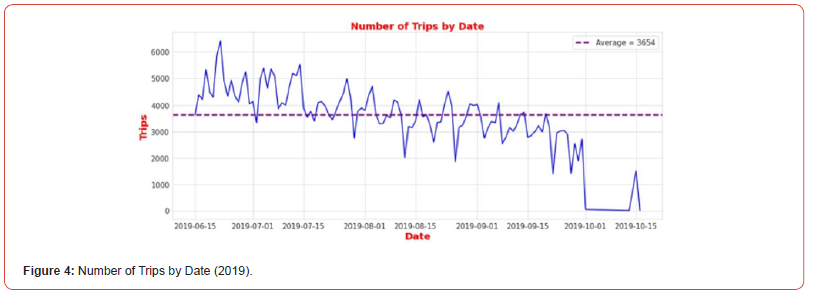
To present the results of the analysis clearly, graphical visualization was performed using Python codes, as previously explained. Figure 4 illustrates the distribution of trips per day during the 2019 and 2020 study periods. During the 2019 pilot, the calculated average daily trips were 3,654. The graph shows that the trips gradually increased from June 15 and peaked in the first week of the study (6/15/2019-6/22/2019) at approximately 6,400 trips. However, over the course of the pilot, the trip counts declined significantly, reaching about half of the initial count by the end of the study period. Moving on to the 2020 pilot, an average of 4,513 trips were taken daily. Figure 5 demonstrates that the number of trips began increasing at the beginning of the study period in August and experienced a sharp decrease after the first week of November. The daily trips reached a peak in September at 10,300 trips and then gradually declined through October, November, and December. This reduction in trips might be attributed to the second wave of COVID-19 infections. Additionally, extreme cold weather during this period may have led people to avoid taking scooter trips and engaging in outdoor activities.
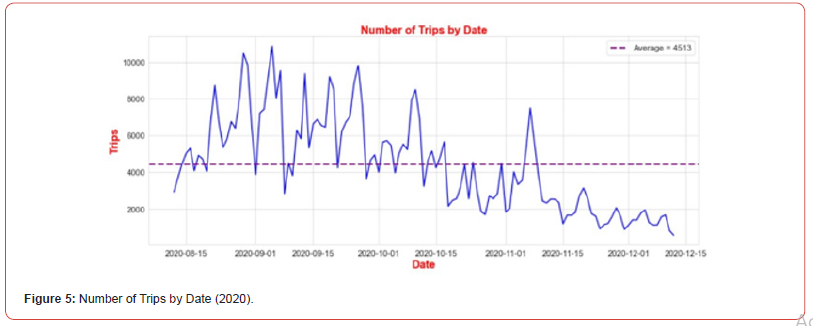
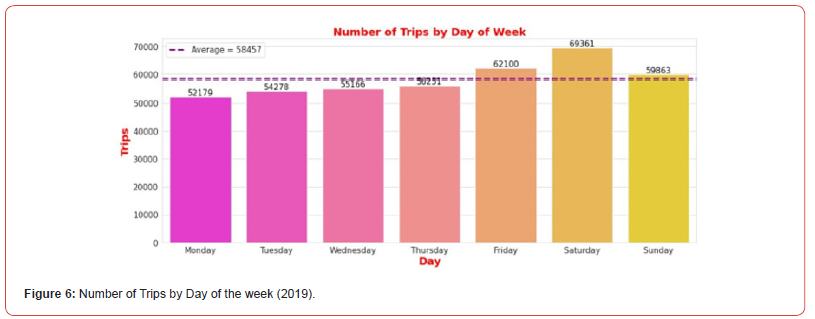
One interesting insight is that the 2020 pilot saw a higher average daily trip count compared to the 2019 pilot. This indicates a growing acceptance and popularity of e-scooters as a viable mode of transportation, especially during the pandemic when people were looking for safer alternatives to public transit. Moreover, the decline in trip counts during the latter part of the 2019 pilot and towards the end of the 2020 pilot suggests that external factors, such as changing weather conditions and pandemicrelated developments, can significantly influence micro-mobility patterns. Figures 6 & 7 represent graphs illustrating the number of trips taken on each day of the week during the 2019 and 2020 pilot periods, respectively. From Figure 6, we can observe that the number of trips taken on Friday and Saturday is slightly higher than on other days. The average trips per weekday are calculated to be 58,457. Similarly, Figure 7 shows that the highest number of trips occurred on Friday, Saturday, and Sunday during the 2020 pilot. These three days accounted for over half of the total trips, indicating that the usage of e-scooters on these days was primarily for enjoyment and recreational activities. According to a survey conducted by the City of Chicago in 2020, approximately 75% of e-scooter users rode them more than once daily, likely using them for their daily commutes as an alternative to public transportation. Additionally, about 22% of e-scooter riders surveyed stated that they used e-scooters to avoid using public transit due to COVID-19 concerns. This resulted in a relatively high number of trips from Monday through Thursday.
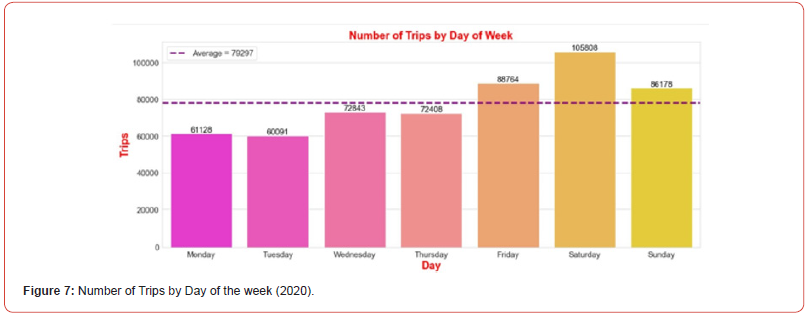
Moreover, another survey in 2020 asked e-scooter riders about the alternate travel options they would have chosen if e-scooters were not available for their most recent trip. Among all e- scooter riders, 53.2% said they would choose to walk or bike instead, 29.5% would opt to drive or use ride-hail services, and 11.6% would prefer taking transit. A small portion, 4.5% of riders, reported they would have canceled the trip altogether. In summary, 29.5% of e-scooter trips replaced a vehicle trip during the pandemic, compared to 10.8% before the pandemic.
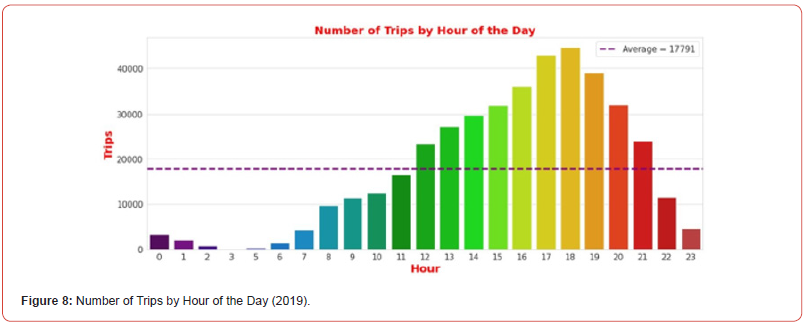
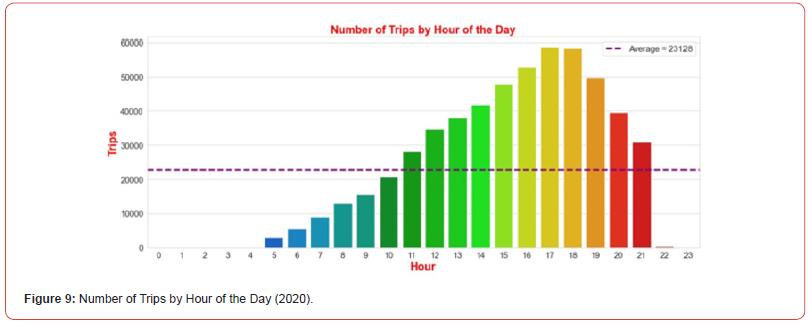
These insights suggest that e-scooters played a significant role during the pandemic as an alternative mode of transportation, with many users relying on them for their daily commutes and recreational activities. The higher number of trips on weekends and the shift in travel preferences demonstrate the adaptability and value of micro-mobility options like e-scooters during challenging times. Looking at the distribution of trips over the hours of the day, Figures 8 & 9 reveal a nearly similar travel pattern for both the 2019 and 2020 pilot periods. It is evident from the figures that e-scooters’ operation time is primarily from 5:00 am to 10:00 pm. During this period, the peak time for trips is observed to be between 3:00 pm and 8:00 pm. In the 2019 pilot, the number of trips peaked at more than 40,000 trips at 6:00 pm and then gradually declined during the night. Conversely, in 2020, the number of trips increased to nearly 60,000 trips at 5:00 pm, after which it steadily decreased until reaching 0 after 10 pm. The figures also show that the average number of hourly trips was 17,791 in the 2019 pilot. However, in the 2020 pilot, this number increased to 23,128 for the entire study period.
The consistency in the travel patterns for both years suggests that e-scooters remained a popular and reliable mode of transportation throughout the day, with the highest demand observed during the afternoon and early evening hours. The substantial increase in the average number of hourly trips from 2019 to 2020 highlights the growing acceptance and usage of e-scooters as a convenient and accessible means of transportation, particularly during the challenging times brought on by the pandemic. From the 2019 and 2020 dataset, we further calculated the average trip distance (length) and the average trip duration (time) in each period of study. In 2019, the average trip distance was 1.5 miles, and the average trip duration was 12 minutes. In contrast, the average trip distance in 2020 pilot was 2.1 miles, and the average time spent traveling was 18.50 minutes. Overall, average trip lengths in the 2020 pilot were 40% longer than in 2019. This trend of increased trip distance is possibly related to an overall shift in trip patterns due to the COVID- 19 pandemic.
Conclusion
The objective of this study is to provide analysis of the usage patterns of shared e-scooters before and during COVID-19 pandemic in Chicago, Illinois, the United States. To fulfill this objective, we analyzed the data from two e-scooter pilot programs in Chicago. The first pilot ran before the pandemic from June 15th, 2019, to October 15th, 2019, and the second pilot that ran during the pandemic was from August 12th, 2020, to December 12th, 2020. After exploring the data from all e-scooter vendors, we examine the changes of micro-mobility from the perspective of space and time. In addition, a comparative analysis was conducted to evaluate how e-scooter travel pattern is influenced by COVID-19 pandemic.
The findings of this study revealed that COVID-19 pandemic has positively impacted micro-mobility and that the demand for using shared e-scooters has increased during the pandemic. The trips followed a pattern and showed a significant increase in 2020 ridership compared to 2019. Furthermore, the average trip length increased significantly which can be attributed to the fact that people were inclined towards long distances and using the scooters for commuting as well as nearby errands or recreational purposes which was expressed in the weekend patterns. More than half of the trips were taken on Friday, Saturday, and Sunday which indicated that people were mostly riding e-scooters for recreational and short-distance activities during weekends. Moreover, the number of trips is rising during the pm peak period from 3:00 to 8:00 pm. A survey conducted by the city in 2019 indicated that about one third of the e-scooter trips replaced vehicle trips which can significantly reduce congestion and promote the use of sustainable modes of transportation.
These insights suggest that e-scooters played a significant role during the pandemic as an alternative mode of transportation, with many users relying on them for their daily commutes and recreational activities. The higher number of trips on weekends and the shift in travel preferences demonstrate the adaptability and value of micro-mobility options like e-scooters during challenging times. Overall, the analysis provides valuable insights into how micro-mobility patterns in Chicago have evolved in response to the COVID-19 pandemic and other external factors. As the city continues to adapt and respond to changing circumstances, e-scooters may play an increasingly important role in meeting transportation needs while ensuring safety and convenience for its residents. These findings can be helpful for e-scooters companies, planners, and policy makers to regulate and manage the operation of shared e-scooters in the city and to expand their availability in other areas to ensure equity among low-income population.
Acknowledgement
The views expressed in this paper do not necessarily reflect those of the City of Chicago. The authors would like to thank Chicago City for providing the data.
Author Contributions
The authors confirm contribution to the paper as follows: study conception and design: Hatem Abou-Senna, Azza Alisawi and Negaar Minaei; data collection: Azza Alisawi and Negaar Minaei; analysis and interpretation of results: Md Rezwan Hossain and Hatem Abou-senna; draft manuscript preparation: Md Rezwan Hossain and Hatem Abou-Senna. All authors reviewed the results and approved the final version of the manuscript.
References
- Saha J, Barman B, Chouhan PJC (2020) Lockdown for COVID-19 and its impact on community mobility in India: An analysis of the COVID-19 Community Mobility Reports 116: 105160.
- Li A, Zhao P, Haitao H, Mansourian A, Axhausen KWJC (2021) How did micro-mobility change in response to COVID-19 pandemic? A case study based on spatial- temporal-semantic analytics 90: 101703.
- Tuli FM, Nithila AN, Mitra SJTRIP (2023) Uncovering the spatio-temporal impact of the COVID-19 pandemic on shared e-scooter usage: A spatial panel model 20: 100843.
- De Vos JJTrip (2020) The effect of COVID-19 and subsequent social distancing on travel behavior 5: 100121.
- Menon N, Keita Y, Bertini RL (2020) Impact of COVID-19 on travel behavior and shared mobility systems.
- Lekić Glavan O, Nikolić N, Folić B, Vitošević B, Mitrović A, et al. (2022) COVID-19 and City Space: Impact and Perspectives 14(3): 1885.
- Almannaa MH, Ashqar HI, Elhenawy M, Masoud M, Rakotonirainy A, et al. (2021) A comparative analysis of e-scooter and e-bike usage patterns: Findings from the City of Austin, TX. International Journal of Sustainable Transportation 15(7): 571-579.
- McKenzie G (2019) Shared micro-mobility patterns as measures of city similarity: Position paper. Proceedings of the 1st ACM SIGSPATIAL International Workshop on Computing with Multifaceted Movement Data.
- Padmanabhan V, Penmetsa P, Li X, Dhondia F, Dhondia S, et al. (2021) COVID-19 effects on shared-biking in New York, Boston, and Chicago 9: 100282.
- Yang H, Huo J, Bao Y, Li X, Yang L, et al. (2021) Impact of e-scooter sharing on bike sharing in Chicago 154: 23-36.
- Yan X, Yang W, Zhang X, Xu Y, Bejleri I, et al. (2021) A spatiotemporal analysis of e-scooters’ relationships with transit and station-based bikeshare 101: 103088.
- Tuli FM, Mitra S, (2021) Factors influencing the usage of shared E- scooters in Chicago 154: 164-85.
- Bai S, Jiao J, Chen Y, Guo JJ (2021) The relationship between E-scooter travels and daily leisure activities in Austin, Texas 95: 102844.
- Noland RBJF (2019) Trip patterns and revenue of shared e-scooters in Louisville, Kentucky.
- Fistola R, Gallo M, La Rocca RAJ (2022) Micro-mobility in the “Virucity”. The Effectiveness of E-scooter Sharing 60: 464-471.
- Teixeira JF, Lopes MJ (2020) The link between bike sharing and subway use during the COVID-19 pandemic: The case-study of New York's Citi Bike 6: 100166.
- Brown A, Williams RJTRR (2023) Equity implications of ride-hail travel during COVID-19 in California. 2677(4): 1-14.
- Wielechowski M, Czech K, Grzęda ŁJE (2020) Decline in Mobility: Public Transport in Poland in the time of the COVID-19 Pandemic. 8(4): 78.
- Engle S, Stromme J, Zhou AJAa (2020) Staying at home: mobility effects of covid-19.
- Molloy J, Schatzmann T, Schoeman B, Tchervenkov C, Hintermann B, et al. (2021) Observed impacts of the Covid-19 first wave on travel behaviour in Switzerland based on a large GPS panel. 104: 43-51.
- Beria P, Lunkar VJSC (2021) Presence and mobility of the population during the first wave of Covid-19 outbreak and lockdown in Italy 65: 102616.
- Galeazzi A, Cinelli M, Bonaccorsi G, Pierri F, Schmidt AL, et al. (2021) Human mobility in response to COVID-19 in France, Italy and UK 11(1): 13141.
- https://www.chicago.gov/content/dam/city/depts/cdot/Misc/EScooters/2021/2020%20Chicag o%20E-scooter%20Evaluation%20-%20Final.pdf
- https://data.cityofchicago.org/Transportation/E-Scooter-Trips-Census-Tract-Summary- 2020/3srm-twg4 E-st-Cts-CoCDP
-
Azza Alisawi, Negaar Minaei, Hatem Abou Senna* and Rezwan Hossain. Impact of COVID-19 on E-Scooters Utilization and Users’ Behaviors over Time Before and During the Pandemic in the City of Chicago. Cur Trends Civil & Struct Eng. 10(4): 2024. CTCSE. MS.ID.000744.
-
Micromobility; E-Scooter; COVID-19; Spatial and Temporal Analysis; Sustainable Transportation; Iris Publishers, Iris Indexing Sites
-

This work is licensed under a Creative Commons Attribution-NonCommercial 4.0 International License.


