 Research Article
Evaluation of Furrow Irrigation Efficiency: A Case of Omo Kuraz - III Sugar Factory Irrigation Farm, SNNPR,Ethiopia
Yilkal Zewude1 and Tamene Mojira2*
1Ethiopia Construction Works Corporation, Omo Kuraz Project, Jinka, Ethiopia
2Civil and Irrigation Engineering Department, Omo Kuraz Sugar Factory, Jinka, Ethiopia
Tamene Mojira, Civil and Irrigation Engineering Department, Omo Kuraz Sugar Factory, Jinka, Ethiopia.
Received Date: August 22, 2022; Published Date: September 06, 2022
Abstract
This research was conducted to develop infiltration model and evaluate Omo Kuraz III furrow irrigation scheme performance using three common parameters namely: irrigation application efficiency, water storage efficiency and distribution uniformity. The research was performed by field evaluation, laboratory analysis and data analysis tool. Gravimetric soil moisture determination was used to determine required irrigation water and infiltrated depth was measured using volume balance method and estimated using developed infiltration model. Kostiakov infiltration model was used to develop infiltration model for the study area. Power regression using measured infiltration data and Microsoft excel was applied to determine best fit values of coefficient and exponent of the Kostiakov model. The result for developed infiltration model coefficient ‘m’ and exponent ‘n’ is 5.52 and 0.60 whereas application efficiency, storage efficiency and distribution uniformity was found to be 78.74 %, 97.19% and 80.67% respectively. So, the result of application efficiency, storage efficiency and distribution uniformity could still lead to crop stress and reduced yields which need to be improved further.
Keywords: Furrow irrigation, Infiltration, Irrigation efficiency, Uniformity, Omo kuraz - III irrigation scheme
Introduction
Ethiopia has a lot of land that can be used for irrigation. Ethiopia has 112 million hectares (Mha) of land, according to [1]. The amount of land that can be used for agriculture is estimated to be between 30 and 70 Mha. According to [2], Ethiopia has 5.3 million ha of potentially irrigable land, with 3.7 million ha from gravity-fed surface water, 1.1 million ha from groundwater, and 0.5 million ha from rainwater harvesting [3]. Irrigation water, according to [4], is vital to poverty alleviation through greater production in rural regions in order to improve food security and rural livelihoods. To assure water availability, irrigation must be managed wisely, with increased efficiency and the use of low-water agricultural techniques. This study develops infiltration model and addresses performance evaluation of Omo Kuraz - III Sugar Development Project furrow irrigation. The evaluation was based on three common parameters to evaluate surface irrigation: two efficiency indexes and one uniformity index, namely, irrigation application efficiency, water requirement efficiency and distribution uniformity [5]. Considering that a substantial amount of sugarcane to be cultivated in Omo Kuraz - III Sugar Development Project, a simple and effective process for monitoring and improving the performance of furrow irrigation systems is essential [6]. The study constituted development and analysis of soil infiltration model, soil physical property, water application, soil water storage and respective efficiencies and distribution uniformity of the scheme.
Irrigation, in general, and surface irrigation in particular, is not only the greatest water consumer, but also one of the most inefficient water user and potential factor resulting environmental degradation due to excessive irrigation water application. Irrigated agriculture’s long-term viability is mostly dependent on irrigation water management efficiency; as a result, it’s critical to improve the performance of less productive irrigation systems while maintaining the performance of more productive ones [7]. The impact that a system’s application uniformity can have on crop output and irrigation efficiency is another reason to evaluate systems. Acting on better irrigation management, namely choosing irrigation levels and the appropriate period of involvement, can enhance water use efficiency. The uniform application of water is the primary condition for an irrigation system’s efficient operation. Water might be evenly under or over-applied; a uniform water application does not guarantee great efficiency. It should be highlighted, however, that a highly effective system, as well as strong crop yields, necessitates uniform water application [8]. Improper irrigation practices, as reported by [9], result in inefficient water distribution, non-uniform crop growth, and excess and insufficient leaching in some places. All of these factors reduce the yield per unit of land area compared to the amount of water used. An irrigation scheme’s field performance review should reveal issues with the amount of water used the distribution of water across the field, the presence of excess tail water runoff, and considerable deep percolation losses. Thus, improving the effectiveness of irrigation practices is required to ensure the long-term viability of irrigated agriculture. Field evaluation of irrigation schemes is critical for determining the system’s efficiency in use, as well as identifying management methods and system configurations that may be implemented quickly and inexpensively to improve irrigation efficiency [10]. Conserving irrigation water has become a major problem in order to maximize the performance and thus the anticipated yield of irrigation schemes [11]. According to [12], the irrigation sector is efficient and successful in delivering desirable socioeconomic returns, considering the projected importance of irrigation in food security and poverty reduction and the large expenditures made in irrigation infrastructure.
The monitoring and evaluation of the performance of already built irrigation schemes, on the other hand, receives little or no attention. Many existing irrigation schemes are degrading in their physical architecture, functioning, and management systems, whether traditional or modern, public agency or community operated. As a result, evaluating the performance of these irrigation schemes is critical in identifying the primary causes of water loss, as well as their operation and management systems. The Ethiopian government is building a massive sugar cane development project in this research study area. However, due to inadequate irrigation management, the irrigated command’s productivity falls significantly short of expectations. Some plots in the study area irrigation network receive insufficient irrigation water at an inopportune moment. Solving irrigation efficiency gaps will help to solve this challenge and, by improving water use efficiency, can lead to larger economic gains. Irrigation water use efficiency, in this context, is a way of reducing water consumption while minimizing yield losses. As a result, the focus of this study will be on developing an infiltration model and evaluating furrow irrigation to determine two efficiency indexes and one uniformity index, namely irrigation application efficiency, water storage efficiency, and distribution uniformity of Omo Kuraz III irrigation scheme. The project has numerous system flaws, operational errors, and managerial restrictions. Water loss occurs at several places of the system, such as canals and on-farm applications, in relation to irrigation infrastructure and irrigation water management practices. To conserve water, the losses should be detected, and then solutions to reduce them should be supplied so that irrigation water management is handled by water managers, farm supervisors, and irrigators.
Scope of the study
This study is focused on the irrigation management system of the Omo Kuraz III furrow irrigation system. The scope of this research goes only to develop infiltration model and to determine irrigation application efficiency, storage efficiency and distribution uniformity. The research was conducted focusing only on the above three performance indicators because of data scarcity and absence of metrology stations near by the project.
Materials and Methods
Description of the study area
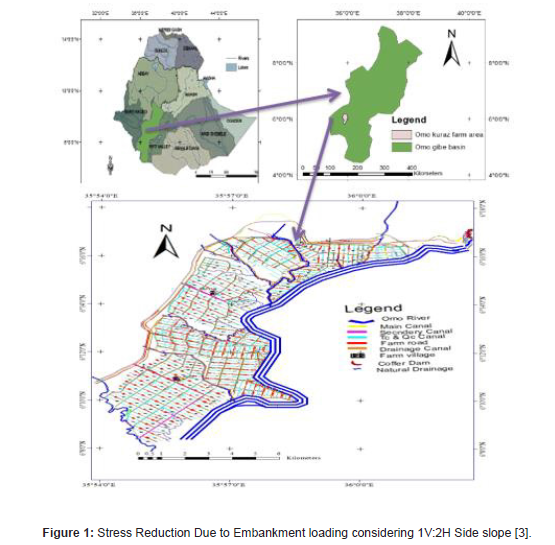
Omo Kuraz III irrigation system is situated in Omo River basin in the south - west of Ethiopia between 150223 and 167443 UTM east and between 655166 and 679135 UTM north (Figure 1).
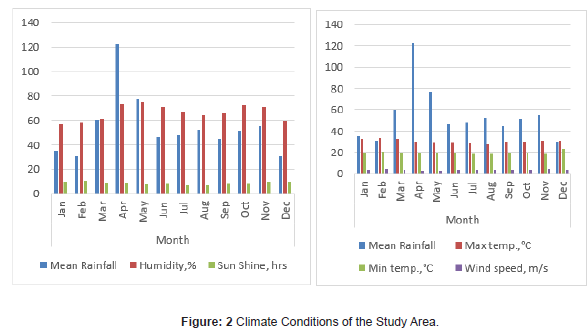
Climate: The agro climatic zone of the project area is situated in hot to warm arid plains. The annual average rainfall varies from 100 to 400 mm: rainfall is bi-modal, low, erratic, and highly variable from year to year. The mean annual temperature is greater than 27 °C [13]. The average sunshine hour in the area is 8.8 hours. The annual average relative humidity is 66.0 % whereas the annual average wind speed is 3.8 m/s (Figure 2).
Hydrology: The simulated flow of the Omo River at Kuraz for the time period 1983 – 2013 indicates that the mean annual discharge is about 750 m³/s, while the monthly average is about 200 m³/s from January to March, then increase ranging from 1,100 to 1,350 m³/s between May and September [13]. The main source of water for Omo Kuraz-III Sugar Cane Farm Irrigation is Omo River. Among the tributaries of Omo River, the Kuma stream is the major river draining the command area from the west to east direction and eventually joins the Omo River. There are also several other small streams and drainage lines that also carry flows of water from west to east direction to Omo River [14].
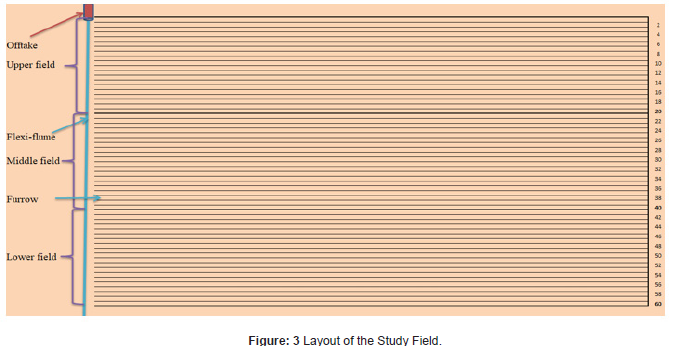
Scheme layout: The main canal aligned on the right side is labeled as RBMC and starts to irrigate Omo Kuraz-III Irrigation Farm at secondary canal one. Currently, using Sharma dyke as water source starts to irrigate Omo Kuraz III Irrigation Farm at SC3. The network system accounts the large unit canal to be reduced to small unit of easy operated and managing system through quaternary canals finally to field units using field canals (Figure 3).
Soil type: Fine and heavy clays with medium textures dominate the soil’s physical properties. The study area’s available water holding capacity ranges from 242.1 mm/m to 463.3 mm/m. The bulk of the soils in the project region have a strong clay texture. The bulk density of the soils in the project area ranges from 1.59 to 1.89 g/cm3. The infiltration rates of the soils are surprisingly moderate to fairly sluggish, ranging between 1.1 and 5.4 cm/hr. [15].
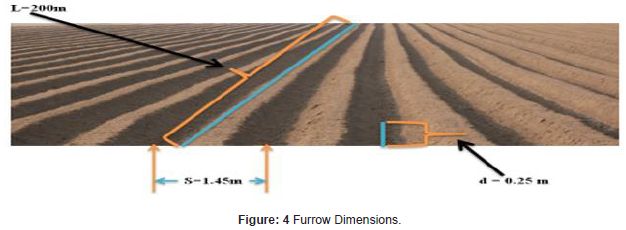
Furrow dimensions: Furrow type of the study area is straight line, end close trapezoidal shape. The dimensions are 200m length, 1.45m center to center spacing and 0.25meter depth (Figure 4).
Data Collection
The secondary data were collected through literature review and formal and informal communication with respective organization, and direct measurements and observations. The sample field was selected as it is fully cultivated and actively operational from the other secondary canal fields for primary data collection. During Primary Data Collection, Frequent field observations were made to know how irrigators control and manage irrigation water during application/irrigation event; identify practices related to irrigation water management techniques. Soil samples at depth intervals were taken before and after 24-hour irrigations. Determine the depth of water applied to the specific area of the field.
Materials and Methods
The study area field was partitioned into three blocks namely upper field, middle field and lower field. Each block had aerial size of 5714.29m2 and twenty furrows with 200m length each. The research was done through three irrigation seasons. On each season the research was conducted on the end furrow of upper, middle and bottom field using different flow rate. For each block at each irrigation event, furrow bund was formed using the same soil type from furrow bank to measure infiltration rate. Infiltration model was developed using Kostiakov model. Power regression was applied to determine best fit values of model constants using Microsoft excel, 2010 version. For doing so, ten sample cumulative infiltration data were collected using furrow bund technique at each field blocks per each three irrigation seasons. Using natural logarithm of these ten cumulative infiltration data and corresponded time, power regression was run to determine best fit values of model constants “m” and “n”. Using this developed infiltration model, cumulative infiltration was calculated. Calculated irrigation water stored depth was used to compute application efficiency, storage efficiency and distribution uniformity while required irrigation water depth was used to calculate storage efficiency.
Laboratory Analysis
To determine the moisture content of the soil, soil samples were collected just before and 24 hours after irrigation event during three irrigation season of date March 17, 2020, September 13, 2020, and December 1, 2020. Then soil moisture content was determined in laboratory using gravimetric method. The dry weight fraction of each sample was calculated using the equation by [16].

Where θw is soil moisture content on a dry weight basis (%), Ww is wet weight of the soil (gm) and Wd is dry weight of the soil (gm).

Where θ is volumetric moisture content, θw is the dry weight fraction, ρb is bulk density and ρw is specific weight of water
To determine the dry bulk density, the dry weight of the soil was divided by the soil sample volume. It is expressed as:

Where ρb is bulk density, wd is the dry weight fraction (gm) and vs - sample volume (m3)
To determine soil texture, soil samples were collected from three different layers of each 30 cm depth and 0 – 90 cm total layers’ depth range in the field and determined in the laboratory using mechanical analysis. The soil textural classes were determined using USDA soil textural triangle [17]. The evaluation of the depth of water application was carried out using flexi-flume installed at the outlet of quaternary canal of the field. During the determination of the amount of water applied to the field, the average water flow rate passing through the flexi-flume outlets to the field and respective time intervals were recorded with the size of the field being irrigated. Calibrations were made in 20-liter bucket by recording respective time by taking the measurements at different location and the process was made repeatedly. Irrigation continued until irrigation water reaches to the end of closed end furrow. The total volume of water applied to the field was obtained by multiplying the discharge rate with the inflow time and number of furrows. The depth of water applied to the field was calculated by dividing the total volume of water applied to area of the field.
Soil infiltration measurement process is broadly classified into two; field evaluation and infiltration model determination [18]. During irrigation, measurements of inflow and distribution of water applied to the root zone, advance and recession time were made while intake opportunity time was calculated. For doing so volume balance method with advance method was used. After 24 hours’ irrigation soil moisture and furrow cross section were determined. The method considered for this research to determine discharge and infiltration was volume balance method
Data Analysis
Infiltration: For this research, Kostikov infiltration model was used to obtain numerical values of the model’s parameters using field experimental data.

Where, “I” is cumulative infiltration depth, mm; T is time elapsed for infiltration, min; “m” and “n” are the empirical parameters. These parameters are site-specific and depend on the soil texture, soil bulk density, moisture contents, and other soil properties [19].
Discharge Measurement: Along the furrow, the discharge per each partition end point was measured using 70o sharp crest V-notch constructed from 4mm thick sheet metal in workshop and the computation was done using Kindsvater-Shen equation for non 90o sharp crest triangular V-notch.

Where Q is discharge (cfs), C is discharge coefficient, θ is notch angle (degree), h is head in (ft.) and k is head correction factor (ft.). C and k are taken from graphs or calculated by the following formulae.


Application Efficiency: The application efficiency is the relation between the quantity of water stored in the root zone and the quantity of water released to the field inlet. The application efficiency (Ea) was calculated using the equation;

Where Ea is water application efficiency (%), Ws is water stored in the soil root zone during the irrigation (mm) and Wf is water applied to the farm/field (mm). The depth (d) of water stored or infiltrated in the root zone was determined using equation as follow.

Where ‘d’ is total infiltration depth (m), Zi is infiltrated depth at each subsequent section measured along the furrow, Li is advance distance of each section (m), Wi is furrow spacing (m), Af is area of the field (m2) and n is number of measurements
Storage Efficiency: Water storage efficiency is the ratio of the quantity of water stored in the root zone and evaluates how completely the water needed prior to irrigation has been stored in the root zone during irrigation. The amount of water needed in the root zone is the difference between moisture content corresponding to the field capacity and the moisture content in the root zone prior to irrigation. The amount of water added to the root zone is the difference between the moisture contents in the soil 24 hours after irrigation and prior to irrigation. Total available water (TAW) which is an estimate of the amount of water a crop can use from the soil and is computed from the moisture content in volume percent at field capacity and permanent wilting point as:

Where: TAW is Total Available Water in the root zone (mm), θFC is Water content at Field Capacity (m3m-3), θWP is Water content at Wilting Point (m3m-3) and RD is Root Depth (mm), The amount of water needed to refill the crop root zone to field capacity at the time of irrigation or the required depth (Zreq) was calculated using equation, 3.11 in the root zone [20] as cited in [21].

Where; SMD is soil moisture deficit (mm), Zreq is the required application depth (mm), θfc is moisture content at field capacity (% volume), θi is moisture content before irrigation event (% volume) and D is effective root depth (m). After determining the depth stored and required in the root zone, the storage efficiency was calculated using:

Where Es is storage efficiency (%), d is average infiltrated depth (mm) and Zreq is the required application depth (mm)
Distribution Uniformity: One measure which emphasizes the under-watered area and looks at the critical regions is the distribution uniformity [22].

Where davg [mm] is the total volume accumulated in all elements, divided by total area of all the elements.
Result and Discussion
Infiltration parameter modeling
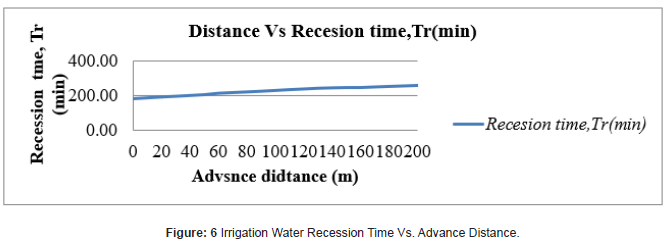
Using this measured data, the graph was plotted explicitly for advance and recession time versus advance distance. The variation is nearly similar to recession time. It is difficult to determine the cause of these advance and recession time variations specifically since it depends on different factors. The possible reasons are decrease in inflow rate along the furrow (for advance time), the slope variations at some parts of the furrows, measurement errors, and very large variations in soil texture in the fields [23] (Figure 5).
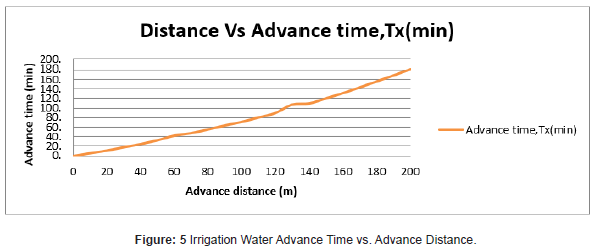
As observed from the graph it is increasing trend from point of inlet to the outlet at the end of furrow (Figure 6).
As observed from the graph, Figure 6, it is increasing trend starting from non-zero value of the last advance time from point of inlet to the outlet at the end of furrow. The graph is flat which is due to gentle furrow slope (0.05%) of the study area. This gentle furrow grade resulting flat recession time curve attributed an increase in intake opportunity time. From measured advance and recession time, infiltration opportunity time was calculated by subtracting advance time from recession time and its graph was plotted as shown in Figure 7 (Figure 7).
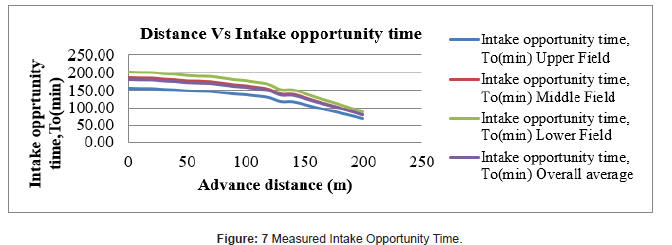
As observed from the graph of Figure 7, intake opportunity time decrease along the furrow and that is why deficit irrigation at the end of furrows is faced. The change was related with flow rate and as the flow rate decrease down the field intake opportunity was increased for the three blocks.
Infiltration function constants
The proposed estimation procedure for flow-depth dependent infiltration parameters requires, first, calculating an infiltration function that is dependent only on opportunity time. This function is used to simulate the flow depth hydrographs. Ponded water on furrow bunds was infiltrated for 110 minutes and infiltration rate and cumulative infiltration was measured for the individual infiltration runs of 5–25-minute intervals. At the end of the measurement the following data of Table 1 was compiled (Table 1).
Table 1:Field Measured Values of Cumulative Infiltration.
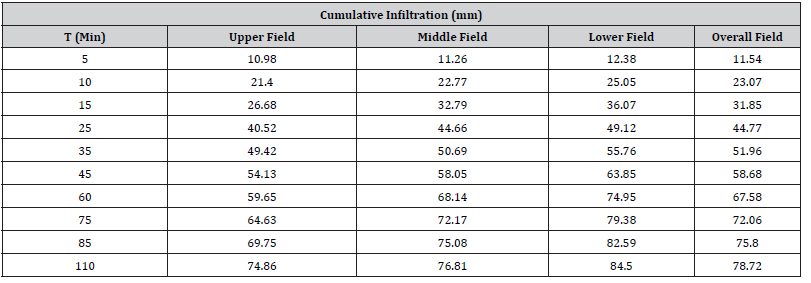
Furrow advance flow rate is largest at the head of the furrow and became successively smaller at each point downstream because of the water lost to infiltration into the soil. The result is due to a reduction in the rate of advance at successive points downstream. The infiltration rate measurement result shows that at initial stages, the infiltration rate was rapid but after a while infiltration decreased to a rate which is relatively consistent and getting approached to basic intake rate. Similar research output was presented by [20]. Taking time and cumulative infiltration column from the above infiltration data collected from the field, Table 1, as input data, a graph of measured infiltration curve was plotted using Microsoft excel. The coefficient and exponent of this displayed equation is considered as constant (m) and exponent (n) of the infiltration function. The equation of measured infiltration function as shown on Figure 8 below is I=5.5163 T0.6036 and hence the value of m=5.5163 and n=0.6036
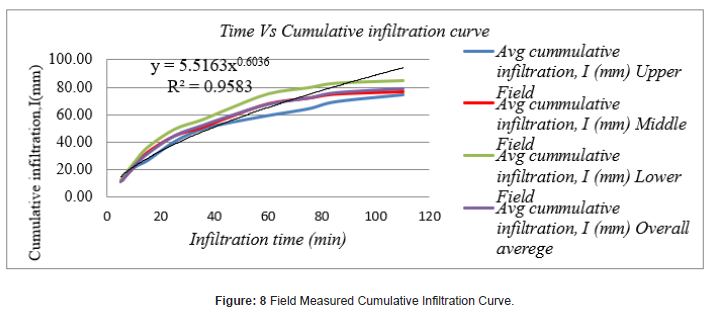
Power regression was particularly to model Kostiakov equation and was carried out using Microsoft excel. The procedural steps were log data generation of infiltration and time using measured values, transforming these data using natural logarism, analyzing the data using Data Analysis Tool and then applying power exponent to determine “m” and “n” (Figure 9).
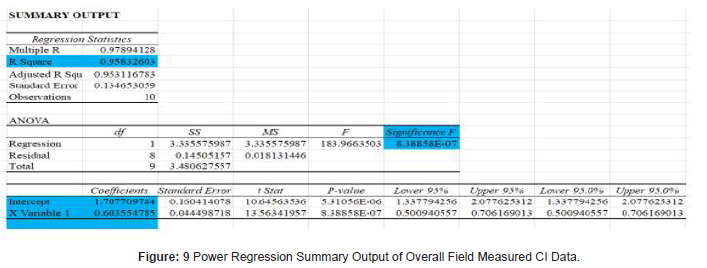
The above regression summary output of overall field for measured cumulative infiltration data was analyzed and model parameters and general equation displayed as shown on the last raw of Table 2 (Table 2).
Table 2:Measured Data Model Result Summary.

Power regression best fit calculated values of “m and “n” were computed and compiled as shown in Table 2. with respective cumulative infiltration equation and R2. Taking overall average values (m= 5.51631345046998 and n= 0.603554785), Kostiakov equation is I=5.51631345046998 T0.60355478. But R2 Value which is 0.9583 is far from unity and “Significance F”, 8.38858* 10-7 as displayed on power regression summary output of figure 10 is relatively big which indicates that “m” and “n” value is not best fitted, and hence further power regression is required to decide whether model equation I=5.51631345046998 T0.60355478 is best fitted equation or not. The coefficient and exponent of this displayed equation is considered as constant “m” and exponent “n” of overall field calculated cumulative infiltration function. The equation of overall calculated cumulative infiltration function as shown on figure 10 below is I=5.5163 T0.6036 and hence the value of m=5.5163 and n=0.6036 (Figure 10).
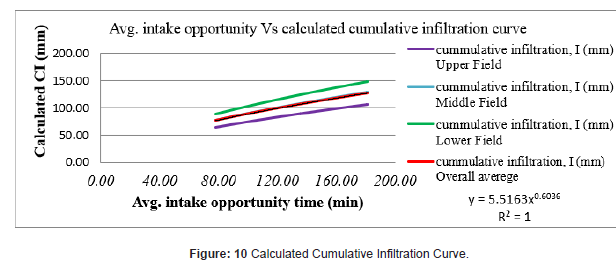
As shown on displayed equation of figure 10, R2 Value which is unity and “Significance F”, 6.5218* 10 -279 as displayed on power regression summary output of overall field for calculated cumulative infiltration data of figure 11 is significantly small which indicates that “m” and “n” value is best fitted and hence model equation I=5.51631345046998 T0.60355478 is best fitted equation.
Therefore, best fitted Kostiakov model equation of study area cumulative infiltration is I=5.51631345046998 T0.60355478 and calculated cumulative infiltration data is more descriptive than measured cumulative infiltration data (Figure 11).
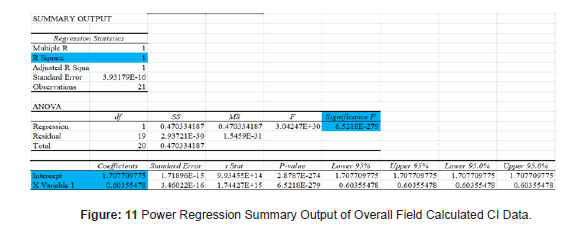
The above regression summary output of overall field for calculated cumulative infiltration data was analyzed and model parameters and general equation displayed as shown on the last raw of Table 3 (Table 3).
Table 3:Calculated CI Data Model Result Summary.

Measured and calculated cumulative infiltration depth was compared and shows that cumulative infiltration depths measured using furrow bund method was high at initial stages and slow at latter stages than calculated cumulative infiltration depth using developed empirical Kostiakov model equation. Though the figures are different the difference between observed and calculated values is small and it is one advantage of Kostiakov model [24]. Finally, the infiltration equation and its parameters were given in Table 3 and the performance of the model in terms of coefficient of determination was given.
Texture and Bulk Density
To characterize soil in the experimental site in terms of texture, moisture content and bulk density, soil analyses were undertaken, and results are presented in Table 3. The bulk density varied between 1.55 g/cm3 and 1.61 g/cm3. The top surface soil has the lower bulk density than subsurface soil for the study area. This indicated that soil structure down depth wise was more compacted and it may be the result of hard pan formation due to compaction by heavy duty machine (Table 4).
Table 4:Texture and Bulk Density.

Soil Moisture Content: Before and 24 hours after irrigation moisture contents were varying in depth (Table 5). The top 0-30 cm soil depth had low average value while the value was increasing as depth increases from surface downward. The soil moisture content varied from 25.06 % to 42.60 % before irrigation and from 32.74 % to 52.35 % after irrigation by weight basis. The total available water (TAW) is directly related to variation in before and 24 hours after irrigation. Mean value of TAW per 1 cm depth were found to be 1.274 mm (Table 5).
Table 5:Soil Moisture Content before Irrigation and after 24hr Irrigation.

Soil Moisture Depletion: The actual soil moisture depletion (SMD) at time of irrigation was computed for the study area using soil moisture content by gravimetric method. It was computed using equation 11 (Table 6).
Table 6:Actual Soil Moisture Depletion Depth (mm).

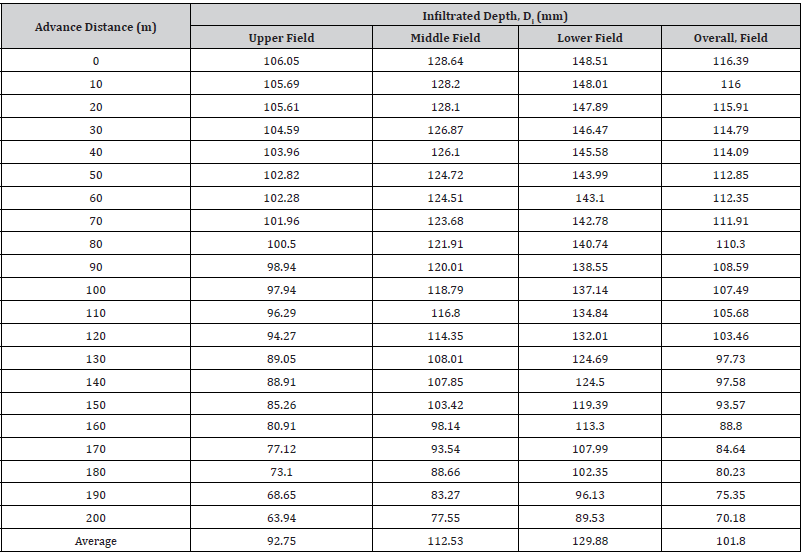
Depth of Water Application: The water application depth for the study area was 140.56 mm. Variations in irrigation time within the study area per different furrows were observed. The downstream furrow was irrigated using more irrigation time duration than upstream and middle furrows and hence more irrigation water was supplied. During the study, it was observed that, the application of irrigation water was not at regular intervals (Table 7).
Table 7:Irrigation Water Application.

Overall elapsed time (sec) in Table 7 was taken the average value of each field for three irrigation seasons. And respective discharge (l/s) was taken the average flexi-flume outlet discharge multiplied by the total number of furrows (60). While the size of each field block was determined by dividing the study area field into three equal partitions of 20 furrows each. Table 7 indicates that the amount of applied irrigation water, 140.56 mm, is greater than the required depth 114.69mm which is due to encountered losses [25]. The actual moisture stored (AMS) in the soil was determined from field evaluation data during irrigation using volume balance method and was calculated (Table 8) using equation 9 (Table 8). The actual moisture stored (AMS) in effective root zone of the soil shows that relatively high-water depth was stored in the root zone for upstream part of the furrow than downstream and may be significantly high intake opportunity time to the upstream.
Table 8:Actual Water Stored (mm).
Irrigation Efficiencies
Application Efficiency: After determining all the input parameters, the application efficiency of the scheme was determined using the quantity of water stored in the root zone and the quantity of water released to the field inlet. Table 9 shows the application efficiency of study area (Table 9).
Table 9:Actual Water Stored (mm).

As observed in Table 9, average application efficiency of the study area was 78.74%. Application efficiency extremely depends on soil type and moderately on furrow length, discharge rate and slope [26]. Similarly, [27] reported the maximum attainable application efficiency for furrow irrigation system in Sugar Cane Farm at 3% slope ranges from 30-90%. In this study, since the selected fields have all favorable parameters for having better application efficiency i.e. heavy clay soil type, gentle slope of 0.05% and 200m furrow length that confirms 78.74 % mean value is attainable.
Storage Efficiency: Storage efficiency measures the ability of irrigation to meet the required amount of water. It relates to the actual stored to required amounts of water needed for crop irrigation in the system [8]. By monitoring storage efficiency, the statutes and management of the irrigation system can be overseen [28], [8]. The storage efficiency of the study area was computed using equation 9 as 97.19%. Storage efficiency less than 100% indicates the existence of deficit irrigation. For this research the deficit is acceptable with space for rain case (Table 10)
Table 10:Storage Efficiency of the Study Area.

According to [29], optimum attainable storage efficiency is 87.5%. Depending on weather, type of soil and time span considered, effectiveness of stored soil water might be as high as 90% or as low as 40% [30]. The result 87.29% is nearly the same as previously published research finding [29] and supporting scientific reason of free space for sudden rain case.
Distribution Uniformity: One measure which emphasizes how evenly water is applied throughout a field is distribution uniformity (DU). DU was computed using equation 13 (Table 11).
Table 11:Storage Efficiency of the Study Area.

Analysis of infiltration depth or sub surface storage along the furrow shows that it is fairly distributed. The analysis was considered the overall furrow length and the first low quarter one. According to [31], distribution uniformity of the study area which is 80.67% is found under high category and indicates that the distribution is relatively uniform over the entire field [32]. Another research conducted by [5], explains that the result of DU, 80.67% which is greater than 80% confirms that there is relatively reasonable combination of irrigation technical parameters. Similarly, the same research conclusion was found by [33] stated as the value of DU increases as the flow rate increased regardless of furrow lengths and decrease as the furrow length increase. Similar research result was found by [5] that with the same slope, distribution uniformity will decrease when the furrow length increases.
Conclusion and Recommendation
Conclusion
For this research, cumulative infiltration was estimated using standard and dimensionless form of Kostiakov model for heavy clay soil. Data analysis using Microsoft excel reveals that the application of nonlinear optimization power regression technique to estimate parameters of standard form of Kostiakov model result is more accurate estimation of cumulative infiltration. The result of coefficient ‘m’ and exponent ‘n’ for developed infiltration model was found to be 5.52 and 0.60 respectively with the value of coefficient of determination, R2 result equals to unity. This coefficient of determination, R2 which is a measure of how measured values are well replicated and hence indication of realistic model development confirms that calculated constants are best fit values. Irrigation systems should be evaluated on a regular basis to ensure that the systems are well maintained and are performed according to design manner. Application efficiency, distribution efficiency and distribution uniformity are irrigation performance parameters that correlate best with furrow irrigation variables (inflow discharge, furrow length, and time of irrigation cutoff) and can be used for design, management, and operation of furrow irrigation systems. The results of the study conducted show that more attention needs to be paid to the storage efficiency and distribution uniformity of an irrigation system. To improve the distribution uniformity of irrigation systems they need to be properly maintained and operated. The results also show that a well-maintained and correctly operated system can achieve or exceed a distribution uniformity that is considered reasonable and acceptable. An irrigation system can have low application efficiency and have good DU. Even though the irrigation water requirement is not achieved due to poor supply and evaporation loss, the entire field may receive the applied irrigation water more uniformly for well graded furrow. So the result of application efficiency, storage efficiency and distribution uniformity could still lead to crop stress and reduced yields which need to be improved further. It is only possible to achieve high application efficiencies with minimal deficit irrigation if the DUs are high.
Recommendation
This study used the Kostiakov equation as an empirical model for estimating the infiltration function. However, using another empirical model (i.e., the modified Kostiakov model, which includes more empirical parameters) increases the accuracy of the estimated infiltration model. Additionally, the changes in the soil water content were observed at twenty locations along three sample furrows with 200m length. However, observing the soil water content at more furrows increases the accuracy of the model parameters. It is necessary to give intensive practical training to the irrigators about economical application of water at the field applying appropriate depth of irrigation water and following irrigation interval in order to practice efficient use of water, and to avoid water logging problem at field due to poor water management, Considering the field is precision leveled and recently developed scheme the calculated efficiency and distribution uniformity is not at good level. On the other hand, the long-term plan of the company shows that irrigation water supply of the farm will be purchased. To make future water purchase expense as small as possible and to maximize company profit, it is required to manage irrigation practice and irrigation water use management.
Acknowledgment
None.
Conflict of Interest
No conflict of interest.
References
- Awulachew S, Girma B (2010) Performance of Irrigation: An Assesment at different scales in Ethioipia.
- Dejen ZA, Schulth B, Haydel L (2012) Comparative Irrigation Assesment in Community managed Schemes in Ethiopia.
- Dagninet A, Anteneh A (2019) The determinants of irrigation participation and its impact on the pastoralist and agro-pastoralists income in Ethiopia: A review study. Cogent Food & Agriculture 5(1): 1679700.
- Haile GG, Kasa AK (2015) Irrigation in Ethiopia A review. Acad 3(10): 264-269.
- Wu D (2017) Simulation of irrigation uniformity and optimization of irrigation technical parameters based on the SIRMOD model under alternate furrow irrigation electronic version, Beijing: Center for agricultural water research in China.
- Katie R, Craig H, Norbert H (2014) Indicators of Sustainable Agriculture. Working Paper.
- Merriam J, Keller J (1978) Farm Irrigation System Evaluation. Logan, Utah.
- Molden D, Gates T (1990) Performance Measures for Evaluation of Irrigation Water Delivery Systems. Irrigation and Drainage Engineering, pp. 804-823.
- TS Strelkoff, AJ Clemmens, M El-Ansary, M Awad (1999) Surface Irrigation Evaluation Models Applications to Level Basins in Egypt. Transactions of the ASAE 42(4): 1027-1036.
- Rogers D, Lamm F (1997) Efficiencies and Water Losses of Irrigation Systems. Irrigation Management Series.
- FAO (1986) World and regional reviews Financing Agricultural Development Programme.
- Molden DJ, R Sakthi Vadivel, CJ Perry, Ch De Fraiture (1998) Indicators for Comparing Performance of Irrigated Agriculture Systems. Research Report 20: 22-32.
- SGI & SC (2013) Kuraz Headworks Appurtenant Structures Detailed Design Hydrological and Flood Analysis. Hydrological and Flood Analysis Design Report.
- WWDSE & SDCSE (2013) Kuraz Sugar Development Project Sectoral Study Reports. Climatology and Hydrology Study Report.
- WWDSE & SDCSE (2013) Kuraz Sugar Development Project Feasibility Study and Detail Design. Soil Survey and Land Evaluation Study Vol 5.
- Kamara C, Haque I (1991) Soil Physics Mannual:Soil Science and Plant Nutrition Section. Working Document- No B12.
- FAO (2009) Harmonized World Soil Data Base. March Volume Version 11.
- Walker WR (1989) Guidelines for Designing and Evaluating Surface Irrigation Systems. FAO Irrigation and Drainage Paper, pp. 148.
- Hafiz Umar Farid, Zahid Mahmood-Khan, Ijaz Ahmad, Aamir Shakoor, Muhammad Naveed Anjum, et al. (2019) Estimation of infiltration models parameters and their comparison to simulate the onsite soil infiltration Characteristics. International Journal of Agricultural & Biological Engineering, pp. 84-91.
- Yonts E, Varner DL (2007) Irrigation Operations & Management; Managing Furrow Irrigation Systems.
- Abiyu A, Alamirew T (2015) Evaluation of Stage-Wise Deficit Furrow Irrigation Application on Water Advance-Recession Time and Maize Yield Components at Koga Irrigation Scheme, Ethiopia Journal of Natural Sciences Research, Vol 5.
- Burt CM, Clemmens AJ, Strelkoff TS, Solomon KH (1997) Irrigation performance measures: Efficiency and uniformity. Irrigation and Drainage Engineering 123(6): 42-44.
- Salahou MK, Jiao X, Lü H, Guo W (2020) An improved approach to estimating the infiltration characteristics in surface irrigation systems.
- Adindu R, Igbokwekelechi K, Omowunmi T, Ike-Amadi CA (2014) Application of Kostiakov’s Infiltration Model on the Soils of Umudike, Abia State- Nigeria. American Journal of Environmental Engineering 4(1): 1-6.
- USDA (2014) Irrigation water management.
- Raine S, Bakker D (1996) Increased Furrow Irrigation Efficiency through better design and management of Cane Fields. Proceedings of the Australian Society Sugar Cane Technologists.
- ME Qureshi, MK Wegener, KL Bristow, SR Harrison (2001) Economic Evaluation of Alternative Irrigation Systems for Sugar Cane in Burdekin Delta in North Queenlands, Australia. Progress in Water Resources 48: 1-11.
- AJ Clemmens, MGBos (1990) Stastical Methods for Irrigation System Water Delivery Performance Evaluation. Irrigation and Drainage System 4: 345-365.
- Raghuwanshi N, Wallender W (1998) Optimal Furrow Irrigation Scheduling under Hetrogeneous Conditions. Sl: Agricultural Systems 58(1).
- Hassen YK (2004) Assessment of Small Scale Irrigation Using Comparative Performance Indicators on Two Selected Schemes Awash River Valley, pp. 30-85.
- Blain H (1996) Simple Way to Estimate the Distribution Uniformity of Furrow Irrigation Systems.
- Irmak S, Odhiambo LO, Kranz, WL, Eiesenhauer DE (2011) Irrigation Efficiency and Uniformity, and Crop Water Use Efficiency. Biological Systems Engineering 451: 1-9.
- Gudeta GK (2020) Effect of Furrow Irrigation Technical Parameters on Field Application Performances of Short Furrow and Yield of Onion Crop in Bako, Ethiopia. International journal of engineering research and technology 9(06): 1-7.
-
Yilkal Zewude and Tamene Mojira*. Evaluation of Furrow Irrigation Efficiency: A Case of Omo Kuraz - III Sugar Factory Irrigation Farm, SNNPR, Ethiopia. Cur Trends Civil & Struct Eng. 9(2): 2022. CTCSE.MS.ID.000706.
-
Furrow irrigation, Infiltration, Irrigation efficiency, Uniformity, Omo kuraz - III irrigation scheme
-

This work is licensed under a Creative Commons Attribution-NonCommercial 4.0 International License.


