 Research Article
Assessing Water Security Through a Set of Consistent Metrics and Application to Water Funds in Latin America
Fernando Miralles-Wilhelm1,2*, Rocío Sanchez-Maldonado3 and Raúl Muñoz-Castillo4
1The Nature Conservancy, Arlington VA, USA
2George Mason University, Fairfax VA, USA
3The Nature Conservancy, Bogotá, Colombia
4Inter-American Development Bank, Washington DC, USA
Fernando Miralles-Wilhelm, George Mason University, Fairfax VA, USA.
Received Date: July 28, 2022; Published Date: August 10, 2022
Abstract
This paper provides an overview of existing methodological approaches to assess water security in Latin America through a set of quantifiable metrics. A framework to develop these water security metrics is proposed based on a literature review of existing approaches and sources of data that can be mined to quantify these metrics. As a case study application, the proposed water security metrics framework is applied to a group of sites within the Latin America Water Funds Partnership to understand its applicability, challenges in implementation, help identify information gaps, and provide an initial assessment of water security in the region. One important aspect that this metrics framework intends to capture is the multisectoral nature of water security. The five metrics proposed in this work cover water scarcity (balance between physical supply and total demand), household water security (domestic demand met), economic water security (sectoral demand met), environmental water security (water quality) and water security toward disaster risk reduction. Other challenges to water security in the region that are long-standing can be incorporated into this framework in future iterations. Such metrics could include the provision of infrastructure and sanitation services, institutional/governance capacity, ecosystem services, among others. Given the complex interaction between water-using sectors, it is imperative to move from traditional sectoral management approaches, in which decision-making and investment planning are carried out as if the sectors (water and sanitation, agriculture, energy, others) independent of each other, and transition to an integrated approach to planning the development of water resources and their use. Apart from promoting economic and resource efficiency, this integrated planning framework is important to avoid unintended consequences and potential water security conflicts in the coming decades in the Latin America region. This initial water security metrics framework represents an important practical development in this direction.
Background and Objectives
The countries of the Latin America region are in a state of perennial change. The population has been migrating to the main cities for several decades, often resorting to living in irregular developments with limited availability and quality of water. Many of the major cities are on the coast and depend on small coastal basins or distant mountains for water resources. The headwaters of the basins are subject to deforestation and land conversion to agriculture. Prolonged meteorological drought events (lack of rain) are affecting surface flows, making hydrological droughts more and more frequent, thus interrupting the water supply in cities. On the other hand, freshwater sources such as tropical glaciers are rapidly retreating, and it is expected that within the next two decades most of those below 5000 meters above sea level will disappear. In the same way, mountain ecosystems, such as the moors, have been disappearing or decreasing their natural storage and regulation capacity. Climate change along with changes in land use, product of a rapid and unsustainable expansion of the agricultural frontier, is affecting the availability and quality of water resources both in the short and long term, both in rural and urban areas. This situation represents a critical danger for water security in the entire region, placing highly populated areas and under an arid or semi-arid climate in a particular situation of vulnerability.
Water Security is the ability of a population to safeguard sustainable access to adequate amounts of water of acceptable quality for the sustainability of livelihoods, human wellbeing, and socio-economic development, to ensure protection against water-borne pollution and disasters related to water, and for the conservation of ecosystems in a climate of peace and political stability [1]. In this context, water security refers to the possibility of access to sufficient amounts of water to satisfy the diversity of water uses, the preservation of the quality of water resources, and due consideration of climate change in: (i) planning of water infrastructure, (ii) regulation of flows, (iii) management, preservation, and economic valuation of ecosystem services around water and (iv) management of floods and risks of natural disasters.
Progressively, water security has become one of the main challenges to face for sustainable development; Water resources are the main channel through which the impacts of climate change will be felt on the main engines of growth in the world economy: agriculture, energy, industry and the urban sector. For example, in the agricultural sector, changing precipitation and temperature patterns have already significantly alternated agronomic productivity, irrigation potential, and the comparative advantage of some nations. In regions with less reliable water supplies, infrastructure and services in growing cities could exacerbate underlying shortages, potentially limiting urban growth patterns. In the energy sector, plans to reduce greenhouse gas emissions are often based on often optimistic assumptions about the availability of sufficient water for a massive expansion of biofuel and hydroelectric power generation capacity; water is also necessary for cooling fossil fuels and other forms of power generation. Other consequences related to water security include possible effects on human health and changes in natural habitats, watersheds and biodiversity. In fact, the increase in temperature, a product of climate change, brings with it not only changes in the hydrological patterns as mentioned above, but also affects the quality of the resource. Climate change together with eutrophication phenomena, the product of waters that are over-enriched with nutrients, are helping with the proliferation of cyanobacterial outbreaks. These are extremely dangerous eukaryotic bacteria for human health with great adaptability to higher temperatures. Water security is also a social, economic and political problem. Long-term sustainability of water resources must be framed within adaptation to changing climate conditions, land use, and changing population demographics. Water security is a matter of growing concern due to the availability of this vital resource and how to manage it to respond to the challenges posed by human demand in various sectors, and by environmental, socioeconomic and climate changerelated considerations. Water resources are frequently under stress by the agriculture sector, which is responsible for approximately 70% of total global freshwater withdrawals (FAO 2011a). Variability and climate change determine spatial and temporal variations in water availability, with an intensification of fluctuations in the hydrological cycle, causing an increase in flood and drought events. This could increase competition between sectors for water, such as agriculture, the world’s largest consumer of water, but also power generation, drinking water supply, as well as the environment. Specifically in the Latin American region, population and per capita income continue to grow, which in turn increases the demand for water, especially in rapidly growing countries. It is becoming increasingly clear that restrictions on water security can affect other sectors (eg, food production, power generation) with measurable consequences for general social well-being [2-5].
In comparative terms, the Latin America region is characterized by the abundance of water as a whole, but with great spatial and temporal heterogeneities, a critical dependence on agricultural economic production, and diverse and growing energy sectors that increase the pressure on water security. According to estimates by the Food and Agriculture Organization (FAO), approximately 32% of the world’s renewable water resources can be found in the Latin American region. However, the great spatial variability in the distribution of these resources translates into surprising contrasts such as the rainfall pattern of the Amazon basin versus the arid or semi-arid climate conditions found in northern Chile, northern and central Mexico. and in the northeast of Brazil. The temporal dimension refers to the natural variability of the climate of the region, in which strong anomalies in rainfall are modulated within a range of time scales [6-8]. The prospect of climate change with changes in the hydrological cycle and the increasing demands for water driven by population growth and economic growth pose important challenges for the future of water security strategies in the region.
This paper provides an overview of existing methodological approaches to assess water security in the region of Latin America through a set of quantifiable metrics. A framework to develop these water security metrics is proposed based on a literature review of existing approaches and sources of data that can be mined to quantify these metrics. As a case study application, the proposed water security metrics framework is applied to a group of sites within the Latin America Water Funds Partnership (LAWFP: https://www.fondosdeagua.org/) to understand its applicability, challenges in implementation, help identify information gaps, and provide an initial assessment of the LAWFP portfolio.
Literature Review
This section reviews conceptual aspects, metrics of basic needs, multidimensional indicators, and methodological issues related to water security indicators that are pertinent to Water Funds in general and the LAWFP in particular.
Conceptual aspects of water security indicators
This definition of water security [1] has two essential elements: (i) the multidimensional nature of water security across different water uses; and (ii) a risk-based approach to inform how societies cope with water-related risks including floods, droughts, and contamination. Complementary to this definition is its slightly revised version: “Water security is a tolerable level of water-related risk to society [9]. Substituting the adjective “acceptable” with “tolerable,” this definition emphasizes water security’s communityspecific social, economic, and cultural values. Water risks usually become less tolerable with increasing levels of economic growth and wealth. Thus, perspectives may change depending on socioeconomic conditions over time and across geographies, making the concept of water security dynamic. These definitions reflect the changing global policy dynamics on adopting the 2030 Agenda for Sustainable Development by the United Nations in 2015. If Millennium Development Goal 7 (target 7.3) focused on access to safe drinking water supply and basic sanitation, the Sustainable Development Goals (SDGs) represented a paradigm shift. SDG 6 (clean water and sanitation) looks beyond drinking water supply and sanitation (targets 6.1 and 6.2) to encompass aspects of water quality and wastewater (target 6.3), water use and efficiency (target 6.4), IWRM (target 6.5), ecosystems (target 6.6), and enabling environment (targets 6.a and 6.b). This changed mindset reflects an acknowledgment of the complexities of water resources management and the urge to revisit existing paradigms with integrated approaches by bringing together different sectors and stakeholders. To address current challenges, a rapid change of the economics, engineering and management frameworks that guided water policy and investments in the past is needed, bringing resilience, governance, and innovative finance into the management equation [10].
In risk terms, water security is concerned with the consequences and perceptions of chronic hazards and extremes and with the factors influencing exposure and vulnerability. Geographic and socioeconomic disparities in access to safe drinking water and vulnerability to extreme events have also stimulated interest in the relationship between water security and development. This has required careful efforts to define indicators of water security to elucidate the causal linkages among water-related hazards and impacts. Indicators of water security measure hazards and their impacts; they range in coverage from a single component to multiple dimensions and vary in spatial and temporal resolution [11,12]. Water security indicators are subject to all of the same conceptual and methodological issues associated with indicators more generally, namely, problems with complexity and causality, difficulties constructing composite indicators based on multiple components, and a lack of reliable and comparable data [13]. A riskbased framework differentiates hazard, exposure, and vulnerability as measurable quantities [14]. Water security indicators are concerned with risk in terms of the frequency and severity of rare hazardous events, such as those related to climatic variability and extremes (e.g., droughts, floods, unpredictable timing of rainfall or runoff). They are also focused on chronic hazards associated with the lack of access to water supply and sanitation, poor water quality, insufficient water quantity for food and energy production, and degradation of ecosystem services [15]. Water indicators have proliferated: Plummer et al. [12] identify 50 water vulnerability assessment tools. Water security, from a risk-based perspective, implies particular challenges for the development of indicators because risk is not a measurable quantity, is highly context dependent, and depends on the perceptions of and attitudes toward risk of various stakeholders. Thus, any metric is bound to be a composite incorporating elements of hazard, vulnerability, exposure, and perhaps also adaptive capacity from a range of perspectives [14]. In practice, many water indicators, including long-standing ones related to basic water needs, are now being incorporated into a basket of metrics that may contribute to the development of indicators of water security [16,17].
Measuring basic needs: drinking water, food, and ecosystems
Since the 1980s, indicators of water security have concentrated on the water needed for self-sufficient food production [18,19] and drinking water and sanitation [20,21] used measures of annual renewable water availability per capita to identify thresholds associated with self-sufficiency in food production, namely, 1,700 m3/(person·year) (stress), 1,000 m3/(person·year) (scarcity), and 500 m3/(person·year) (absolute scarcity). Allan [22] has established a threshold of 1,200 m3/ (person · year) for water security, although international trade can buffer local water deficits by importing water-intensive commodities. Measured at the national level, neither of these metrics of water security for food production accounts for spatial variation within the country or for seasonal or interannual variability [23]. Metrics of drinking water security have been the focus of extensive monitoring and management through the Joint Monitoring Program (JMP) for Water Supply and Sanitation of WHO and UNICEF, which has expanded in the context of the MDGs. In the mid-1990s, Gleick [21] estimated basic human water needs for drinking, sanitation, bathing, and food preparation to be a total of 50 L/ (person · day). Howard & Bartram [24] refine these thresholds in terms of no access [<5 L/ (person · day)], basic access [20 L/ (person · day)], intermediate access [50 L/ (person · day)], and optimal access [>100 L/(person·day)]. Monitoring of access to improved drinking water and sanitation has provided a baseline to track progress in meeting basic needs, triggered by the International Drinking Water Supply and Sanitation Decade in the 1980s [25]. The proportion of the global population with access to improved drinking water increased from 76% in 1990 (4.0 billion total) to 89% (6.3 billion total) in 2012, and the proportion of the global population with access to improved sanitation increased from 49% (2.6 billion) to 64% (4.5 billion) during the same period [26].
The MDG target is to halve the proportion of the population without access to safe drinking water and sanitation. Hope & Rouse [25] identify three challenges for drinking water security: population growth, regional variation in access, and monitoring uncertainty. First, countries with low baselines and high population growth face larger challenges [27]. In sub-Saharan Africa, for example, there has even been a net increase in the population—in absolute terms—without access to improved water supplies even though the proportion with access increased by 16 percentage points between 1990 and 2012. Second, access varies regionally; many of the populations that are most difficult to reach and in the greatest need experience lags. Third, there are methodological challenges to establishing accurate and comparable metrics [25]. On top of these deficits, the JMP recognizes that improved water supplies are not always safe; piped water in many major developing country cities is contaminated and may be inadequate in other ways (e.g., distance, reliability, cultural acceptability, affordability). Bulk averages also mask disparities within countries (urban/rural) and by wealth, religion, ethnicity, and education level. Meeting basic water needs for food security also poses challenges, as 70% of global water withdrawals support irrigation, in addition to the rainfall used for rainfed agriculture. The population exposed to severe water stress for food production is projected to increase [28]. The Irrigation Water Supply Reliability index provides a supply-demand ratio: water available for irrigation (i.e., supply) as a proportion of the total potential demand for irrigation water. The index is projected to decrease from 0.71 globally in 2000 to 0.66 in 2050, indicating intensifying scarcity. The index varies regionally; water-stressed regions are the hardest hit, particularly during lowflow years [29]. These metrics of basic water needs and water for food provide a baseline against which recent trends and future projections can be understood to inform policy and management decisions. There is increasing recognition that the water needs of people and agriculture depend on the goods and services generated by ecosystems [30]. Environmental water security has been conceptualized and measured using an ecosystem services framework. The Asian Development Bank [16], for example, has developed a river health index following the themes and drivers identified by Vorosmarty et al. [31]: watershed disturbance, pollution, water resource development, and biotic factors.
The multidimensional nature and drivers of water insecurity: composite indices
The links between water security and sustainability and between water security and economic growth have required indicators that account for interacting physical and human-driven hazards and causal processes. Srinivasan et al. [32] note that the nature and sources of the global water crisis vary regionally across different patterns of demand, supply, infrastructure development, and governance. Understanding the nature of the water crisis and the determinants of water insecurity are prerequisites for informed decisions about institutional development and infrastructure in- vestment. Water security is also considered part of a web of interrelated concerns about energy, national, and food security [33]. Water use as a proportion of total renewable supplies (the water exploitation index) is used to calculate water stress. Population growth, urbanization, and food security are important drivers of these conventional measures of water stress [34]. However, the ratio of water use to availability does not account for deficits in infrastructure to make use of available water and to buffer against seasonal and interannual fluctuations [23]. Water stress and water scarcity indicators have therefore distinguished physical water scarcity from economic water scarcity. The former refers to high levels of water use as a proportion of available supplies, whereas the latter refers to inadequate access to water infrastructure to make use of available water [35]. Measures of economic water scarcity identify parts of Africa where water infrastructure, not water availability, is the limiting factor. Population and infrastructure are also a major influence on exposure to extreme events such as flooding. For example, population growth and poorly managed infrastructure drove a doubling of exposure to extreme rainfall events in South America between 1960 and 2000 [36].
Multiattribute indicators assess the coincidence of hazards at multiple scales, including at high spatial resolution [31, 37]; at the country level, particularly in Asia [16]; and for transboundary waters (see Table 1). Composite indicators increasingly combine chronic and episodic hazards. For example, the seven elements of the 2000 Ministerial Declaration of The Hague on Water Security in the 21st Century [38] included the basic needs of drinking and food but also the importance of risk management and transboundary cooperation. Lautze & Manthrithilake [17] provide a multidimensional index of water security that accounts for five dimensions: basic needs, agriculture, environment, risk management, and independence (the last being a function of water generated within a country). The Asian Development Bank [16] has also compiled a multiattribute metric based on household, economic, urban, and environmental water security as well as resilience to water-related disasters. This approach has the potential to obscure which subcomponents are the drivers of water security. The water vulnerability assessment tools identified by Plummer et al. [12] vary in terms of their location and sociopolitical context, scale, and number of dimensions. Key dimensions include water resources, other physical attributes, economic aspects, social characteristics, and institutions. Physical attributes and economic aspects are well represented by 100% and 66% of the 50 vulnerability indices, respectively. By comparison, institutional and social dimensions were captured in only 34% and 26% of the indices, respectively. They emphasized the importance of holistic measures that account for social and ecological factors, as well as the capacity for IWRM.
Table 1:Selected water security indices and their multiple attributes (source: Garrick and Hall, 2014)..
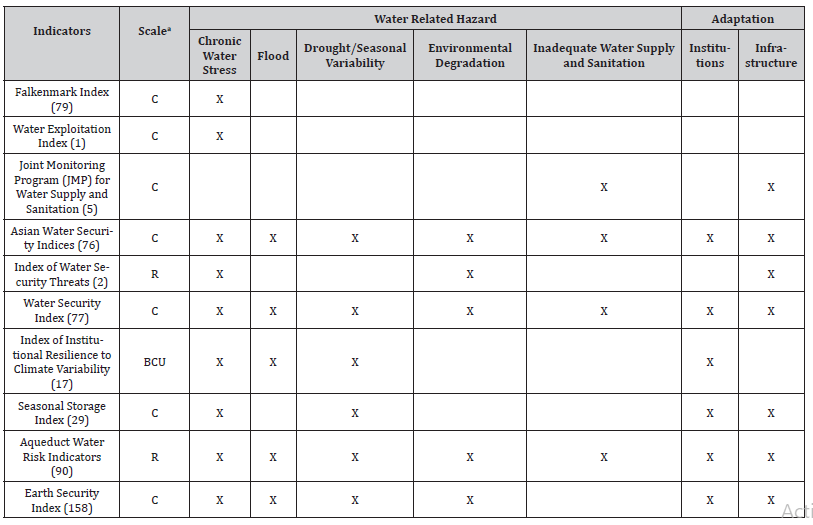
aScale abbreviations: C-Country; R-High-Resolution; BCU-Basin Country Unit (Special portion of a transboundary river Falling within a single country)./
Limited attention has been paid to the development of indicators of the adaptation actions that have been taken to reduce water-related risks. Hallegatte et al. [39] acknowledge this gap in their analysis of flood risk to port cities. Global data on water-related infrastructure investments are emerging from a variety of sources, and global water resource assessments have begun to incorporate reservoir storage and operation [40] and assessments of investment needs [41]. However, these assessments do not indicate how much risk has (or could be) decreased as a consequence of these investments. Monitoring of the effectiveness of infrastructure investments has mostly taken place at national and local scales, most recently in the context of development of adaptation indicators [42], though seldom specifically in terms of water security. Several recent initiatives aim to measure institutional dimensions of water vulnerability and adaptation, highlighted by the OECD Water Governance Initiative (WGI) [43]. The OECD has organized a framework for conceptualizing and measuring water governance capacity. The WGI addresses multilevel governance gaps across seven categories measured at the country scale, including policy and financial gaps. This builds on prior water governance indicators at the country level, including the Asia Water Governance Index [44] and its precursors [45], which are based on water policy, law, and administration. Neither the OECD Water Governance Initiative nor the Asia Water Governance Index explicitly address water security risks or the role of local or transboundary water governance and institutions.
The specter of water wars and risk of violent conflict between countries sharing international transboundary rivers have spurred efforts to measure conflict and cooperation and their institutional determinants. Institutional capacity influences whether countries cooperate over shared watercourses; conflicts are expected to occur when rapid change (environmental or social) outstrips institutional capacity to absorb it [46,47]. Indicators of institutional capacity in transboundary waters measure the presence or absence of treaties and river basin organizations [48]. More recently, indicators have gone beyond presence or absence to capture the quality of these institutions and attributes of institutional design associated with strong performance, such as membership and financial capacity [49]. Measures of institutional resilience have also been tailored to the specific water-related risks associated with climate variability. In addition to treaties and river basin organizations, institutional resilience to climate variability is expected to depend on water allocation mechanisms, variability management provisions, and conflict resolution [50]. One global analysis of institutional resilience to climate variability compared current conditions with future projections for 2050 and identified Northern and sub- Saharan Africa as at greatest risk today and Western Asia, Eastern Europe, and Latin America as at increasing risk in the future [50].
Water indicators, development, and causality
The uneven distribution of water risks has focused attention on the linkages between water and development. Vorosmarty et al. [31] describe the residual water security threats—the adjusted human water security threat—after accounting for the effects of infrastructure investments to enhance water security. Of the regions with high water security threats, the regions with the highest incomes have the greatest capacity to reduce their residual threats. For example, the Western United States and Europe have invested heavily to reduce their residual water security threats by up to 95% from unadjusted threat levels, whereas low and low-middle income regions face the highest residual water security threats (affecting more than 3 billion people). This high-resolution global analysis corroborates more localized, case-specific evidence on geographic disparities in capacity to cope with water security threats. The existing evidence about the relationship between water security and development raises complex questions about causality. How does water security or its absence influence economic development? Is water security a precondition for economic development, or can it be achieved as a by-product of wider economic development that provides the capacity to invest in risk reduction measures [51]? Macroeconomic modeling has been used to address these questions by identifying the effects of tropical climate dynamics on economic development [52, 53]. Using malaria risk as an explanatory factor, Sachs [53] critiqued studies that identified institutional quality as the dominant influence on development [54]. Brown et al. [55,56] have examined the impact of climate hazards on economic wealth and growth. They found that a positive correlation exists between measures of climatic variability and poverty [11]. South Asia was identified as a hot spot where soft and hard infrastructure is insufficient to manage interannual and seasonal climate variability. Extreme events are a particularly hazardous form of climate variability; global cross- country modeling indicates that a 1% increase in drought (flood) area reduces the GDP growth rate by 2.8% (1.8%) [56].
In addition to these water security indicators there are urban sustainability and resilience indicators that include water issues, such as the Green City Index [57] which includes one category of water indicators, the City Resilience Index [58] with 52 indicators of which several link to water, and the SDEWES Index [59], which includes a category for water and environmental quality. Furthermore, there are several composite water security indices developed for basin or country comparisons [16, 17, 31, 37]. The National Water Security Index from ADB [16] includes five aspects, of which one is urban water security. Urban water security is measured through indicators of water supply, wastewater treatment, and drainage (flood damage), with factors added for urbanization rate and river health. ADB [16] suggests a correlation between national water security and GDP and between national water security and quality of governance as well. The proliferation of water security indicators raises several methodological issues. Dickin and colleagues [60] review the use of index approaches to measure and communicate complex information about water vulnerability. Criticisms of indices include their reductionist nature (simplifying inherently complex information and causal processes) and the choice of components and their weighting (equal weight, stakeholder elicitation, expert judgment, and regression modeling). Methodological rigor and transparency are needed for indices to provide credible, salient, and legitimate information to decision makers [61]. Although integrated, comprehensive indices of water security can be useful for many purposes, they suffer from conceptual and methodological issues [62,63]. Water systems are complex with many interacting parts and causality is often not clear. All indices discussed above have issues with data availability, requiring the research to make assumptions, use expert opinion or use proxy data, e.g. country level data for cities, even though geographical variation may be large. Data quality may also be an issue and needs to be discussed clearly to avoid wrong interpretations. Composite indices usually classify indicators into several categories or tiers, with results displayed at a higher tier. Constructing indices and indicators that combine several dimensions requires subjectively assigning weights (including equal weights) and results in information loss. A dashboard approach, in which all individual variables are displayed together, is a useful approach to remedy this shortcoming, and can provide a more comprehensive picture of water security (Table 1).
Methodology and data sources
Recently, regional development organizations such as the Asian Development Bank (ADB) and the Inter-American Development Bank (IADB) have proposed dashboard approaches to analyze water security at the regional and country levels [16,64]. In the case of ADB, the methodology has undergone several iterations and the dashboard has been issued in 2020, 2016 and 2013 [16] with water security results published at the country level. In the case of IADB, the methodology was developed regionally with diagnosis produced at the country level. In this work, the proposed methodology draws from the dashboard approach using multiple “key dimensions” of water security that align with the source water protection objectives of the Water Funds portfolio. The methodology adapts the ADB and IADB approaches to a spatial scale that corresponds to the operation of Water Funds, commonly a basin or watershed. Following this approach, the dimensions of water security to be pursued in the Water Funds portfolio encompass the following logic: societies can enjoy water security when they successfully manage their water resources and services to (i) satisfy household water supply needs; (ii) support productive economies in agriculture, industry, and energy; (iii) develop vibrant, livable cities and communities; (iv) restore healthy rivers, lakes, aquifers, other water bodies and ecosystems; and (v) build resilient communities that can cope with water-related extreme events.
In view of this, 5 key dimensions are proposed to quantify
water security at the scale of a Water Fund:
1. Water Scarcity Index
2. Household Water Security
3. Economic Water Security
4. Environmental Water Security
5. Water-Related Disaster Security
The Water Scarcity Index (WSI) is a measure of overall water use as a fraction of volume available from the source at any given time. It is a commonly used index that quantifies the ratio of demand to supply and useful to determine rates of availability or depletion of water sources; it provides a basic accounting of water demand and supply that can be tracked over time in a Water Fund. The WSI for a Water Fund can be obtained in a number of ways, depending on data availability. If local operational data exists for water demand towards various uses (e.g., water and sanitation, irrigation, power generation, etc), and/or water supply (e.g., volume of source, rate of natural recharge), then this data can be used to compute the WSI (monthly, annually).
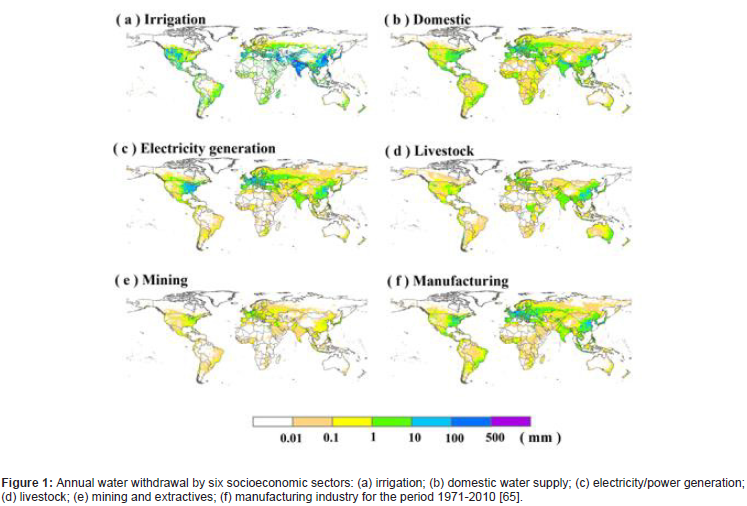
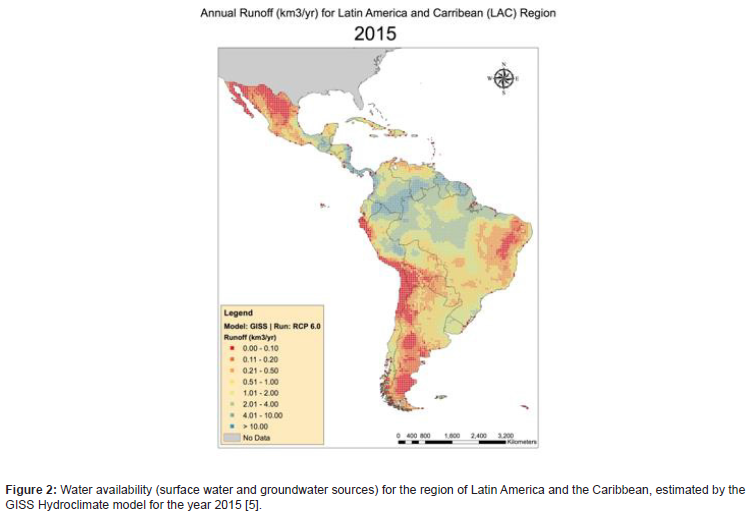
In the absence of local data, hydroclimatic data available globally can be used provide reference values of this indicator. Global water demand estimations are provided in the reference Huang et al. [65], while water supply/availability from surface and groundwater sources can be found from global estimates derived from hydroclimatic models as well. For instance, Figure 1 shows the distribution of global water demand (1971-2010). Figure 2 shows the distribution of water availability/supply in the region of Latin America and the Caribbean (LAC) for 2015 as estimated from global hydroclimate models. These data are publicly available and can be used to calculate the WSI for a give Water Fund location (Figures 1,2).
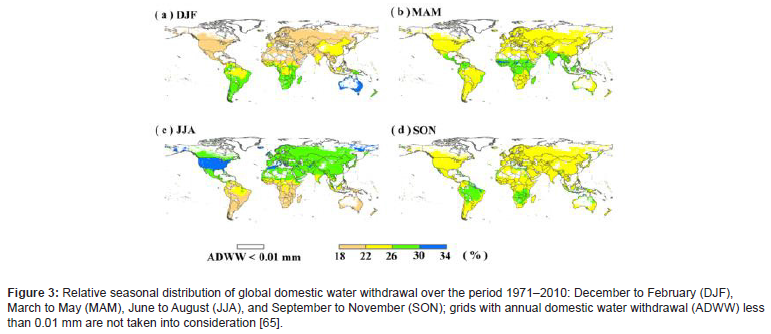
Household Water Security is a metric that tackles the access to sufficient, safe, physically accessible, and affordable water for health and livelihoods in households. This dimension of water security is applicable where water supply to households is a primary objective of the source water protection to be provided by a given Water Fund. In most Water Funds, it is likely that this information exists (for instance, with data provided by municipalities and/or water utilities). Otherwise, it can be estimated (at least as an initial estimate) using global data such as that presented in Figure 3 (Figure 3).
Economic Water Security relates to the secure provision of water for key economic activities, predominantly food production, energy (electricity) and industry/manufacturing. Water is a factor of production needed by every sector of the economy to generate economic growth and development. It must be delivered in the right quantity and quality in the right place at the right time to meet demands for its use in economic production in different sectors. If water cannot be delivered reliably, economic production may be constrained. Ensuring human and environmental health and sustaining reliable water delivery and, therefore, economic production over time, requires water to be set aside for these purposes.
Depending on the Water Fund and its purpose (e.g., protect source water for agriculture, or generate power, among others), data to estimate this water security dimension may exist. If this is not the case, the estimate can be provided by global data sets such as that illustrated in Figure 1 (a, c, e, f). Environmental Water Security focuses on the health of rivers, lakes, wetlands, and groundwater systems and measures the progress in restoring aquatic ecosystems to a healthy state. In Latin America, freshwater systems are an integral part of many landscapes and are inextricably linked to human lives. Healthy waterways provide a range of ecosystem services, including good quality water, basic flood protection via natural wetlands, and food security from agricultural products and from healthy fisheries in both freshwater and coastal systems. However, human alteration of the environment negatively impacts the health of aquatic ecosystems. For example, physical changes to the landscape, removal of riparian vegetation, and depletion of groundwater can lead to downturns in water availability, water quality, and biodiversity, along with a weakened resilience to natural disasters. Consequently, human health and well- being and the economy can be negatively affected. Effective assessment of aquatic ecosystem health is thus vital to understanding the environmental water security in Water Funds. Because of potential complexity of environmental issues across the Water Funds portfolio, it is recommended that initially, environmental water security is assessed via global data bases such as Aqueduct [66] which contains a compilation of peer-reviewed data on risks to water quality due to pollution from point and non-point sources at a global level. This initial assessment can be followed by an estimate of water pollution based on land cover data and potential pollution loadings, for instance to assess phosphorus (TP), nitrogen (TN), and suspended solids (TSS) loadings for a given Water Fund. This can be done using a global landcover dataset (SHARE) and export coefficients in the literature. In a future phase of this work, a Water Fund specific environmental indicator could be developed to reflect the assimilative capacity of streams, the ability of watersheds to capture and infiltrate precipitation, environmental flow deficits and stream/habitat discontinuity.
Water-Related Disaster Security assesses a Water Fund’s exposure risk to water-related disasters, their vulnerability to those disasters, and their capacity to resist and bounce back. This risk can be assessed using the approach in Hofste et al. [66], with risks classified into climatological risk (drought), hydrological risk (flood) and meteorological/weather risk (storm). Data necessary to populate this indicator can be found in global data bases (such as Aqueduct) as well as using results of hydroclimate and weather models that may be available at a given Water Fund location.
Application and Discussion of Results
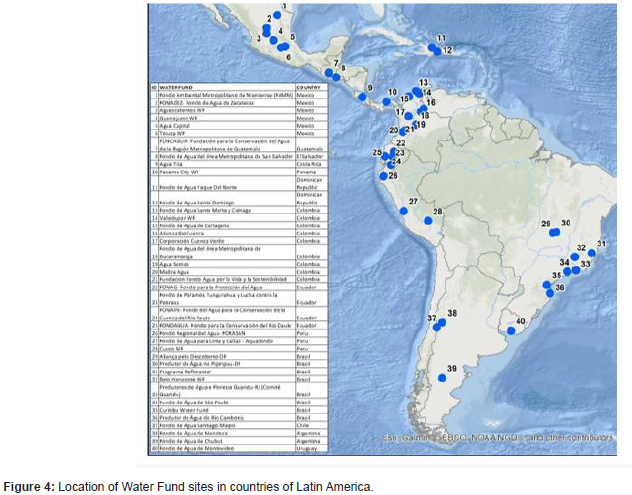
The methodology to quantitatively assess the five water security indicators presented above was applied to a set of Water Fund sites throughout the region of Latin America. Water Funds are organizations that design and enhance financial and governance mechanisms which unite public, private and civil society stakeholders around a common goal to contribute to water security through nature-based solutions and sustainable watershed management. Water Funds constitute an institutional platform developed by cities and conservation practitioners which contribute to resolve governance issues by bridging science, jurisdictional, financial and implementation gaps. Water Funds have worked with communities by bringing water users together to collectively invest in upstream habitat protection land and watershed management and mobilize innovative sources of funding. As a permanent governance, investment and source water protection implementation mechanism, Water Funds provide the framework for collective action, connecting land stewards in rural areas and water users in urban areas to share in the value of healthy watersheds (Figure 4).
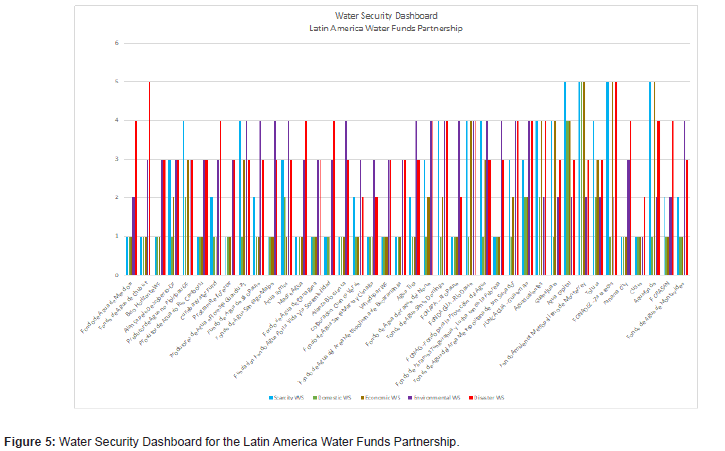
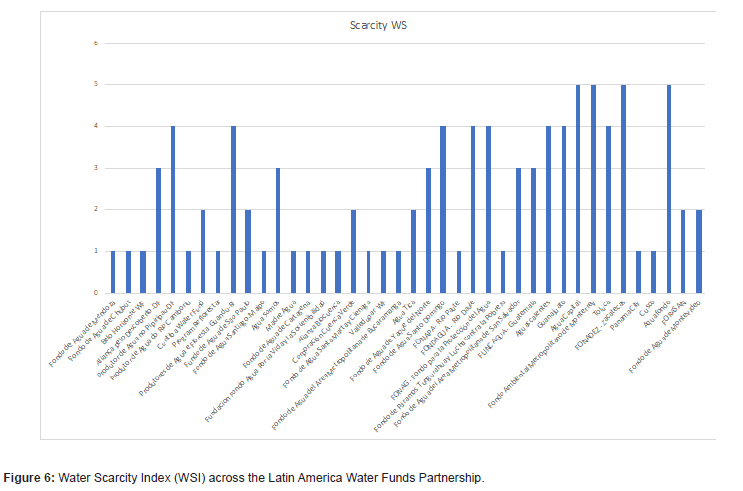
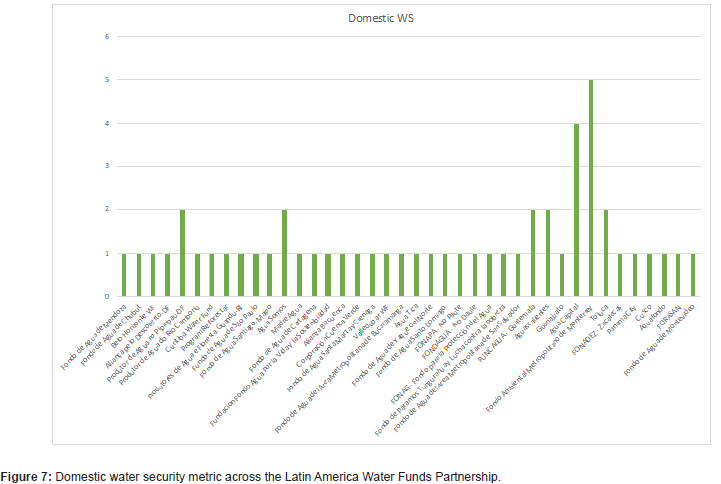
With a portfolio of 40 funds in operation and more in design (Figure 4), there is a need to establish the science case for Water Funds. A set of water security indicators such as that developed in this work will contribute to determine their effectiveness towards, for instance, monitoring and evaluation of Water Fund interventions. This set of water security indicators can serve as a framework to devise and document monitoring and evaluation of Water Fund performance and support their management and operation over time. Figure 5 synthesizes the five water security indicators at once, providing a dashboard approach to display the quantitative information about the full portfolio of Water Fund sites; this type of display can be useful for overall management and comparative analyses, prioritization of interventions and investments within a given Water Fund as well as within the Water Fund portfolio at large. Figure 6 shows the WSI across the portfolio of Water Fund sites. Given that this is a ratio of the water demand as a fraction of the water supply (or availability), it reflects the degree to which water is being exploited at a given site. Ratings for the WSI were assigned using a slightly modified version of the Falkenmark scale [19] with a rating of 1 for low water scarcity (0 < WSI < 0.1); 2 for moderate water scarcity (0.1 < WSI < 0.2), 3 for average water scarcity (0.2 < WSI < 0.4), 4 for high water scarcity (0.4 < WSI < 1), and 5 for severe water scarcity (WSI > 1.0). This scale of course can be modified in this framework and is used here for illustration purposes. For instance, sever water scarcity (high WSI) can be associated with low water availability (e.g., northern Mexico, northeast Brazil, pacific coast of Peru and Chile, southern Argentina) or by high water demand, which is characteristic of highly urbanized areas (e.g., Sao Paolo, Rio de Janeiro, Mexico City); many of the Water Fund sites have targeted these locations to improve water security in urban areas. Given the desktop nature of the data used for the analysis in this work, it would be useful to complement water demand and supply information with local data to ground truth and/or refine these estimates. In addition to this, future projections of the WSI can be made by site-specific studies including modeling for scenario analysis, considering aspects such as climate change, land use change, population and socioeconomic development. The household water security metric shown in Figure 7 is found as the fraction of the domestic water demand (as shown in Figure 1b) to the water availability values in Figure 2. This provides a ratio of domestic water demand to water supply. Because domestic water demand tends to be a small component of overall water demand, this metric is relatively small (value of 1) across most of the portfolio of Water Funds. High values of this metric are found in areas where the WSI is high, e.g., Monterrey, Mexico City; and moderate in other urban areas (e.g., Bogota, Brasilia). It is worth noting that the calculation of this metric does not consider household infrastructure for access to water services, so these results need ground-truthing. This index has been calculated considering only domestic/household demand estimates (based on population, level of service, etc.). Given that domestic water security also has a significant component of infrastructure for access to water services, the data used for this metric should be complemented with local data on household water demand (e.g., from local water utilities). Also, projections for water demand based on population growth and service expansion will be helpful as predictors of the change of this metric over time.
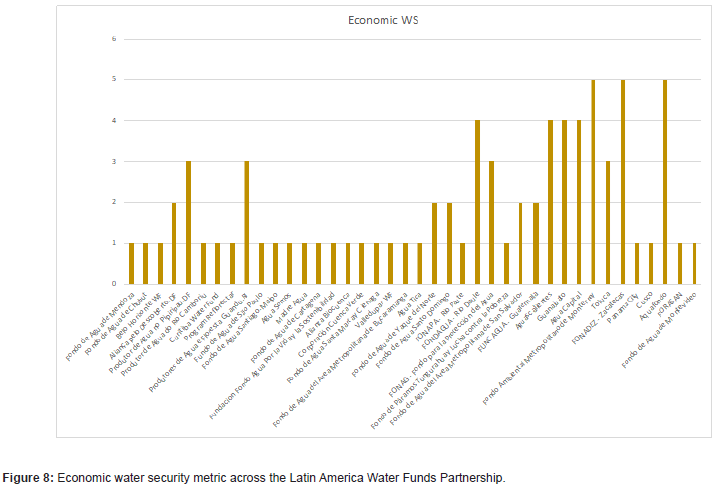
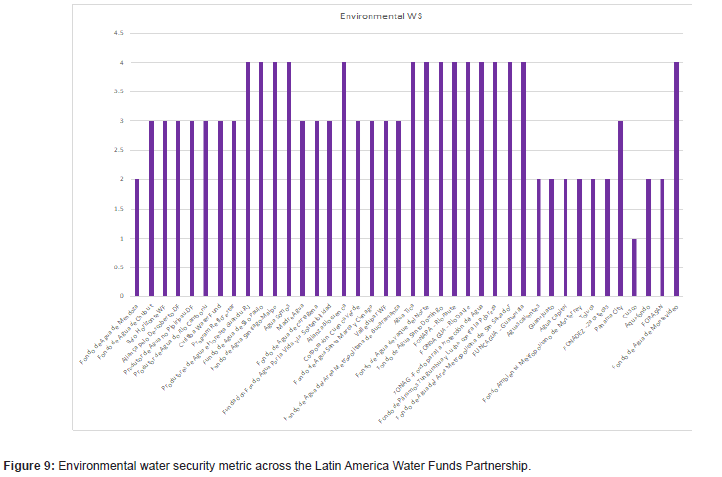
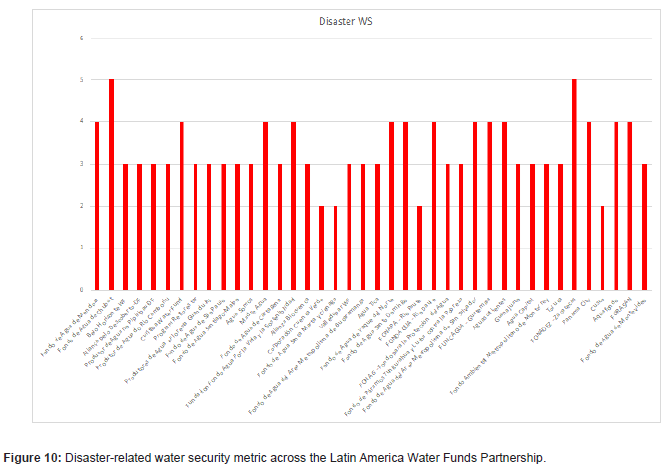
The results for economic water security are shown in Figure 8. This metric is found as the fraction of the water demand for key economic activities (as shown in Figure 1acdef) to the water availability values in Figure 2. This provides a ratio of a combined water demand for these activities to water supply. Since water demand for economic activities tends to be a major component of overall water demand, this metric is highly correlated with the WSI across most of the portfolio of Water Funds. High values of this metric are found in areas where the WSI is high, particularly urban areas across the region for which Water Funds were conceived as a measure for source water protection. As with previous results, given that the calculation of this metric does not consider infrastructure for access to water services, these results need ground-truthing. The environmental water security metric results are presented in Figure 9. These results are driven by a combination of point-source pollution (wastewater discharges) as well as non-point source pollution (diffuse sources such as agricultural runoff). The data and methodology used to compute this metric are detailed in Hofste et al. [66]; they include the percentage of households connected to sewerage systems (percent connected), and the percentage of wastewater connected left untreated (i.e., not treated using primary, secondary, or tertiary treatments) (percent untreated). On the non-point source pollution side, this metric represents where anthropogenic activities produce pollution to potentially degrade the quality of water sources. The aggregation of these water pollution data into a single metric is displayed graphically in the Aqueduct visualization tool (http://aqueduct.wri.org). High overall values of this indicator reflect widespread risk of pollution of water sources and is consistent with the findings reported in global studies such as Damania et al. [67]. Some limitations to this aggregated metric for environmental water security are noteworthy. Important sources of water pollution, such as industrial waste and agricultural runoff, are not included. Wastewater that may be treated on-site, such as with private septic tanks, is also not captured due to a lack of available data. In addition, the severity of water pollution, which depends on the magnitude of loadings of pollutants and dilution capacity of receiving water bodies, is not represented. Pollution of water due to non-point sources in this data focuses primarily in potential impacts to coastal areas (given the location of most large urban areas in the region). This limits the applicability of this metric to inland freshwater areas since a global data set for freshwater pollution potential is not currently available. Therefore, the metric does not reflect the risk to water sources upstream of the coastal zone. Basin-specific water quality modeling driven by locally collected data can help make this metric more realistic. Figure 10 shows the results for the disaster-related water security metric. These results are driven by a variety of factors, such as flood risk, drought risk and variability (extreme climate and weather events), as estimated in Hofste et al. [66]. Because of this aggregation, the metric is high across the Water Funds portfolio. Some disaggregation into specific disaster categories (e.g., floods only or droughts only) may provide some granularity around water security against disasters. The data set provided with this paper provides some guidance as to the type of disaster driving the value of the metric at any given Water Fund site. Some ways to improve the reliability of this metric include validation with recurrence/ return periods of local weather (extreme storms) and climate (extreme drought, chronic flooding) events (Figures 5-10).
Concluding Remarks
Over the past two decades, Water Funds have been implementing projects and developing a wide range of activities towards source water protection, which is perhaps the key pillar of water security. The LAWFP has prioritized contributing to water security as the main objective of Water Funds in the areas in which they operate. However, there is not a set of metrics that Water Funds use to monitor and evaluate their impact on water security. In view of this, the LAWFP embarked on the task of developing a framework to monitor and evaluate impact on water security, while help provide basic elements to guide planning and management of Water Funds. Specifically, this work focused on the development of a water security metrics framework, that creates and applies a set of metrics for water security addressing its multiple dimensions (e.g., environmental, urban, resilience) and the application of the developed framework across the Water Funds portfolio. This initial effort has established a proof-of-concept for a consistent, reproducible method of generating water security indicators at a basin scale, which is typically the scale of operation of Water Funds. The implementation of this group of metrics yields a rich geographic data set for comparisons among Water Fund locations and is able to complement bottom-up approach using local data sets for each location. Focus of this work was placed on the development of the framework, the definition of the metrics, the compilation of data sources used to quantify them, and their implementation across the LAWFP portfolio. Individual Water Fund sites can calibrate these metrics and validate results using local data sets which may have better spatial and temporal resolution. This initial framework and complementary efforts towards its refinement may also be useful for monitoring and evaluation, prioritization of policies, investments and actions, and guiding future Water Fund efforts.
One important aspect that this metrics framework intends to capture is the multi-sectoral nature of water security. The five metrics proposed in this work cover water scarcity (balance between physical supply and total demand), household water security (domestic demand met), economic water security (sectoral demand met), environmental water security (water quality) and water security toward disaster risk reduction. Other challenges to water security in the region that are long-standing can be incorporated into this framework in future iterations. Such metrics could include the provision of infrastructure and sanitation services, institutional/governance capacity, ecosystem services, among others [68]. Given the complex interaction between sectors, it is imperative to move from traditional sectoral management approaches, in which decision-making and investment planning are carried out as if the sectors (water and sanitation, agriculture, energy, others) independent of each other, and transition to an integrated approach to planning the development of water resources and their use. Apart from promoting economic and resource efficiency, this integrated planning framework is important to avoid unintended consequences and potential water security conflicts in the coming decades in the Latin America region. This initial water security metrics framework represents an important practical development in this direction.
References
- UN-Water, 2013, Analytical Brief on Water Security and the Global Water Agenda.
- Bazilian M, Rogner H, Howells M, Hermann S, Arent D, et al. (2011) Considering the energy, water and food nexus: towards an integrated modelling approach. Energy Policy 39(12): 7896-7906.
- Miralles-Wilhelm F (2016) Development and application of integrative modeling tools in support of food-energy-water nexus planning-a research agenda. J Environ Stud Sci 6(1): 3-10.
- Perrone D, G Hornberger (2014) Water, food, and energy security: scrambling for resources or solutions?. WIREs Water 1(1): 49-68.
- Miralles-Wilhelm F, Munoz-Castillo R (2018) An analysis of the Water-Energy-Food Nexus in Latin America and the Caribbean Region: Identifying synergies and tradeoffs through Integrated Assessment Modeling. The International Journal of Engineering and Science 7(1): 8-24.
- Grimm AM, Saboia, JP (2015) Interdecadal Variability of the South American Precipitation in the Monsoon Season. Journal of Climate 28(2): 755-775.
- Grimm AM, Zilli MT (2009) Interannual Variability and Seasonal Evolution of Summer Monsoon Rainfall in South America. Journal of Climate 22(9): 2257-2275.
- Mo KC, Schemm JE (2008) Droughts and Persistent Wet Spells over the United States and Mexico. Journal of Climate 21(5): 980-994.
- Schewe J, Heinke J, Gerten D, Haddeland I, Arnell NW, et al (2014) Multimodel assessment of wáter scarcity under climate change. Proc Natl Acad Sci USA 111(9): 3245-3250.
- Gleick PH (1993) Water and conflict: freshwater resources and international security. Int Secur 18(1): 79-112.
- Brown A, Matlock MD (2011) A review of wáter scarcity índices and methodologies. White Pap 106, Sustain Consort Univ Ark, Fayetteville.
- Plummer R, de Loë R, Armitage D (2012) A systematic review of water vulnerability assessment tools. Water Resour Manag 26: 4327-4346.
- OECD (2009) Governing Regional Development Policy: The Use of Performance Indicators. OECD Publishers, Paris.
- Hall J, Borgomeo E (2013) Risk-based principles for defining and managing water security. Phil Trans R Soc A 371: 20120407.
- Pahl-Wostl C, Palmer M, Richards K (2013) Enhancing water security for the benefits of humans and nature-the role of governance. Curr Opin Environ Sustain 5(6): 676-684.
- ADB-Asian Dev Bank (2020) Asian Water Development Outlook 2020: Measuring Water Security in Asia and the Pacific. Mandaluyong City, Philipp.
- Lautze J, Manthrithilake H (2012) Water security: old concepts, new package, what value? Nat Resour Forum 36(2): 76-87.
- Falkenmark M (1989) The massive water scarcity now threatening Africa: Why isn’t it being addressed? Ambio 18: 112-118.
- Falkenmark M, Lundqvist J, Widstrand C (1989) Macro-scale water scarcity requires micro-scale approaches. Aspects of vulnerability in semi-arid development. Nat Resour Forum 13(4): 258-267.
- Bradley DJ, Bartram JK (2013) Domestic water and sanitation as water security: monitoring, concepts and strategy. Philos Trans A Math Phys Eng Sci 371(2002): 20120420.
- Gleick PH (1996) Basic water requirements for human activities: meeting basic needs. Water Int 21: 83-92.
- Allan JA (2010) Prioritizing the processes beyond the water sector that will secure water for society- farmers, fair international trade and food consumption and waste. In: Martinez-Cortina L, Garrido A, Lopez-Gunn E, Leyden N (Eds.) Re-Thinking Water and Food Security, CRC Press, pp. 93-106.
- Brown C, Lall U (2006) Water and economic development: the role of variability and a framework for resilience. Nat Resour Forum 30(4): 306-317.
- Howard G, Bartram J (2003) Domestic Water Quantity, Service Level and Health. Geneva: WHO Press.
- Hope R, Rouse M (2013) Risks and responses to universal drinking water security. Philos Trans R Soc A 371: 20120417.
- WHO, UNICEF (2014) Progress on Drinking Water and Sanitation: 2014 Update. WHO Press, Geneva/New York.
- Easterly W (2009) How the millennium development goals are unfair to Africa. World Dev 37(1): 26-35.
- Falkenmark M (2013) Growing water scarcity in agriculture: future challenge to global water security. Philos Trans A Math Phys Eng Sci 371(2002): 20120410.
- Rosegrant MW, Ringler C, Zhu T (2009) Water for agriculture: maintaining food security under growing scarcity. Annu Rev Environ Resour 34: 205-222.
- Millenn Ecosyst Assess (2005) Ecosystems and Human Well-Being: Wetlands and Water. World Resour Inst, Washington, DC.
- Vorosmarty CJ, McIntyre PB, Gessner MO, Dudgeon D, Prusevich A, et al. (2010) Global threats to human water security and river biodiversity. Nature 468(7321): 334.
- Srinivasan V, Lambin EF, Gorelick SM, Thompson BH, Rozelle S (2012) The nature and causes of the global water crisis: syndromes from a meta-analysis of coupled human-water studies. Water Resour Res 48(10).
- Zeitoun M (2011) The global web of national water security. Global Policy 2(3): 286-296.
- Vörösmarty CJ, Green P, Salisbury J, Lammers RB (2000) Global water resources: vulnerability from climate change and population growth. Science 289(5477): 284-288.
- Seckler D, Amarasinghe U, Molden D, de Silva R, Barker R (1998) World water demand and supply, 1990 to 2025: scenarios and issues. Res Rep 19, Int Water Manag Inst, Colombo, Sri Lanka.
- Vorosmarty CJ, Bravo de Guenni L, Wollheim WM, Pellerin B, Bjerklie D, et al. (2013) Extreme rainfall, vulnerability and risk: a continental-scale assessment for South America. Philos Trans R Soc A 371(2002): 20120408.
- Gassert F, Reig P, Luo T, Maddocks A (2013) Aqueduct country and river basin rankings: a weighted aggregation of spatially distinct hydrological indicators. Work Pap, World Resour Inst, Washington DC, USA.
- United Nations (2000) Ministerial Declaration of The Hague on Water Security in the 21st The Hague, Netherlands.
- Hallegatte S, Green C, Nicholls RJ, Corfee Morlot J (2013) Future flood losses in major coastal cities. Nature Climate Change 3: 802-806.
- Hanasaki N, Kanae S, Oki T, Masuda K, Motoya K, et al. (2008) An integrated model for the assessment of global water resources. Part 1: model description and input meteorological forcing. Hydrol Earth Syst Sci 12: 1007-1025.
- World Bank (2010) The Cost to Developing Countries of Adapting to Climate Change. World Bank, Washington, DC.
- Mullan M, Kingsmill N, Kramer AM, Agrawala S (2013) National adaptation planning: lessons from OECD countries. OECD Environ Work Pap 54, Organ Econ Coop Dev, Paris.
- OECD (2011) Meeting the Water Reform Challenge. OECD Publishers, Paris.
- Araral E, Yu DJ (2013) Comparative water law, policies, and administration in Asia: evidence from 17 countries. Water Resources Research 49: 5307-5316.
- Saleth RM, Dinar A (2004) The Institutional Economics of Water: A Cross-Country Analysis of Institutions and Performance. Cheltenham, UK/Northampton, MA.
- Wolf AT (2007) Shared waters: conflict and cooperation. Annu Rev Environ Resour 32: 241-269.
- Wolf AT, Yoffe SB, Giordano M (2003) International waters: identifying basins at risk. Water Policy 5(1): 29-60.
- Schulze S, Schmeier S (2012) Governing environmental change in international river basins: the role of river basin organizations. Int J River Basin Manag 10(3): 229-244.
- Schmeier S (2013) Governing International Watercourses. The Contribution of River Basin Organizations to the Effective Governance of Internationally Shared Rivers and Lakes. Routledge, London.
- DeStefano L, Duncan J, Dinar S, Stahl K, Strzepek KM, et al. (2012) Climate change and the institutional resilience of international river basins. J Peace Res 49: 193-209.
- Briscoe J (2011) Making reform happen in water policy: reflections from a practitioner. Presented at OECD Glob Forum Environ Mak Water Reform Happen, Paris, pp. 25-26.
- Sachs JD (2003a) Institutions don’t rule direct effects of geography on per capita income. NBER Work. Pap. 9490, Natl Bur Econ Res, Cambridge, MA.
- Sachs JD (2003b) Institutions matter, but not for everything. Finance Dev 40: 38-41.
- Rodrik D, Subramanian A, Trebbi F (2004) Institutions rule: the primacy of institutions over geography and integration in economic development. J Econ Growth 9: 131-165.
- Brown C, Meeks R, Hunu K, Yu W (2011) Hydroclimate risk to economic growth in sub-Saharan Africa. Clim. Change 106(4): 621-647.
- Brown C, Meeks R, Ghile Y, Hunu K (2013) Is water security necessary? An empirical analysis of the effects of climate hazards on national-level economic growth. Philos Trans R Soc A 371(2002): 20120416.
- Siemens (2012) The Green City Index (Munich: Siemens AG).
- Arup (2014) City Resilience Index: Understanding and Measuring City Resilience (London: Arup).
- SDEWES Centre (2017) SDEWES Index, The International Centre for Sustainable Development of Energy, Water and Environment Systems (Zagreb: International Centre for Sustainable Development of Energy, Water and Environment Systems).
- Dickin SK, Schuster-Wallace CJ, Elliott SJ (2013) Developing a vulnerability mapping methodology: applying the water-associated disease index to dengue in Malaysia. PLos One 8: e63584.
- Cash DW, Clark WC, Alcock F, Dickson NM, Eckley N, et al. (2003) Knowledge systems for sustainable development. Proc Natl Acad Sci USA 100(14): 8086-8091.
- Garrick D, Hall J (2014) Annu Rev Environ Resour 39: 611-639.
- Molle F, Mollinga P (2003) Water poverty indicators: conceptual problems and policy issues. Water Policy 5(5): 529-544.
- IADB (2020) Agua para el futuro: estrategia de seguridad hídrica para América Latina y el Caribe / Fernando Bretas, Guillermo Casanova, Thomas Crisman, Antonio Embid, Liber Martin, Fernando Miralles, Raúl Muñ
- Huang (2018) Hydrol Earth Syst Sci, 22: 2117-2133.
- Hofste R, Kuzma S, S Walker, EH Sutanudjaja (2019) Aqueduct 3.0: Updated Decision- Relevant Global Water Risk Indicators. World Resources Institute, Washington DC, USA.
- Damania Richard, Sébastien Desbureaux, Aude-Sophie Rodella, Jason Russ, Esha Zaveri, et al. (2019) Quality Unknown: The Invisible Water Crisis. Washington, DC: World Bank.
- Maíra Ometto Bezerra, Derek Vollmer, Natalia Acero, Maria Clara Marques, Diego Restrepo, et al. (2021) Operationalizing Integrated Water Resource Management in Latin America: Insights from Application of the Freshwater Health Index. Environmental Management 69: 815-834.
- Da Silva, Silvia H McJeon, F Miralles-Wilhelm R, Muñoz-Castillo L, Clarke A, et al. (2018) Energy-Water-Land Nexus in Latin America and the Caribbean. IDB Working Paper Series No IDB-WP-901.
- DeStefano L, Duncan J, Dinar S, Stahl K, Strzepek K, et al. (2010) Mapping the resilience of international river basins to future climate change-induced water variability. Water Sector Board discussion paper series; no.15. World Bank, Washington DC, USA.
- IADB (2020) Agua para el futuro: estrategia de seguridad hídrica para América Latina y el Caribe / Fernando Bretas, Guillermo Casanova, Thomas Crisman, Antonio Embid, Liber Martin, Fernando Miralles, Raúl Muñ
-
Fernando Miralles-Wilhelm*, Rocío Sanchez-Maldonado and Raúl Muñoz-Castillo. Assessing Water Security Through a Set of Consistent Metrics and Application to Water Funds in Latin America. Cur Trends Civil & Struct Eng. 9(1): 2022. CTCSE. MS.ID.000704.
-
Building, Environment, Curtainwall, Earthquake, Structural engineer, Geometric
-

This work is licensed under a Creative Commons Attribution-NonCommercial 4.0 International License.


