


 Research Article
A Methodology to Measure Pedestrian Crash Rates against Statewide Averages for Roadways and Intersections in Central Florida
Received Date:May 01, 2024; Published Date:May 21, 2024
Abstract
To date there are no clear or uniform standards for a method to measure pedestrian crash rates and compare it against a statewide average. In this paper, a novel methodology to measure pedestrian crash rates along roadways and intersections is presented. The main objective is to identify critical pedestrian crash locations that are operating above its corresponding statewide average. It was crucial to address the pedestrian-vehicular conflict as the State of Florida currently tops the list in the “Dangerous by Design” report as having the highest four pedestrian incident locations in the Country. The main challenge was to identify a practical and accurate exposure measure. In most cases, the exposure measure is either a surrogate or impractical. The proposed approach focuses on the potential conflict between pedestrians and motor vehicles expressed in the amount of walking while at risk of being involved in a vehicle crash. The main parameters used in calculating pedestrian crash rates along roadways and intersections included roadway, pedestrian volume and crash data. The pilot studies conducted for the roadways and intersections revealed several critical safety locations within District 5 when compared to the developed statewide average rates which required further investigation to identify main causes and emphasize mitigation improvements. It is recommended that an annual statewide pedestrian count program be initiated for the intersections as well as roadways which would increase the sample size and help in validating the assumptions provided in this study.
Keywords:Pedestrian Safety; Pedestrian Crash Rates; Statewide Crash Rate Averages; Pedestrian-Vehicle Conflict; Exposure Measures
Introduction
Pedestrian safety has become more predominant for governmental agencies to address and prioritize. With the transition to the mobility of people, to date there are no clear or uniform standards for a method to measure pedestrian incidents against a statewide average. However, the Florida Department of Transportation (FDOT) has developed vehicular crash rates that resulted in hypothesis that geometric and traffic characteristics influence vehicle incidents and corresponding crash rates. Therefore, research is needed to evaluate / identify crash rates for pedestrians that would result in the ability to identify locations within regions for higher than or above a statewide average on pedestrian crash rates.
Between 2006 and 2009, pedestrian fatalities in the United States declined from 4795 to 4109. However, the downward trend had halted and there were 4302 pedestrian deaths in 2010, increasing to 4457 in 2011 and 4743 in 2012 [1]. Recently, the 7,388 pedestrian fatalities in 2021 represented approximately 13-percent increase from 6,565 pedestrian fatalities in 2020 [2]. Although pedestrian deaths were two percent lower in 2021 than in 1975, they have increased 80 percent since reaching their lowest point in 2009. It is the highest since 1981, when 7,837 pedestrians died in traffic crashes. The state of Florida has consistently ranked as one of the worst states in terms of pedestrian crashes, injuries and fatalities according to the National Highway Traffic Safety data [2]. Ernst (2021) also indicated that four metro areas in Florida (Orlando- Kissimmee, Tampa-St. Petersburg-Clearwater, Jacksonville, Miami-Fort Lauderdale-Pompano) were considered the most dangerous for pedestrians among all the United States [3]. Therefore, pedestrian safety is of particular concern to Florida. Several studies used several methods and surrogate measures to estimate pedestrian crashes. In general, population, pedestrian volumes, time and distance are examples of the most studied surrogate measures for pedestrian exposure. The methods used in estimating pedestrian hot spot crash locations included density methods, clustering methods and other GIS-related methods. However, the main challenge in analyzing pedestrian crashes is to identify a practical and correct exposure measure as in the case with vehicular crashes. In most cases, the exposure measure is either unavailable, unpractical or can be obtained at a great cost. In this paper, statewide averages for pedestrian crash rates were quantified to identify critical pedestrian crash locations, thus evaluating locations that are operating beyond statewide averages and therefore emphasizing mitigation improvements.
Literature Review
There have been numerous studies that were devoted to investigating and evaluating pedestrian safety at the national level as well as Statewide and local levels. Several studies also attempted to identify significant factors related to pedestrian crashes. The main factors discussed in this section include environmental factors, roadway characteristics factors, human factors, and vehicle characteristics factors.
Ernst et al. (2021) in the “dangerous by design” national report conducted for the Transportation for America examined the pedestrian fatalities for each state from 2011 to 2021 to identify the common thread on the roads. Using ten years of pedestrian fatality data, they used a Pedestrian Danger Index (PDI) to rank the country’s largest metropolitan areas according to their relative risk to walkers. The analysis concluded that Orlando tops the list of most dangerous places due to its high pedestrian fatality rate of 3 per 100,000 people, followed by Tampa, Jacksonville and Miami areas [3]. Chang (2008) utilized the Fatality Analysis Reporting System (FARS) to analyze the trends in pedestrian fatalities and identify the probability of different contributing factors [4]. He found that 26% of pedestrian crashes occurred from 3 p.m. to 6 p.m. in Chicago, which was the period with most occurrences. However, NHTSA found that 24.7% percent of pedestrian deaths were between 6 p.m. and 9 p.m. which was the highest number of pedestrian deaths during the whole day. Weather and lighting condition factors were also of common concern. Clifton (2009) and Mohamed et al. (2013) showed that poor lighting conditions lead to increase the likelihood of pedestrian injuries [5,6]. However, weather was not a significant factor in Dai (2012) findings [7]. Ukkusuri et al. showed that a greater fraction of residential land use decreased pedestrian crashes compared to the industrial, commercial and open land use types in New York City [8]. They also found that more pedestrian crashes were associated with larger road width. Other similar studies concluded that low density residential areas were more dangerous than compact areas [9,10].
Lee and Abdel-Aty (2005) used four years of vehicle-pedestrian crashes data from 1999 to 2002 in Florida to identify roadway characteristics that were correlated with high pedestrian crashes using a log-linear model [11]. They found that undivided roads with a greater number of lanes were more dangerous than divided roads with fewer lanes. Hanson (2013) also studied roadway characteristics which included the presence of sidewalks, buffers between the road and the sidewalk, number of travel lanes and presence of medians, traffic control at intersections, and posted speed limits with a database of pedestrian casualties [12]. The results showed that lack of buffers between the road and the sidewalk and higher speed limits were found to be associated with higher pedestrian severe causalities and fatality rates. Chidester and Isenberg (2001) developed the Pedestrian Crash Data Study (PCDS) in 1994. The data were collected through on-scene crash investigations (or within 24 hours) of pedestrian crashes using two techniques, video camera recording and contour gauge, to collect 521 pedestrian crashes at six sites which were selected from around the nation [13]. The study concluded that 68% of the involved vehicles were passenger cars and 32% were other light vehicles, including light trucks, vans, and utility vehicles.
Brustman (1999) utilized two main databases to analyze pedestrian and bicyclist crash rates [14]. One was “Hospitalizations Due to Bicyclist and Pedestrian Injuries” from the Department of Health (DOH), which was more reflective of the actual injury situation. The other was “Summary of Bicycle and Pedestrian Crashes on State Highways” from the Department of Transportation (DOT), which looked for clusters of crashes on state highway routes. They found that municipal streets had a higher probability of crashes involving a pedestrian compared to state roads, county roads, town roads and limited access highways. Thomas et al. (2009) used five years of state crash data and the perception data from 400 intercept survey respondents to identify the general trends in characteristics of people and the high-risk locations in North Carolina [15]. They used kernel density analysis method through GIS to identify high risk locations and exploited Ripley’s K-function test to decide whether crashes were clustered randomly. An age-specific study of death rates due to pedestrian-car crashes in the city of Montreal was conducted in which the inner city was compared to the outer parts of the cities in four contiguous areas. They found that the rates are highest in downtown and decrease progressively in the outlying areas [16]. Dumbaugh et al. (2012) mainly focused on the relationship between the built environment and pedestrian crashes in Texas [17]. Negative binomial regression models were fitted to the data and it was concluded that the environmental factors associated with a vehicle-pedestrian crash were a combination of traffic conflicts and the vehicle speed. Dewey et al. (2003) p o i n t e d out why pedestrian fatality rates in Florida were higher than other states [18]. A multivariate regression model was used to analyze specific factors that could relate to the pedestrian fatality, including environmental factors and crash locations. They found that Florida residents walk more often in places that are exposed to traffic compared to other U.S. residents because of warm winters and the natural timing of summer and winter sunlight. Besides, there were millions of tourists visiting Florida every year, which led to more exposure to traffic. In another FDOT pedestrian safety study, Alluri et al. (2013) analyzed 6434 pedestrian crashes on roads during 2008-2010 in Florida [19]. A mixed logit model was developed to identify factors contributing to pedestrian injury severity at signalized and non-signalized locations. Several countermeasures at both non-signalized and signalized locations were suggested to reduce pedestrian crash frequency and severity. Abou-Senna et al. (2016-2022) investigated reasons attributing to pedestrian crashes in Central Florida using categorical principal component analysis (CATPCA) and identified several parameters including sidewalk gaps that ends abruptly along roadway segments [20-24].
Based on the literature review and previous studies, it can be
seen that majority of the exposure measures used are either in an
aggregate form and not accurate enough to represent a clear picture
of the safety situation, or not practical enough to collect the
data needed or do not indicate an overall level of the transportation
activity. Very few studies in previous research that incorporated
the product of P × V (pedestrian and vehicular traffic) as a measure
of exposure. Others included the pedestrian miles travelled.
The proposed approach focuses on the level of pedestrian activity
and the potential conflict between pedestrians and motor vehicles
expressed in the amount of walking while at risk of being involved
in a motor vehicle crash. Majority of the pedestrian-vehicle crashes
occur while crossing the street whereas insignificant percentage
of crashes occur while walking along the street. Therefore, it is believed
that the pedestrian miles crossed (PMC) parameter is more
representative of the risks associated with pedestrian exposure.
Furthermore, since the exposure measure should directly reflect
the amount of walking in areas shared with vehicles, the vehicular
traffic volume is another significant factor that should be included
in the equation. Based on that, the three (3) main significant
parameters that were used in the exposure measure calculations in
this paper are:
a. Pedestrian traffic
b. Distance crossed
c. Vehicular traffic
The proposed methodology in this paper is considered detailed, practical and provide a broad depiction of the main factors that directly contribute to pedestrian crashes.
Methodology
The methodology was designed to arrive at the statewide averages for pedestrian crash rates involving two types of analyses: roadways and intersections. Statewide roadway characteristic inventory (RCI) data was collected from the GIS layers and classified according to their functional classification, area type and number of lanes as well as their annual average daily traffic (AADT) and total lengths. Intersection data was classified according to several parameters including their total entering traffic, total crossing distance, total daily pedestrians and type of control. Furthermore, the total statewide number of crashes over the 5-year period (June 2016 to May 2021) was identified for all the roadways and intersections. In addition to the intersection GIS data, sample intersection data was collected based on a pilot study within the nine [9] counties of FDOT District Five. The purpose of the pilot study is to identify the critical pedestrian safety locations within the district and correlate this against safety locations based on statewide averages. The methodology is summarized into the following steps:
A. Roadways:
i. Identify statewide roadway categories and characteristics
ii. Assemble statewide pedestrian crashes along roadways
iii. Develop statewide average pedestrian crash rates along roadways
iv. Determine critical segment locations within District 5
B. Intersections:
i. Identify statewide intersections and characteristics
ii. Identify pedestrian crashes at signalized intersections
iii. Pilot study for District 5 intersections
iv. Estimation of intersection pedestrian volume
v. Intersection classification
vi. Establish statewide average pedestrian crash rates at intersections
vii. Determine critical hotspot locations within District 5
Pedestrian Crash Rates for Roadways Identify Statewide Roadway Categories and Characteristics
FDOT roadway GIS layers were spatially joined to categorize the roadways according to their functional classification, area type, AADT, number of lanes and total lengths. Functional classification layer included 7 different roadway classes; Principal Arterial- Interstate, Principal Arterial-Expressway, Principal Arterial- Other, Minor Arterial Major Collector, Minor Collector and Local roads Area type included 2 types (urban and rural). The number of lanes layer included 12 categories and was further split based on the roadway side value for divided and undivided roadways. A total of 135 different categories resulted from these combinations (83 for divided and 52 for undivided). The last 5-year AADT data (2016- 2021) was then overlaid on top of the roadway categories and the average AADT values were calculated for each roadway type. The total length for each roadway category was also calculated. The total length of the undivided roadways was about 29,400 miles while the divided roadways length was about 15,400 miles.
Assemble Statewide Pedestrian Crashes along Roadways
The GIS layer from Signal Four Analytics database for the most recent 5-year period (June 2016-May 2021) was utilized to identify statewide pedestrian crashes along the roadways [25]. The statewide data showed a total of 35,287 pedestrian related crashes. The crash layer was spatially joined with the roadways layer and a 15 feet buffer was used to identify the crashes that occurred specifically on the roadway segments. A total of 14,451 pedestrian related crashes were located along roadways involving the state highway system. There were 9,552 pedestrian crashes on the divided roadways while 4,899 crashes on the undivided roadways.
Develop Statewide Average Pedestrian Crash Rates along Roadways
The exposure measure used to calculate pedestrian crash rates along the roadways included the total length in miles, total number of crashes and the AADT for each roadway category over the 5-year study period. The average number of daily pedestrians for each roadway category is not applicable in this case due to the fact that pedestrians are less confined to paths of travel than motor vehicles and they often travel in closely spaced groups in specific areas. There will be numerous locations along the roadway with no pedestrians or no designated crossings except at intersections or midblocks which are addressed in the intersections’ section. Therefore, it is difficult to define an average number of pedestrians that are always using a 2-lane urban major arterial or 4-lane rural minor collector and generalize it statewide for the entire roadway type. Reliable data is necessary for measuring trends in facility use and for putting crash data into context. Accordingly, the equation used in calculating average pedestrian crash rates along roadways is: 4
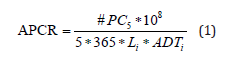
Where:
APCR=Average Pedestrian Crash Rate per 100 million vehicle
miles.
#PC5=Number of Pedestrian Crashes over 5-year period
Li=total length of the roadway category
ADTi=Average daily traffic for the roadway category
Using the above formula, statewide averages for pedestrian crash rates along roadways were established. Tables 1a & 1b summarize all the divided and undivided roadway data respectively, exposure measure and average crash rate for each category. It should be noted that few roadway categories had total lengths of less than one mile and others exhibited zero pedestrian crashes. Therefore, these categories were eliminated from the database. The analysis resulted in a total of 70 different roadway categories with 70 different statewide average rates. The divided roadways had 45 categories while the undivided roadways had 25 categories.
Table 1a:Statewide Average Pedestrian Crash Rates for Divided Roadways.

Table 1b:Statewide Average Pedestrian Crash Rates for Undivided Roadways.

Area Type Adjustment Factor (ATAF)
From the analysis, it was found that the statewide average rates for rural roads exhibited very low values especially when compared with the urban rates. This could be attributed to the effect of averaging over the entire state and also due to the fact that rural roadway categories have very different characteristics compared to urban roadways. They were less than the urban categories but have longer lengths since they connect between urban areas and usually have less AADT volumes than urban roads and with extremely low number of pedestrian crashes. In order to account for the pedestrians at risk on rural roads, an Area Type Adjustment Factor (ATAF) was considered in the exposure measure for the rural areas. The analysis showed that out of the 21,434 miles of rural roads only 431 pedestrian crashes were recorded over the 5-year period. On the other hand, there were 12,233 pedestrian crashes recorded on the 23,145 miles of urban roads. Therefore, an ATAF of 0.04 was calculated by dividing the rural crashes per mile over the urban ones, to adjust for the pedestrians at risk in rural areas when compared to urban areas. Accordingly, the statewide average rates were revised to include the ATAF for rural roads as shown on Tables 1a & 1b. Other criteria were also required to disqualify segments with extremely low number of pedestrian crashes over the 5-year period. Therefore, the analysis was revised to include a minimum threshold of 5 crashes over the 5-year period to be considered in the analysis and compared to the statewide averages. Hence, the revised equation used to calculate average pedestrian crash rates along the roadways is:
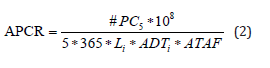
Where ATAF is (1) for urban roads and (0.04) for rural roads.
Determine Critical Segment Locations within District 5
A random sample of 10 segments located within FDOT district 5 jurisdiction were selected to identify critical safety concerns along these facilities and whether they are considered high crash locations. This should be determined by comparing the actual pedestrian crash rates to the developed statewide averages. As shown in Table 2, the sample included different roadway types and categories from Central Florida Counties (Orange, Osceola, Seminole and Lake Counties). Roadway segment data included the length measured from aerial maps as well as the average daily traffic over the 5-year period between 2016 and 2020 based on the latest FDOT traffic data. The 5-year pedestrian crash data was obtained from Signal 4 Analytics database from June 2016 till May 2021. The results showed that majority of the urban roadway segments within District 5 sample have the actual pedestrian crash rates greater than their corresponding statewide averages which qualifies them to be considered hazardous segments. It should be noted also that, although the number of crashes on some roadway segments seemed low, they exceeded the statewide average rate based on their exposure measure which takes into consideration traffic volume and length of the roadway segment. Since the length of the roadway segment plays a major role in the exposure measure, it is recommended to consider the maximum length of the studied segment that corresponds to the number of crashes. For example, if the studied roadway segment is two miles and has four crashes, then the analyst should consider the maximum length of this roadway segment that contains those four crashes by extending the segment from both sides just before the next crash, excluding the crashes at the intersections within 250 feet radius.
Table 2:Actual Crash Rates versus Statewide Averages for Roadway Pilot Study.

Pedestrian Crash Rate for Intersections Identify Statewide Intersections and Characteristics
Several FDOT intersection GIS layers were utilized in order to gather all the relevant information associated with each intersection. The intersection layer included all types of intersections such as signalized and unsignalized. Furthermore, the GIS Traffic Signal Locations feature class layer provided spatial information on locations of traffic signals in the RCI database. The signal locations layers included 5 types of signalized intersections as follows: Flashing Beacon, Standard Traffic Signal, Mid-block Pedestrian Control, Emergency Signal and School Signal.
Identify Pedestrian Crashes at Signalized Intersections
To identify statewide pedestrian crashes that are related to signalized intersections, a 250 feet buffer radius was created around each of the signalized intersections. The GIS layer for Pedestrian crashes was spatially intersected with the 250’ buffer to isolate pedestrian crashes located at signalized intersections (within 250 feet) from those located along the roadway segments. Data associated with the resulting pedestrian crashes at signalized intersection was then extracted and exported to a spreadsheet. Due to the overlapped traffic signal buffers at adjacent signalized intersections that are spaced less than 500 feet apart, some crashes associated with more than one signalized intersection were duplicated. Therefore, those duplicated crashes were eliminated from the analysis. A total of 6,684 statewide pedestrian crashes were located within the signalized intersections area of influence. Out of the 10,500 signalized intersections in the State of Florida, 3,492 signalized intersections experienced one or more pedestrian crash during the five-year study period. Crashes ranged from 1 to 20 crashes per intersection.
Pilot Study for District 5 Intersections
A pilot study was necessary to collect intersection specific data. FDOT District 5 was selected for this purpose out of the 6 districts in Florida due to its relatively high number of crashes compared to other districts. A sample of 52 intersections located within FDOT district 5 jurisdiction were selected to represent sufficient parameter variations to be utilized in the statewide analysis. The process for selecting these intersections is explained in the following sections.
a. Selection criteria
The FDOT GIS intersections layer within District 5 and the pedestrian crash layer were spatially joined. Based on the dataset, a total of 2,166 crashes were located within 250 feet diameter surrounding the intersections for the 5-year period between June 1st, 2016, and May 31st, 2021. The intersections were further divided into 2 categories (urban intersections and rural intersections). There were 1,760 crashes within the vicinity of urban intersections and 406 crashes within the vicinity of rural intersections. It was found that more than 85% of the rural intersections have only one crash while 90% of the urban intersections have crashes ranging from 1 to 5.
b. Sample Size
A reasonable statistical sample size should include more than 30 intersections; therefore 52 intersections were randomly selected using the random number generator. About third of the intersections were selected to be in rural areas (15 intersections). The remaining intersections were in urban areas (37 intersections).

c. Sample Refinement
Since the sample size was randomly selected, therefore visual inspection of the selected intersections was necessary to ensure proper locations and correct number of crashes within the vicinity of the intersection. The visual inspection utilized the Signal 4 Analytics crash database [20]. The selected sample was further refined to include major intersections at appropriate locations with reasonable number of crashes that would trigger a reasonable amount of pedestrian activity. The intersections were then plotted on District 5 map to ensure an appropriate distribution. The selected intersections were distributed over 7 Counties out of the 9 Counties within District 5 as shown on Figure 1.
d. Data Collection
The 52 intersections were videotaped for 24 to 48 hours. Then
the following data was extracted from viewing and analyzing the
recorded tapes in increments of 15 minutes:
i. Number of daily vehicles at each directional approach (ADT)
ii. Number of daily pedestrians crossing each directional approach
(ADP)
In addition, distances crossed (DC) at each directional approach was measured from the aerial maps.
e. Pedestrian Crash Rates
As explained earlier, three (3) main significant parameters
were required to calculate the exposure measure:
i. Average Daily Pedestrian traffic (ADP)
ii. Distance Crossed (DC)
iii. Average Daily Vehicular traffic (ADT)
The following formula is used to calculate the actual pedestrian crash rate at intersections:
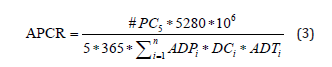
Where: (3) APCR= Actual Pedestrian Crash Rate #PC5= Number of Pedestrian Crashes over 5-year period Σni-1ADPi∗DCi∗ADTi = Sum of cross product of the average daily pedestrians * distance crossed in feet * average daily traffic for each directional approach (1 to 8).
It was more appropriate to use the sum of the product of the pedestrian miles crossed (PMC) and entering volume (ADT) for each entering and departing approach separately instead of using the cross product of the aggregate sum of each parameter along all approaches as depicted on Figures 2a & 2b. The above parameters were extracted from the sample intersections and pedestrian crash rates per million pedestrian miles crossed per entering vehicle (MPMC/EV) was calculated for each intersection as shown in Table 3.

Table 3:Pedestrian Crash Rates at Sample Intersections.


Estimation of Intersection Pedestrian Volume
In order to arrive at the statewide averages for the intersections, the 3 main parameters mentioned above are required. Since statewide pedestrian counts at each intersection are not available and not feasible to collect, it needs to be estimated from existing data. Estimating the intersection pedestrian volume using the collected sample data was one of the most challenging tasks of this methodology. The 52 sample intersections, where pedestrian count data were collected, were utilized for this analysis. Several attempts were performed to find correlations between pedestrian volumes and intersection data, i.e., distance crossed in feet and daily traffic volume. It was also essential to include population size around each intersection due to its known correlation to the magnitude of pedestrian volume. Population size around each of the statewide intersection within a quarter mile (0.25) distance were obtained using the census population block GIS layer and included in the statistical analysis.
Statistical Analysis
JMP statistical model (version 16), a module from SAS software, was used in this investigation. The 3 independent variables ADT, distance crossed (DIST), and population (POP). The response variable was the pedestrian volume (ADP). Preliminary analysis was conducted for the 52 intersections of sample data using JMP’s forward stepwise regression approach with all main effects and interactions as candidate effects according to the effect hierarchy principle. Stepwise regression is a very basic way of handling variable inclusion issues. An initial model was developed but the fit was poor due to the presence of 5 data points that were considered outliers. Therefore, they were eliminated from the dataset. Different data transformations were applied to the parameters and the highest correlation was found between the Distance (DIST), square root of the daily traffic volume (SQRTADT), natural logarithm of Population (LNPOP) and the natural logarithm of pedestrian volume (LNADP). This improved form of the model included the 3 significant main effect parameters along with other 2 two-way factor interaction terms with an adjusted coefficient of determination (R2) of 72.08% which means that 72% of the data were
explained by the model:
Ln(ADP)=a1+a2 Ln(POP)+a3 sqrt(ADT)–a4
Ln(POP)*sqrt(ADT)–a5 DIST+a6 DIST*sqrt (ADT) (4)
The model results and the prediction profiles for the significant factors selected by the model are displayed on Figure 3 showing the actual values of the response variable (Ln ADP). The prediction profilers are dynamic and interactive. A separate prediction equation for each dependent variable is fitted to the observed responses on the respective dependent variable. The developed model was applied to the statewide data where pedestrian volumes were estimated using the AADT at each approach, total distance crossed as well as the population size surrounding each intersection within 0.25-mile radius.

Intersection Classification
The 3 main parameters required to calculate the exposure measure
at intersections are now available especially after applying the
above model for estimating pedestrian volume. The next step in the
process demanded the classification of the intersections based on
these 3 parameters. The sample intersection data was used to examine
distributions of total crossed distances as well as the total
daily number of pedestrians at each intersection. Based on the total
distance crossed for all the approaches, Intersections were classified
as:
i. Intersections with total crossing distance less than 200 ft (11
intersections)
ii. Intersections with total crossing distance between 200 ft and
300 ft (17 Int)
iii. Intersections with total crossing distance between 300 ft and
400 ft (17 Int)
iv. Intersections with total crossing distance greater than 400 ft
(7).
This classification provided similar number of intersections
at each crossed distance category as shown in parenthesis from
the pilot intersection data. Similarly, intersections were classified
based on the total daily number of pedestrians crossing the
intersection approaches to provide similar number of intersections
at each pedestrian category as shown in parenthesis from the pilot
intersection data:
a. Intersections with total daily pedestrians less than 100 pedestrians
per day (16 Int)
b. Intersections with total daily pedestrians between 100 and
300 pedestrians per day (17)
c. Intersections with total daily pedestrians more than 300 pedestrians
per day (19 Int)
On the other hand, statewide total daily number of vehicles at
every intersection in the State of Florida was obtained from the data
associated with the traffic monitoring sites along with the AADT
GIS layer as explained earlier. The distribution of the total number
of vehicles for all approaches was examined for the 3,492 intersection
that experienced crashes. The following classification based
on the total daily number of vehicles provided similar number of
intersections at each AADT category as shown in parenthesis from
the statewide intersection data:
a. Intersections with total AADT less than 20,000 vehicles per
day (836 Int)
b. Intersections with total AADT between 20,000 and 30,000 veh
per day (827 Int)
c. Intersections with total AADT between 30,000 and 40,000 veh
per day (772 Int)
d. Intersections with total AADT between 40,000 and 50,000 veh
per day (537 Int)
e. Intersections with total AADT more than 50,000 vehicles per
day (518 Int)
Based on the above classifications, there existed 5*4*3 = 60 different combinations for average values for crash rates at the intersections.
Establish Statewide Average Pedestrian Crash Rates at Intersections
The same methodology for calculating the exposure measure for the sample intersections was used to calculate the exposure measure at all the statewide intersections using the 3 main parameters; AADT at each approach, distance crossed and the estimated daily pedestrians. Based on the intersection classifications and combinations of the different ranges, the statewide averages for pedestrian crash rates at intersections were established. It was found that 47 different averages out of the 60 were generated. The remaining averages for the 13 combinations were not found in the database. Table 4 summarizes the developed statewide averages for the intersection crash rates.
Table 4:Statewide Averages for Pedestrian Crash Rates at Intersections.

Notes:
Vpd: Total entering vehicles per day at the intersection (AADT for all approaches/2)
Ped: Total pedestrian counts for all intersection approaches
Ft: Total crossing distance for all intersection approaches
Determine Critical Hotspot Locations within District 5
The final step in the process included the application of the developed statewide average rates to the sample data for the purpose of identifying critical hotspot locations within District 5. As can be seen in Table 5, the 52-sample intersection actual crash rates based on the data collected from the field were compared against the statewide average rates. The data showed several intersections with extremely low number of pedestrian crashes over the 5-year period. In order to disqualify intersections with extremely low crash occurrences over the 5-year period, other criteria were required. At minimum, 5 crashes over the 5-year period are required to qualify for the analysis. Therefore, the analysis was revised to include the minimum threshold of 5 crashes over the 5-year period which was compared to the statewide averages. The results showed that few of the intersections within the urban boundary of District 5 triggered safety concerns as critical locations which require further investigation to identify main causes and emphasize mitigation improvements.
Conclusions & Recommendations
To date there are no clear or uniform standards for a method to measure pedestrian incidents against a statewide average. In this study, statewide averages for pedestrian crash rates along the roadways as well as the intersections were quantified. The main objective is to identify critical pedestrian crash locations, thus evaluating locations that are operating beyond or above statewide averages, identifying main causes and developing a prioritization tool to emphasize mitigation improvements. It was crucial to address the pedestrian- vehicular conflict as the State of Florida currently tops the list in the “Dangerous by Design” report as having the highest four (4) pedestrianincident locations in the Country. The main challenge in analyzing pedestrian crashes is to identify a practical and correct exposure measure. In most cases, the exposure measure is either unavailable or can be obtained at a greater cost. The methods and procedures explained in this paper are considered detailed, practical and provide a broad depiction of the main factors that directly contribute to pedestrian crashes. The main parameters used in calculating pedestrian crash rates along the different roadway categories which combine the functional classification, number of lanes and area type together were the AADT and the total length of the roadway category. Conversely, the main parameters used for computing pedestrian crash rates for the different intersection classifications were the daily pedestrian volumes, distance crossed and the AADT in addition to the number of pedestrian crashes either along the studied roadways or intersections. The pilot studies conducted for the roadways and intersections revealed several critical safety locations within District 5 when compared to the developed statewide average rates which require further investigation to identify main causes and emphasize mitigation improvements. It is recommended that an annual statewide pedestrian count program be initiated for the intersections as well as roadways which would increase the sample size and help in validating the assumptions provided in this study. The purpose and duration of data collection are essential pieces of information for determining the appropriate data.
Table 5:Actual Crash Rates versus Statewide Averages for Intersection Pilot Study.

Author Contributions
The authors confirm contribution to the paper as follows: study conception and design: Hatem Abou-Senna; data collection: Azza Alisawi and Negaar Minaei; analysis and interpretation of results: Hatem Abou-Senna, Negaar Minaei and Azza Alisawi; draft manuscript preparation: Hatem Abou-Senna, Azza Alisawi and Negaar Minaei. All authors reviewed the results and approved the final version of the manuscript.
References
- Williams A (2013) Pedestrian Traffic Fatalities by State.
- National Highway Safety Adminstration, NHTSA (2021) Traffic Safety Facts 2021data.
- Ernst M, Lang M, Davis S (2021) Dangerous by design 2021.
- National Pedestrian Crash Report (2020).
- Clifton KJ, Burnier CV, Akar G (2009) Severity of injury resulting from pedestrian–vehicle crashes: What can we learn from examining the built environment? Transportation Research Part D: Transport and Environment 14(6): 425-436.
- Mohamed MG, Saunier N, Miranda Moreno LF, Ukkusuri SV (2013) A clustering regression approach: A comprehensive injury severity analysis of pedestrian–vehicle crashes in New York, US and Montreal, Canada. Safety Science 54: 27-37.
- Dai D (2012) Identifying clusters and risk factors of injuries in pedestrian–vehicle crashes in a GIS environment. Journal of Transport Geography 24: 206-214.
- Ukkusuri S, Miranda Moreno LF, Ramadurai G, Isa-Tavarez J (2012) The role-built environment on pedestrian crash frequency. Safety Science 50(4): 1141-1151.
- Cho G, Rodriguez DA, Khattak AJ (2009) The role of the built environment in explaining relationships between perceived and actual pedestrian and bicyclist safety. [Research Support, Non-U.S. Gov't]. Accident Analysis Prevention 41(4): 692-702.
- Zajac SS, Ivan JN (2003) Factors influencing injury severity of motor vehicle–crossing pedestrian crashes in rural Connecticut. Accident Analysis and Prevention 35(3): 369-379.
- Lee C, Abdel Aty M (2005) Comprehensive analysis of vehicle-pedestrian crashes at intersections in Florida. Accident Analysis and Prevention 37(4): 775-786.
- Hanson CS, Noland RB, Brown C (2013) The severity of pedestrian crashes: an analysis using Google Street View imagery. Journal of Transport Geography 33: 42-53.
- Chidester AB, Isenberg RA (2001) Final report: The pedestrian crash data study. Society of Automotive Engineers.
- Brustman R (1999) An Analysis of Available Bicycle and Pedestrian Accident Data: A Report to the New York Bicycling Coalition.
- Thomas L, Hamlett C, Hunter W, Gelinne D (2009) Identifying Locations for Pedestrian and Bicyclist Safety Improvements in Chapel Hill and Carrboro, North Carolina.
- Robert Allard (1982) Excess Mortality from Traffic Accidents among Elderly Pedestrians Living in the Inner city. American Journal of Public Health 72: 853-854.
- Dumbaugh E, Li W, Joh K (2012) Examining the Design and Developmental Factors Associated with Crashes Involving Pedestrian, Cyclists, and Motorists in Urban Environments.
- Dewey JF, Demslow D, Lenze D, Holt L, Lotfinia B (2003) Transportation issues: pedestrian safety.
- Alluri P, Haleem K, Gan A, Lavasani M, Saha D (2013) Comprehensive Study to Reduce Pedestrian Crashes in Florida.
- Abou Senna H, Radwan E, Mohamed A (2022) Investigating the correlation between sidewalks and pedestrian safety. Accident Analysis & Prevention 166: 106548.
- Radwan E, Darius B, Wu J, Abou-Senna H (2016) Simulation of pedestrian safety surrogate measures. ARRB Conference, 27th, Melbourne, Victoria, Australia.
- Radwan E, Abou-Senna H, Mohamed A, Navarro A, Wu J, et al. (2016) Assessment of sidewalk/bicycle-lane gaps with safety and developing statewide pedestrian crash rates. Florida Department of Transportation, Final Report.
- Abou Senna H, Radwan E, Abdelwahab HT (2021) Categorical principal component analysis (CATPCA) of pedestrian crashes in Central Florida. Journal of Transportation Safety & Security 14(11): 1890-1912.
- Abou Senna H, Radwan E, Mohamed A (2018) Safety Prioritization Tool for Sidewalk and Bike-Lane Gaps. Transportation Research Board 97th Annual Meeting Transportation Research Board.
- (2023) Signal Four Analytics Website.
-

This work is licensed under a Creative Commons Attribution-NonCommercial 4.0 International License.


