 Research Article
Cardiac Output assessed via Esophageal Doppler
Monitoring Fails to Predict Changes in Renal
Microvascular Perfusion
David J Read1,2, Thomas P Heinink3, Brett Doleman*1,2, Jonathan N Lund2, Bethan E Phillips2 and John P
Williams1,2
1Department of Anaesthesia and Critical Care, Royal Derby Hospital, UK
2Division of Medical Sciences and Graduate Entry Medicine, University of Nottingham, UK
3Department of Anaesthesia, Frimley Health Foundation Trust, Frimley Park Hospital, Surrey
David J Read1,2, Thomas P Heinink3, Brett Doleman*1,2, Jonathan N Lund2, Bethan E Phillips2 and John P Williams1,2
1Department of Anaesthesia and Critical Care, Royal Derby Hospital, UK
2Division of Medical Sciences and Graduate Entry Medicine, University of Nottingham, UK
3Department of Anaesthesia, Frimley Health Foundation Trust, Frimley Park Hospital, Surrey
Brett Doleman, Department of Anaesthesia and Critical Care, Royal Derby Hospital, Derby, UK.
Received Date: September 24, 2019; Published Date: October 10, 2019
Abstract
Background: Vasoactive drugs are routinely used clinically to alter mean arterial blood pressure (MAP) and cardiac output (CO) and to maintain organ perfusion. However, the effect of such drugs on microvascular visceral blood flow (MiBF) is not fully understood. We aimed to track changes in renal MiBF, using the well-validated technique of Contrast Enhanced Ultrasound (CEUS), across a range of MAP and CO generated via the vasoactive drugs, phenylephrine and ephedrine.
Methods: Baseline cardiovascular measurements were recorded, with renal MiBF determined via CEUS as renal microvascular transit time (RTT). Phenylephrine was then administered, via a standardized protocol, to increase MAP and CO, with repeat CEUS. Following return to baseline, the above was repeated using ephedrine. CEUS time-intensity curves were constructed and renal MiBF calculated.
Results: In 11 male volunteers (median age 32), phenylephrine increased MAP (98.7 vs 110.8 mmHg, p<0.001), but not CO (4211 vs. 4089 ml.min-1, p=0.42), while ephedrine increased CO (4110 vs 6097, p<0.001) and MAP (95.6 vs 100.9, p=0.02). Phenylephrine reduced time to organ perfusion (TTOP) (22.3 vs 18.4 secs, p=0.009), but not RTT (14 vs 13.2 secs, p=0.46). Ephedrine decreased TTOP (21.1 vs 14.7 secs, p=0.003), and RTT (3.5 vs 9.6 secs, p=0.007). Change in CO predicted change in TTOP (r2=0.26, p=0.02), but not RTT (r2=0.04, p=0.43). Change in MAP did not predict change in TTOP (r2=0.02, p=0.58), or RTT (r2<0.001, p=0.89).
Conclusion: Changes in MAP and CO fail to predict renal MiBF.
Key points
Question: Do macrovascular changes predict renal microvascular perfusion.
Findings: Changes in cardiac output and mean arterial blood pressure fail to predict renal microvascular perfusion.
Meaning: Clinical measurement of macrovascular indices may not correlate with microvascular indices.
Introduction
There are estimated to be over 240 million surgical operations performed per year worldwide, with 8 million undertaken in the UK alone [1, 2] Of these patients having surgery, 8% are admitted to the intensive care unit and 4% die in the peri-operative period, [3] while for those undergoing major abdominal surgery, operation carries a significant risk of death (~4%), [4] post-operative complication (33- 35%) and renal failure (7-39%) [5-7]. Poor microvascular perfusion is associated with post-operative complications [8,9]. Adequate organ perfusions maintained by minimizing unwanted fluid shifts and optimizing cardiovascular performance during surgery is thus essential if this risk of morbidity and mortality are to be minimized at operation and in the post-operative period. Unfortunately, the majority of currently available monitors of cardiovascular function (ECG, pulse oximetry, blood pressure) do not provide information about blood flow, either centrally or in tissue beds. They therefore commonly fail to adequately define instances of cardiovascular insufficiency and the resultant poor tissue perfusion.
To address this fundamental failing in theatre monitoring during major surgery, the National Institute for Health and Care Excellence (NICE) has recommended the use of the minimally invasive technique of Esophageal Doppler ultrasound monitoring (EDM) measurement of cardiac output (CO), for adoption in clinical practice [10]. EDM derived CO monitoring provides an assessment of total-body hemodynamics. As a measure of flow this is likely superior to traditional cardiovascular measurement techniques, but still cannot identify changes in small blood vessel perfusion at the individual organ level. Moreover, global measures of oxygenation have previously been shown to relate poorly to tissue perfusion and oxygenation in clinical states such as surgery and critical illness, while the evidence to suggest that intra-operative EDM directed care can improve peri-operative outcome is not compelling [11].
Contrast Enhanced Ultrasound (CEUS) is a validated imaging modality that can provide near-real time imaging of microvascular perfusion within viscera at a capillary level. Therefore, in order to assess the accuracy with which EDM monitoring reflects microvascular perfusion dynamics, we hypothesized that changes in EDM assessed CO, induced through the administration of vasoactive drugs commonly used in clinical practice (phenylephrine; a pure adrenoreceptor alpha agonist and ephedrine; a mixed alpha/beta adrenoreceptor agonist), would correlate with CEUS observed changes in microvascular perfusion in the renal parenchyma of healthy individuals.
Methods
Following University of Nottingham Medical School Research Ethics Committee approval (A12012012) conforming to the Declaration of Helsinki and registration at clinicaltrials.gov (NCT02252627), eleven healthy male participants aged between 18 and 80 years were recruited using a standard demographically targeted postal invitation. Participants attended for a pre-study health screening appointment where written informed consent was obtained. Exclusion criteria were: BMI<20 or >30 kgm-2, recent acute coronary syndrome, use of β-blockers, cerebrovascular disease, metabolic disease, known malignancy, clotting dysfunction, previous esophageal surgery or esophageal varices, history of epistaxis or known sensitivity to the contrast agent SonoVue™ (Bracco SpA, Milan, Italy).
Subject preparation
On the study day subjects were asked to attend the University of Nottingham Clinical, Metabolic and Molecular Physiology laboratories at Derby, fasted for 6 hours of food and oral fluids. A medically qualified doctor was present throughout the study with subjects continuously monitored via pulse oximetry (SpO2), electrocardiography (ECG) and non-invasive blood pressure recording (NIBP). Following insertion of a 20G intravenous cannula in the right ante-brachial vein, a trans-esophageal Doppler probe (Deltex Medical, Chichester, UK) was inserted into the esophagus nasally, following 10% lidocaine spray and 2% lidocaine gel as local anesthesia to the naso-pharynx (Clin-Med Ltd, High Wycombe, United Kingdom). The probe was connected to a CardioQ Esophageal Doppler Monitor (EDM) (Deltex Medical, Chichester, UK) and probe position corrected to achieve optimal Doppler flow signal.
Contrast enhanced ultrasound
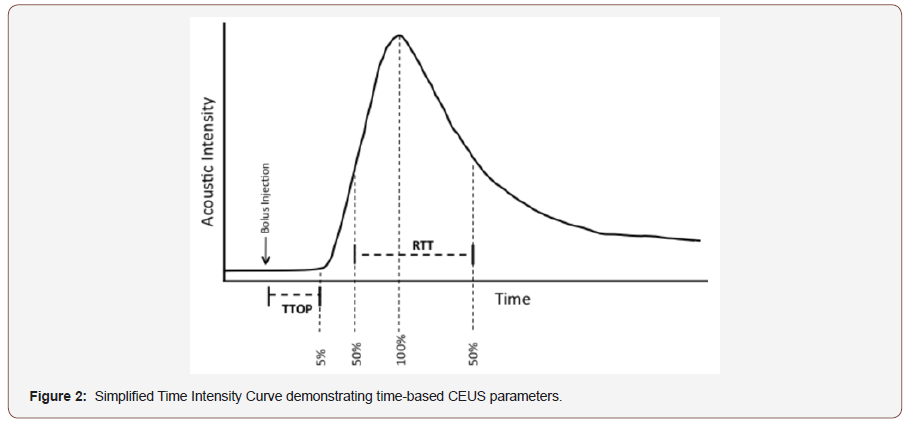
CEUS utilizes echogenic contrast microspheres that return a characteristic echo pattern under ultrasound. During CEUS, intravenous bolus administration of contrast agent permits construction of time-acoustic intensity (AI) curves, which provide information regarding microvascular perfusion within the viscera (Figure 1&2). Numerous in-vitro and in vivo studies have validated the accuracy of CEUS in assessing visceral microvascular blood flow, demonstrating close correlation with thermodilution, [12] mechanically controlled flow [13] and end organ microvascular perfusion [14,15]. Moreover, the time to organ perfusion (TTOP), via bolus contrast administration to 5% of peak acoustic intensity, and mean transit time through visceral organ, defined as the time taken from 50% (wash in) to 50% (wash out) of peak AI (Figure 2), have previously been validated as a method of tracking changes in intra-abdominal viscera microvascular blood [16,17].
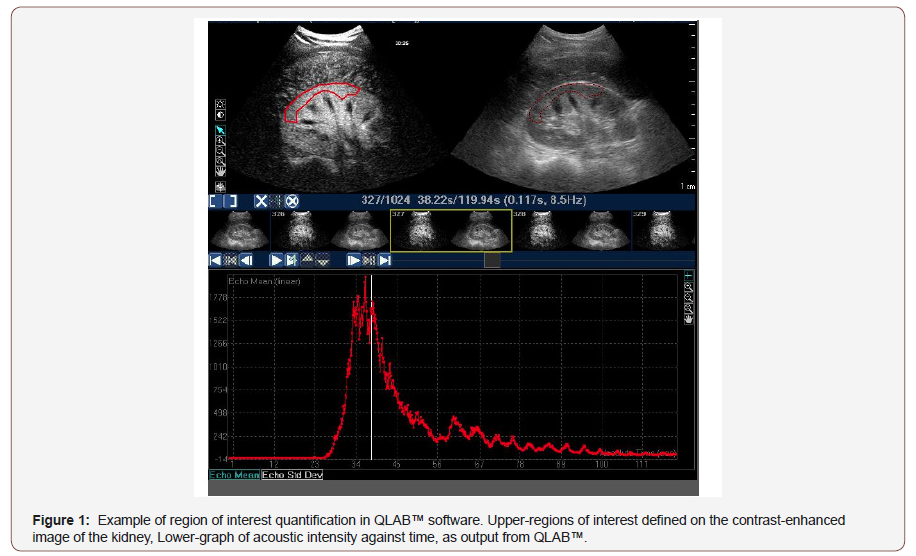
SonoVue™, was used as the contrast agent for quantitative CEUS, [18] to assess microvascular blood flow within the kidney. Preparation was per the manufacturer’s instruction [19]. In brief, 25mg of lyophilized powder was reconstituted with 5ml of 0.9% sodium chloride solution (NaCl) in a SF6 atmosphere. A Philips iU22 ultrasound machine (Philips Healthcare, Reigate, UK) with a C5-1 MHz curvilinear probe (Philips Healthcare) was used for all CEUS assessments, using dual contrast/tissue side-by-side mode. As per our standard imaging protocol, cine recordings were made at 9Hz with a contrast resolution of C40, a working mechanical index (MI) of 0.04, a maximum depth of 16cm and focus at 8-14cm, with gain optimized for each individual subject [20].
Experimental protocol
Participants were placed in a semi-recumbent position, mirroring clinical practice. The ultrasound probe was positioned to allow imaging of the right kidney with probe position optimized to visualize renal parenchyma and the skin marked with ink to facilitate repeat visceral imaging. Once the probe was positioned, baseline recordings of SpO2, ECG, MAP, HR and SV were made. CEUS of the kidney was then performed by administering an intravenous bolus of 0.5ml of SonoVue™ over one second, immediately followed by 5ml of 0.9% NaCl over 2 seconds. Simultaneously, continuous real-time low MI ultrasound recording of the kidney commenced for 2 minutes. After each 2-minute cycle, a 5-minute pause was observed, to allow for elimination of contrast microbubbles, and for SpO2, MAP, SV and HR to be recorded. The above sequence was repeated three times.
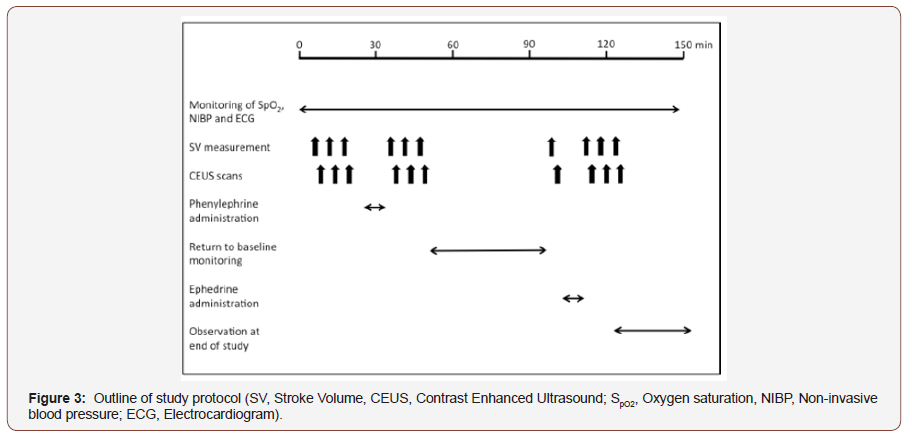
Following baseline recordings, phenylephrine, a pure alpha adrenoreceptor agonist was administered intravenously in 100 microgram aliquots, until a 20% increase in baseline MAP was recorded or to a maximum dose of one milligram. On completion of phenylephrine administration, SpO2, MAP, SV and HR were recorded and CEUS recordings repeated as per the above protocol. After phenylephrine administration and following return to baseline blood pressure or a minimum of 45 minutes, a further set of baseline measurements were performed. Ephedrine, a mixed alpha/beta adrenoreceptor agonist, was then given in 6 milligram increments up to a maximum of 30 milligrams aiming to achieve a 20% increase in MAP. On completion of ephedrine administration, SpO2, MAP, SV and HR were recorded and CEUS recordings repeated as per above. Participants were monitored for 30 minutes following completion of the study protocol (Figure 3).
CEUS Image analysis
As per our previously published methodology, ultrasound video files were analyzed using QLAB™ software (Philips Healthcare). 20 Regions-of-interest (ROI) were defined within kidney images to allow calculation of the mean pixel intensity within each ROI for each frame of the ultrasound loop (Figure 1). ROI were chosen to ensure as large an area as possible was available for analysis, whilst avoiding tissue close to the capsule of each organ, allowing for the effect of organ movement seen with respiration to be minimized. Large hilar blood vessels were excluded from the ROI to achieve preferential assessment of microvascular hemodynamics.
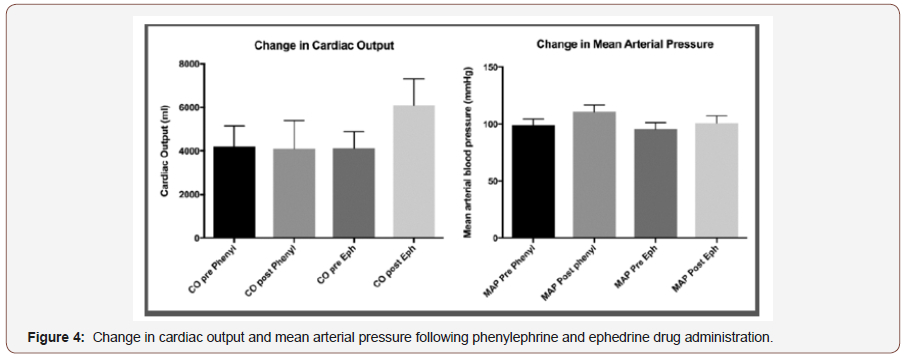
For each bolus injection, ROI time intensity curves were calculated for the kidney from each frame (i.e. at 9Hz) and subsequently standardized to the organ’s maximum intensity. Standardized AI traces were smoothed, and low pass filtered by smoothing to 32 neighbors, 2nd order polynomial using GraphPad Prism™ v6.0 (La Jolla, CA. USA). The resultant time–intensity trace was used to calculate time to organ perfusion (TTOP), a measure of macrovascular blood flow, via time to 5% peak AI following contrast administration. Mean renal transit time (RTT), a measure of renal microvascular perfusion, was assessed via time from 50% peak AI on wash in slope to 50% peak AI on wash out slope. Data for SV, MAP, HR and SpO2 were recorded as described above and data stored on an Excel spreadsheet (Microsoft Corporation, Redmond, Washington, USA) (Figure 4).
Statistical analysis
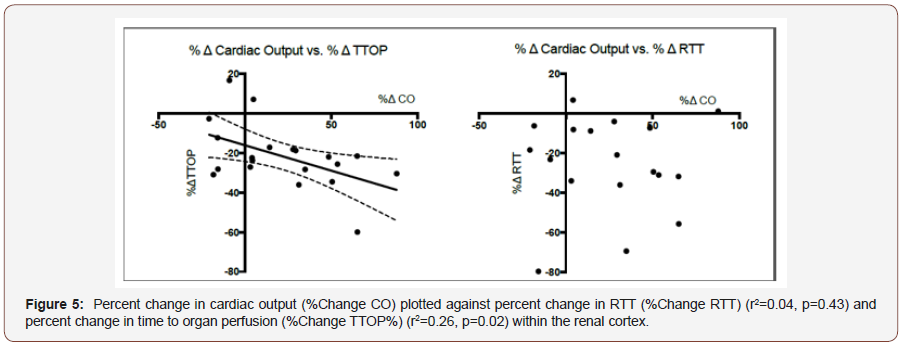
Sample size calculations indicated a need for n=10 (for α=0.05, β=0.85), to detect a 20% change in cardiac output as a measure of macrovascular flow and renal microvascular blood flow assessed through CEUS; results we have been able to achieve for previous work looking at similar physiological systems. One participant was unable to tolerate EDM insertion and therefore 11 participants were recruited. Statistical analysis was performed using GraphPad Prism™ v6.0 (La Jolla, CA. USA) and STATA v14 (Texas, USA). Determination of Gaussian distribution was performed using the skewness and kurtosis test (sktest command in STATA), with normal data expressed as mean (standard deviation) and nonnormal data as median [interquartile range]. Statistical analysis of endpoint data was performed via paired t tests or Wilcoxon signed rank test as appropriate. The relationships between macrovascular and microvascular endpoints were assessed using linear regression. We considered p<0.05 as statistically significant (Figure 5).
Results
Eleven healthy male volunteers, median age 32 (IQR 27-45), BMI 25 (SD 2.5) were studied, with EDM insertion tolerated well in all but one participant. Phenylephrine (1000±4.55μg) and ephedrine (30±0.0 mg) were administered to all subjects with no adverse events reported. Baseline macrovascular variables returned to normal following phenylephrine administration and prior to ephedrine administration, with no clinically significant difference between pre-phenylephrine and pre-ephedrine administration for CO (4211(926) vs 4110 (784)mlmin-1, p=0.45), MAP(98.7(5.6) vs 95.6(5.7)mmHg, p=0.08), or heart rate (60.6(9.7) vs 57.3(7.6)bpm, p=0.05). Similarly, CEUS measurements of macro and microvascular perfusion, time to organ perfusion and renal transit time returned to baseline prior to ephedrine administration (TTOP; 22.3(4.6) vs 21.3(4.5) secs, p=0.28: RTT; 14(4.6) vs 13.5(4.4) secs, p=0.73).
Following phenylephrine administration, MAP increased 98.7(5.6) vs 110.8(6) mmHg, p<0.001) with CO remaining unchanged (4211(925.6), vs 4089(1310)mlmin-1, p=0.42). Ephedrine administration also increased MAP (95.6 (5.7) vs. 100.9 (6.2), p=0.02), but also increased CO (4110(783.7) vs 6097(1210), p<0.001). Heart rate decreased following phenylephrine administration and increased following ephedrine administration (60.6(9.7) vs 51.9(7.9) bpm, p=0.003; 57.3(7.6) vs 70.7 (11.5) bpm, p<0.001, respectively). With regard to CEUS assessed vascular perfusion; phenylephrine administration resulted in a significant decrease in time to organ perfusion (TTOP; 22.3(4.6) vs 18.4(3.2) secs, p=0.009), but no change in renal transit time (RTT; 14 (4.6) vs 13.2 (3.4) secs, p=0.46). Ephedrine administration resulted in a significant decrease in time to organ perfusion (TTOP; 21.1[17- 23.5] vs 14.7 [11.8-16.1] secs, p=0.003), and renal microvascular perfusion time as assessed by renal transit time (RTT; 13.5(4.4) vs 9.6(3.1) secs, p=0.007). Percentage changes in cardiac output predicted similar changes in time to organ perfusion (r2=0.26, p=0.02), but not to CEUS assessed renal microvascular perfusion (percentage change RTT) (r2=0.04, p=0.43). We also failed to predict similar changes between MAP and macrovascular renal perfusion (TTOP) (r2=0.02, p=0.58), or microvascular perfusion (RTT) (r2 <0.001, p=0.89).
Discussion
In this study, we used two commonly clinically administered vasoactive agents, phenylephrine and ephedrine, to induced significant changes in mean arterial blood pressure (12%) and cardiac output (49%) respectively. Although the administration of vasoactive agents resulted in profound changes in macrovascular cardiovascular variables, with cardiac output, unsurprisingly, predicting time to organ perfusion, we observed no such relationship between cardiac output, or mean arterial pressure, and renal intravisceral microvascular perfusion. However, interestingly, ephedrine was found to reduce renal microvascular perfusion time when compared to phenylephrine.
Despite EDM of CO being advocated by NICE as a mechanism for correcting functional hypovolemia and optimizing intravascular volume through directed fluid replacement, 10 there is little evidence demonstrating any benefit of such an approach on microvascular perfusion within the viscera. We believe that we are the first to show that alterations in EDM measured CO are not reflective of similar changes in renal intra-visceral microvascular perfusion. Similarly, we found no evidence to suggest that changes in mean arterial pressure were indicative of microvascular perfusion within the kidney. Monitoring of CO provides an understanding of global blood flow but provides little or no detail relating to tissue perfusion within individual organs. Clinical investigations addressing the use of EDM and its effect on peri-operative outcomes in clinical practice have been inconclusive, with adoption of EDM therefore variable.
Our finding of a lack of relationship between global measures of flow and microvascular perfusion within the kidney may help to account for the failure of EDM targeted fluid optimization to influence patient outcome more effectively and hence achieve greater clinical acceptability [21,22]. Furthermore, implementation of CEUS targeted therapy in the surgical patient may offer the potential for a novel approach to clinical care. This would however require the development of a true real-time monitor and further trials in a clinical population. We accept that there are a number of limitations to this study. Firstly, the use of healthy subjects’ limits translation of our findings to clinical patients, where the auto regulatory ability of the body is commonly affected by anesthesia or illness.
Secondly although, CO varies with position it was decided that subjects should be studied in a semi-recumbent position to aid comfort and to mirror patient positioning on the intensive care unit. Participant positioning therefore did not reflect the fully supine position adopted during most surgical procedures. Finally, although efforts were made to ensure the consistency of tissue imaged throughout, absolute probe fixation is not possible and small movements, such as those occurring with respiration, induce movement artifact and are unavoidable in the awake subject [23]. To overcome this, we employed a validated time-based approach robust to small variations in the imaged tissue, to measure tissue perfusion, limiting the influence of movement artifact on our findings.
Conclusion
We found that esophageal Doppler monitoring fails to track changes in renal microvascular blood flow in response to profound alterations in global measures of cardiovascular function. More investigations are required in a clinical population before CEUS can be utilized to offer real time measurement of organ perfusion in the patient.
Acknowledgement
The authors would like to thank Mrs Amanda Gates (University of Nottingham, Derby, UK) and Mrs Margaret Baker (University of Nottingham, Derby, UK) for their assistance with volunteer recruitment and data acquisition.
Conflict of Interest
No conflict of interest.
References
- Weiser TG, Makary MA, Haynes AB, Dziekan G, Berry WR, et al. (2009) Standardised metrics for global surgical surveillance. Lancet 374(9695): 1113-1117.
- Pearse RM, Moreno RP, Bauer P, Pelosi P, Metnitz P, et al. (2012) Mortality after surgery in Europe: a 7-day cohort study. Lancet 380(9847): 1059-1065.
- Pearse RM, Rhodes A, Moreno R, Pelosi Paolo, Spies Claudia, et al. (2011) EuSOS: European surgical outcomes study. Eur J Anaesthesiol 28(6): 454-456.
- Centre HaSCI: National Bowel Cancer Audit Report 2015.
- Straatman J, Cuesta MA, De Lange-de Klerk ES, Van Der Peet DL (2015) Hospital cost-analysis of complications after major abdominal surgery. Dig Surg 32(2): 150-156.
- Masoomi H, Carmichael JC, Dolich M, Mills’ S, Ketana N, et al. (2012) Predictive factors of acute renal failure in colon and rectal surgery. Am Surg 78(10): 1019-1023.
- Carmichael P, Carmichael AR (2003) Acute renal failure in the surgical setting. ANZ J of surg 73(3): 144-153.
- Jhanji S, Lee C, Watson D, Hinds C, Pearse RM (2009) Microvascular flow and tissue oxygenation after major abdominal surgery: association with post-operative complications. Intensive Care Med 35(4): 671-677.
- Vignali A, Gianotti L, Braga M, Radaelli G, Malvezzi L, et al. (2000) Altered micro perfusion at the rectal stump is predictive for rectal anastomotic leak. Dis Colon Rectum 43(1): 76-82.
- (2011) Medical technologies guidance MTG3: CardioQ-ODM oesophageal doppler monitor. In: National Institute for Health and Clinical Excellence.
- Som A, Maitra S, Bhattacharjee S, Baidya DK (2017) Goal directed fluid therapy decreases postoperative morbidity but not mortality in major non-cardiac surgery: a meta-analysis and trial sequential analysis of randomized controlled trials. J Anesth 31(1): 66-81.
- Herold IH, Russo G, Mischi M, Houthuizen P, Saidov T, et al. (2013) Volume quantification by contrast-enhanced ultrasound: an in-vitro comparison with true volumes and thermodilution. Cardiovasc Ultrasound 11(1): 36.
- Wei K, Jayaweera AR, Firoozan S, Linka A, Skyba DM, et al. (1998) Quantification of myocardial blood flow with ultrasound-induced destruction of microbubbles administered as a constant venous infusion. Circulation 97(5): 473-483.
- Wei K, Le E, Bin JP, Coggins M, Thorpe J, et al. (2001) Quantification of renal blood flow with contrast-enhanced ultrasound. J Am Coll Cardiol 37(4): 1135-1140.
- Rim SJ, Leong Poi H, Lindner JR, Couture D, Ellegala D, et al. (2001) Quantification of cerebral perfusion with "Real-Time" contrast-enhanced ultrasound. Circulation 104(21): 2582-2587.
- Gauthier TP, Averkiou MA, Leen EL (2011) Perfusion quantification using dynamic contrast-enhanced ultrasound: the impact of dynamic range and gain on time-intensity curves. Ultrasonics 51(1): 102-106.
- Gauthier TP, Wasan HS, Muhammad A, Owen DR, Leen EL (2011) Assessment of global liver blood flow with quantitative dynamic contrast-enhanced ultrasound. J Ultrasound Med 30(3): 379-385.
- Mitchell WK, Phillips BE, Williams JP, Rankin D, Smith K, et al. (2013) Development of a new Sonovue™ contrast‐enhanced ultrasound approach reveals temporal and age‐related features of muscle microvascular responses to feeding. Physiol Rep 1(5): e00119.
- (2015) Summary of product characteristics.
- Heinink TP, Read DJ, Mitchell WK, Bhalla A, Lund JN, et al. (2017) Oesophageal Doppler guided optimization of cardiac output does not increase visceral microvascular blood flow in healthy volunteers. Clin Physiol Funct Imaging 38(2): 213-219.
- Thomas C, Allen C (2015) Impact of NICE guidance and CQUINS on uptake of cardiac output monitors across the NHS: a trainee-led national survey. Br J Anaesth 115(6): e950-e962.
- Pearse RM, Harrison DA, Mac Donald N, Gillies MA, Blunt M, et al. (2014) Effect of a perioperative, cardiac output-guided hemodynamic therapy algorithm on outcomes following major gastrointestinal surgery: a randomized clinical trial and systematic review. Jama 311(21): 2181-2190.
- Tang MX, Mulvana H, Gauthier T, Lim AK, Cosgrove DO, et al. (2011) Quantitative contrast-enhanced ultrasound imaging: a review of sources of variability. Interface Focus 1(4): 520-539.
-
Brett Doleman, David J Read, Thomas P Heinink, Jonathan N Lund, Bethan E Phillips, John P Williams. Cardiac Output assessed via Esophageal Doppler Monitoring Fails to Predict Changes in Renal Microvascular Perfusion. Anaest & Sur Open Access J . 1(2): 2019. ASOAJ. MS.ID.000510.
-
Blood pressure, Vasoactive drugs, Phenylephrine, Molecular Physiology, Cardiovascular, Microvascular, Adrenoreceptor, Cerebrovascular disease, Esophageal surgery, Organ perfusion.
-

This work is licensed under a Creative Commons Attribution-NonCommercial 4.0 International License.


