


 Research Article
Systematic Optimization of Forced Degradation Conditions Using Design of Experiments
1Research & Development, Alkaloid AD, Skopje, North Macedonia
2Faculty of Pharmacy, University “Ss. Cyril and Methodius”, Skopje, North Macedonia
Received Date:May 06, 2026; Published Date:May 20, 2026
Abstract
This manuscript describes a comprehensive and systematic evaluation of the degradation behavior of rosuvastatin using experimental design methodology as a scientific multifactorial approach. Design of experiments (DoE) was applied to forced degradation studies. Rosuvastatin was subjected to oxidative, acidic, basic, hydrolytic, thermal, and photolytic stress conditions to evaluate its stability profile. A 2ⁿ full factorial design was employed to optimize degradation parameters and achieve the targeted level of degradation, ensuring meaningful assessment of degradation pathways. Efficient separation of rosuvastatin from its related impurities and degradation products was achieved using a Halo-C8 column (150 × 4.6 mm, 2.7 μm) with gradient elution consisting of 20 mM ammonium acetate buffer (pH 4.0) and acetonitrile and methanol in ratio 2:1 as organic mobile phase. The developed method was validated in accordance with International Council for Harmonisation (ICH) guidelines and demonstrated satisfactory selectivity, linearity, sensitivity, accuracy, and robustness, confirming its suitability for the quantitative determination of rosuvastatin and its impurities. The study highlights the advantages of implementing experimental design in forced degradation studies, providing deeper understanding of critical factors influencing degradation behavior and offering a rational, efficient, and reproducible alternative to conventional trial-and-error approaches.
Keywords:Rosuvastatin; related and degradation products; LC/MS; experimental design; forced degradation
Abbreviations:DoE: design of experiments; OFAT: One factor at a time approach; ICH: International Council for Harmonisation; FDS: Forced degradation studies; API: Active pharmaceutical ingredients; EDQM: European Directorate for the Quality of Medicines and Health Care Council of Europe; CRS: Chemical Reference Standard; HPLC: High Performance Liquid Chromatography; NA: Not applicable; FDFs: finished dosage forms. Liquid chromatography–tandem mass spectrometry (LC-MS); ANOVA:one way analysis of variance.
Introduction
To address the increasing complexity and regulatory expectations of modern pharmaceutical analysis, the comprehensive integration of chemometric tools throughout the analytical process has become indispensable. Contemporary analytical methods are influenced by numerous interdependent variables, and chemometric approaches enable the simultaneous evaluation and control of these factors, thereby facilitating the achievement of optimal analytical performance with a reduced number of experimental trials. Among these approaches, design of experiments (DoE) represents a systematic and statistically sound methodology that allows multivariate data to be efficiently analyzed and modeled using empirical mathematical functions. The application of DoE provides a rational framework for understanding factor interactions, quantifying their individual and combined effects, and establishing robust analytical conditions. In contrast to the conventional one factor at a time (OFAT) approach, which is time consuming and fails to account for factor interactions, DoE offers a more efficient, informative, and scientifically justified strategy for the identification, evaluation, and control of critical variables affecting analytical performance [1,2].
Forced degradation studies (FDS) are integral to elucidating degradation pathways and establishing the stability indicating capability of analytical methods for active pharmaceutical ingredients (APIs) and finished dosage forms (FDFs). Despite their critical role, FDS are frequently executed using empirically selected conditions, with limited systematic evaluation or justification of key stress variables such as stressor intensity, exposure time, and temperature. Consequently, most reported approaches rely on trial-and-error experimentation to achieve an arbitrary level of degradation (commonly 5-20%), thereby limiting reproducibility, mechanistic understanding, and experimental efficiency.
.The present study addresses this methodological gap through the application of a chemometrics driven design of experiments (DoE) framework for the rational assessment of Rosuvastatin degradation behavior. The objectives were to systematically identify and quantify the effects and interactions of critical stress factors, to optimize forced degradation conditions using multivariate experimental design, and to develop and validate a robust, stability indicating method for the separation and quantification of Rosuvastatin and its impurities. This strategy aims to replace conventional empirical practices with a statistically rigorous, reproducible, and knowledge-based approach to forced degradation studies.
Given the high cost, time demands, requirement for specialized expertise, and the frequent generation of non-reproducible results, there is a clear need for a more systematic and scientifically robust approach to forced degradation studies. The objective of this work was to optimize forced degradation conditions using a design of experiments (DoE) framework. Rosuvastatin was selected as a model active pharmaceutical ingredient (API) for two primary reasons: its growing scientific interest related to potential applications in neurological disorders and various cancers in addition to its established antihyperlipidemic activity, and its well documented chemical instability [17].
The present study focuses on the systematic evaluation of rosuvastatin degradation under hydrolytic, oxidative, and photolytic stress conditions. Although existing literature reports rosuvastatin instability primarily in the context of demonstrating the selectivity of stability indicating methods, the individual and combined effects of critical stress parameters-stressor strength, exposure time, and temperature-have not been investigated in a comprehensive manner [18-23] . Therefore, the aim of this study was to explore the degradation behavior of rosuvastatin under acidic, alkaline, oxidative, thermal, and photolytic conditions using a simplified forced degradation strategy based on the DoE concept, enabling rational optimization and enhanced understanding of degradation processes.
The proposed methodology enables systematic investigation of combined stress conditions that yield optimal degradation, while simultaneously quantifying the effect of each factor across varying levels of the others. This approach was selected due to its efficiency, practical applicability, and capability to detect factor interactions that are not accessible through conventional univariate experimentation. Moreover, it significantly reduces the number of experiments required, along with associated time and costs, while providing reliable prediction and control of the desired extent of degradation.
Materials and Methods
Chemicals and Standards. Rosuvastatin CRS was provided by European Directorate for the Quality of Medicines and Health Care Council of Europe (EDQM-Strasbourg, France). Rosuvastatin Impurity B, Rosuvastatin impurity C, Rosuvastatin impurity D, cis Rosuvastatin and sample of Rosuvastatin API were received as free samples from MSN Pharmachem Pvt. Ltd., India. All the reagents used (acetonitrile, ammonium acetate, methanol, acetic acid, sodium hydroxide, hydrochloric acid, and hydrogen peroxide) were analytical grade, purchased from Merck (Darmstadt, Germany). Water was purified by a Werner water purification system. Regenerated cellulose membrane syringe filters with pore size 0.2 𝜇m, purchased from Phenomenex (Torrance, CA.USA), were used.
Experimental Conditions
High Performance Liquid Chromatography (HPLC)
Chromatographic analysis was performed on Agilent Technologies 1260 Series Quaternary Liquid Chromatographic System (Agilent Technologies, USA) equipped with a Quaternary Pump (G13112B), a column compartment (G1316A), thermostat (G1330B), auto sampler (G1367E) and photodiode array detector (G4212B). Instrument control, data acquisition and processing were performed by using OpenLab Chemstation chromatography software (version A.02.02/1.3.4). The separation was performed on Halo C8 150 × 4.6 mm, 2.7 𝜇m (Advanced Materials Technology), using buffer (20 mM ammonium acetate, pH 4.0) and acetonitrile and methanol in ratio 2:1 as organic mobile phase (B) in a gradient mode as follows: T(min)/B (%) 0/40; 10/40; 20/85; 25/85; 30/40; 35/40. The column temperature was 35∘C. Flow rate was 0.7 mL/ min. Injection volume was 10 𝜇L. The UV detection was performed at 248 nm.
Liquid chromatography–tandem mass spectrometry (LC-MS)
The LC-MS/MS analyses were conducted on Dionex UltiMate™ 3000 UHPLC-UV-DAD (Thermo Fisher Scientific, Waltham, MA, USA), interfaced with a linear ion-trap mass spectrometer (LTQ XL) equipped with a heated electrospray ionization source operating in the positive ionization mode. Instrument control and results processing was done using Dionex Chromeleon 7.2 (for HPLC-DAD analyses) and Thermo Xcalibur v2.2 SP1 (for HPLC-DAD/MS analyses). Structural confirmation and fragment elucidation was performed using Mass Frontier v7.0. Mass parameters were optimized as follows: ion source heater temperature was set at 300 °C and capillary temperature at 250 °C; capillary voltage was 49 V with collision energy 35 eV. Nitrogen was used as a nebulizing gas at a pressure of 50 psi and the flow was adjusted to 10 L/min. MS data were acquired in the positive ionization mode. The full scan covered the mass range at m/z 100–1200. Collision–induced fragmentation experiments were performed in the ion trap using helium as a collision gas, with a voltage ramping cycle from 0.3 up to 2 V. The maximum accumulation time of ion trap and the number of MS repetitions to obtain the MS average spectra were set at 500 ms and 3 ms, respectively.
Standard and sample preparation
Standard preparation
Standard solution of Rosuvastatin in final concentration of 0.001 mg/ml was used for quantitative determination. Standard solutions of all impurities were prepared individually Rosuvastatin Impurity B, and C in concentration of 0.005 mg/ml each and Rosuvastatin Impurity D, cis Rosuvastatin in concentration of 0.001 mg/ml each and in a mixture using ACN and water in ratio 50: 50 as solvent. 7.5 mg of “Rosuvastatin for peak identification “was dissolved in 5.0 mL solvent and used as system suitability solution. A mixture of acetonitrile and water at a ratio of 50:50 (v/v) was used as a diluent.
Sample preparation
In all experiments the concentration of Rosuvastatin in the sample solution was 1000 𝜇g/mL. Rosuvastatin was subjected to stress under acidic, alkaline, oxidative, thermal and photolytic conditions. In the preliminary experiments, rosuvastatin was subjected to 0.1 N HCI for one hour and 0.5 N NaOH for 48 h at ambient temperature (25 ± 2 °C). The oxidation stress was performed with a 3 % H2O2 solution for 48 h at ambient temperature (25 ± 2 °C). For thermal degradation, rosuvastatin was exposed at 60 °C for 10 days.
In accordance with the recommendations of the ICH Q1B guideline, photostability testing was performed using a Suntest CPS+ photostability chamber in combination with a SANYO MOV 212 oven (SANYO, Japan). Rosuvastatin samples were exposed to light providing a total illumination of not less than 1.2 million lux hours (7 h) and an integrated near ultraviolet (UV) energy of not less than 200 Wh/m² (3 h), followed by additional exposure to an increased light dose for 35 h. Additionally, a control study in the dark was run simultaneously.
Sample Preparation according to Full Factorial Design for Acid, Alkali, Oxidative, and Thermal Degradation.
The forced degradation experiments set-up based on 2n full factorial design was performed. The experiments were designed considering variables including time of exposure, temperature, and stressor strength at two levels. Acid and alkali degradation was performed using 23 factorial designs (three variables considered at two levels: 0.01M and 0.1M HCl/ NaOH heated at 25∘C and 40∘C for 15 and 45 min). Set-up of eight experiments for each stressor was conducted as described in Table 1. At the end of exposure, the samples were neutralized with appropriate amount of NaOH or HCl respectively (0.01M or 0.1M) and diluted to final concentration of 1000 𝜇g/mL with solvent.
Table 1: Experimental conditions and results from 23 full factorial design for acid, alkali and oxidative degradation.

aAberrations
x1 Stressor strength 0,01M and 0,1M HCl/ NaOH ; 3% and 30% H2O2; x2: Temperature 25 °C и 40 °C; x3: Time (min) 15 and 45; x4: Temperature(80 °C and 105 °C); x5: Time 180 and 300 minutes; y1: amount of Total Impurities obtained in acid degradation experiments (%); y2: amount of Total Impurities obtained in alkali degradation experiments (%); y3: amount of Total Impurities obtained in oxidative degradation experiments (%); y4: amount of Total Impurities obtained in thermal degradation experiments (%); The high level of each factor was considered as “+” and low level as “−”.
For oxidative degradation also three variables were considered at two levels (the high level for H2O2, temperature and time of exposure were 30%, 40∘C and 60 minutes, and the low levels were 3%, 25∘C and 15 minutes, respectively). 22 factorial designs were conducted to set up thermal degradation where the high-level values were 105∘C and 5 h and the low levels were 80∘C and 3 h, respectively. All stress studies were performed in amber glassware, in order to protect the solutions from light degradation and filtered thought 0.2 μm regenerated cellulose membrane filter. Several control samples were prepared for comparison with the stressed samples. Blank solutions consisting of stress agents were treated and analyzed in the same manner to mark the peaks corresponding to stress agents and to distinguish them from the potential degradation products. Additionally, the drug solution stored under normal conditions was analyzed.
Statistical Evaluation
The experimental design and statistical analysis of data for the optimization and robustness testing along with forced degradation sample preparation were performed with Design-Expert software, Version 7.0.0 (Stat-Ease, Inc., Minneapolis, MN, USA).
Acknowledgement
Experimental design is a robust analytical approach for the systematic evaluation of factor effects and for identifying optimal parameter settings to achieve predefined response characteristics. Its application enables an efficient balance between experimental cost and information gain while ensuring reliable estimation of optimal conditions necessary to achieve method quality and robustness. The experimental design strategy applied in this study involved the identification of critical variables and responses, selection of an appropriate experimental design, and development of a structured experimental plan. Initial screening of the most influential variables was conducted using one way analysis of variance (ANOVA) and Pareto charts, whereas optimization and definition of the design space were achieved through the evaluation of three-dimensional response surface plots. Preliminary experiments, together with a comprehensive literature survey summarized in Table 2, provided essential guidance for defining the experimental domain and establishing appropriate factor ranges. Based on this evaluation, stressor strength, exposure time, and temperature were identified as the critical factors to be systematically investigated.
Table 2:Summary of Literature Reported Forced Degradation Conditions for Rosuvastatin.

The selection of stressor type and concentration for acidic, alkaline, and oxidative degradation was guided by the outcomes of the preliminary studies and relevant literature reports (Table 2) [18-23]. Hydrochloric acid and sodium hydroxide at concentrations of 0.1 M and 1 M were selected as suitable reagents for hydrolytic degradation, while hydrogen peroxide at concentrations of 3% and 30% was employed to induce oxidative forced degradation.
The influence of temperature on acid, alkaline, and oxidative degradation of atorvastatin was investigated at two levels, 25 °C and 60 °C. Hydrolytic degradation is typically conducted at room temperature, and in cases where no significant degradation is observed, elevated temperatures are applied to accelerate the process. By employing an experimental design approach, the effect of temperature was evaluated simultaneously with other variables within a limited number of experiments. The exposure time was selected to obtain information on degradation occurring over a short duration; therefore, the low and high levels were set at 15 and 45 minutes, respectively. Thermal degradation studies were conducted at elevated temperatures in accordance with the general recommendations of the ICH guideline [9]. Accordingly, 80 °C was selected as the lower temperature level, while 105 °C was applied as the higher level, with exposure times of 3 and 5 hours.
Current regulatory guidance does not specify the initial concentration of the drug substance for forced degradation studies [9]. Literature reports recommend initial concentrations in the range of 0.1–1 mg/mL [1,3], and the European Pharmacopoeia monograph specifies a concentration of 1 mg/mL [23]. To ensure detection of minor degradation products and to avoid the need for additional
method validation, an initial concentration of 1 mg/mL was selected for all forced deg. In this study, the number of Total Impurities (%) was chosen as dependent variable. All samples were simultaneously evaluated with two independent methods. A mass spectrometry compatible HPLC method, as described above, was used to detect impurities and as a confirmation of the results obtained with the compendia method. A parallel comparison in the amounts determined by a compendia HPLC method and proposed LC/MS method was made. The model equations and statistical evaluation. The adequacy of the proposed experimental design was statistically evaluated using several criteria, including the coefficient of determination (R²), adjusted R², predicted R², and adequate precision. The statistical significance and relative contributions of linear effects, quadratic effects, and interactions between the studied parameters were assessed based on the magnitudes of the coefficients in the regression equations. The p-value was used as an indicator of the significance of each coefficient, with values less than 0.05 considered statistically significant.
The R² values presented in Table 3 indicate a good model fit, demonstrating that the developed models are suitable for prediction within the range of the investigated experimental variables (R² > 0.9 in all cases). The adjusted R² values, also exceeding 0.9 for all responses, reflect the proportion of variation in the predicted (newly generated) data and confirm the reliability of the models. The difference between adjusted R² and predicted R² values did not exceed 0.2 units, indicating excellent agreement and strong predictive capability. Evaluation of the results further revealed satisfactory values of adequate precision, ranging from 7.7 to 127.4, which confirms an adequate signal to noise ratio (values greater than 4 are considered acceptable) and sufficient model discrimination capability. The coefficient of variation was below 10%, confirming the satisfactory reproducibility of the selected experimental design. Based on the performed statistical analysis, it was concluded that the developed model is suitable for defining the experimental design space. Subsequently, the significance of the experimental factors was evaluated. This assessment was carried out by analyzing the coefficients of the second order linear polynomial presented in Table 3.
Table 3:ANOVA for 2n full factorial design for different type of degradation evaluating the % of Total Impurities.

aAberrations
The equation describing the model is:
y=b0+ b1x1+ b2 x2+ b3 x3+ b12 x1 x2+ b13 x1 x3+ b23 x2 x3+b123 x1 x2 x3
where y represents the response, xᵢ denotes the investigated factors, b₀ is the intercept, and b₁, b₂, b₃, b₁₂, b₂₃, b₁₃, and b₁₂₃ are the regression coefficients corresponding to the main effects and interaction terms.
x1 Stressor strength 0,01M and 0,1M HCl/ NaOH; 3% and 30% H2O2; x2: Temperature 25 °C и 40 °C; x3: Time (min) 15 and 45; x4: Temperature (80 °C and 105 °C); x5: Time 180 and 300 minutes
(%); y3: amount of Total Impurities obtained in oxidative degradation experiments (%); y4: amount of Total Impurities obtained in thermal degradation experiments (%);
Under acidic degradation conditions, the coefficients b₁ and b₃ indicate that hydrochloric acid concentration and exposure time exert a significant positive effect on degradation. The interaction coefficient b₁₃ further confirms the individual effects of these two factors. The positive sign of these coefficients implies that increasing the HCl concentration and prolonging the exposure time led to an increase in the number of formed impurities. Rosuvastatin exhibited negative values for the coefficients b₁ and b₃, corresponding to sodium hydroxide concentration and exposure time, respectively. Negative coefficient values indicate an inverse correlation between the investigated factors and the response variables. This observation is further supported by the positive sign of the interaction coefficient b₁₃.
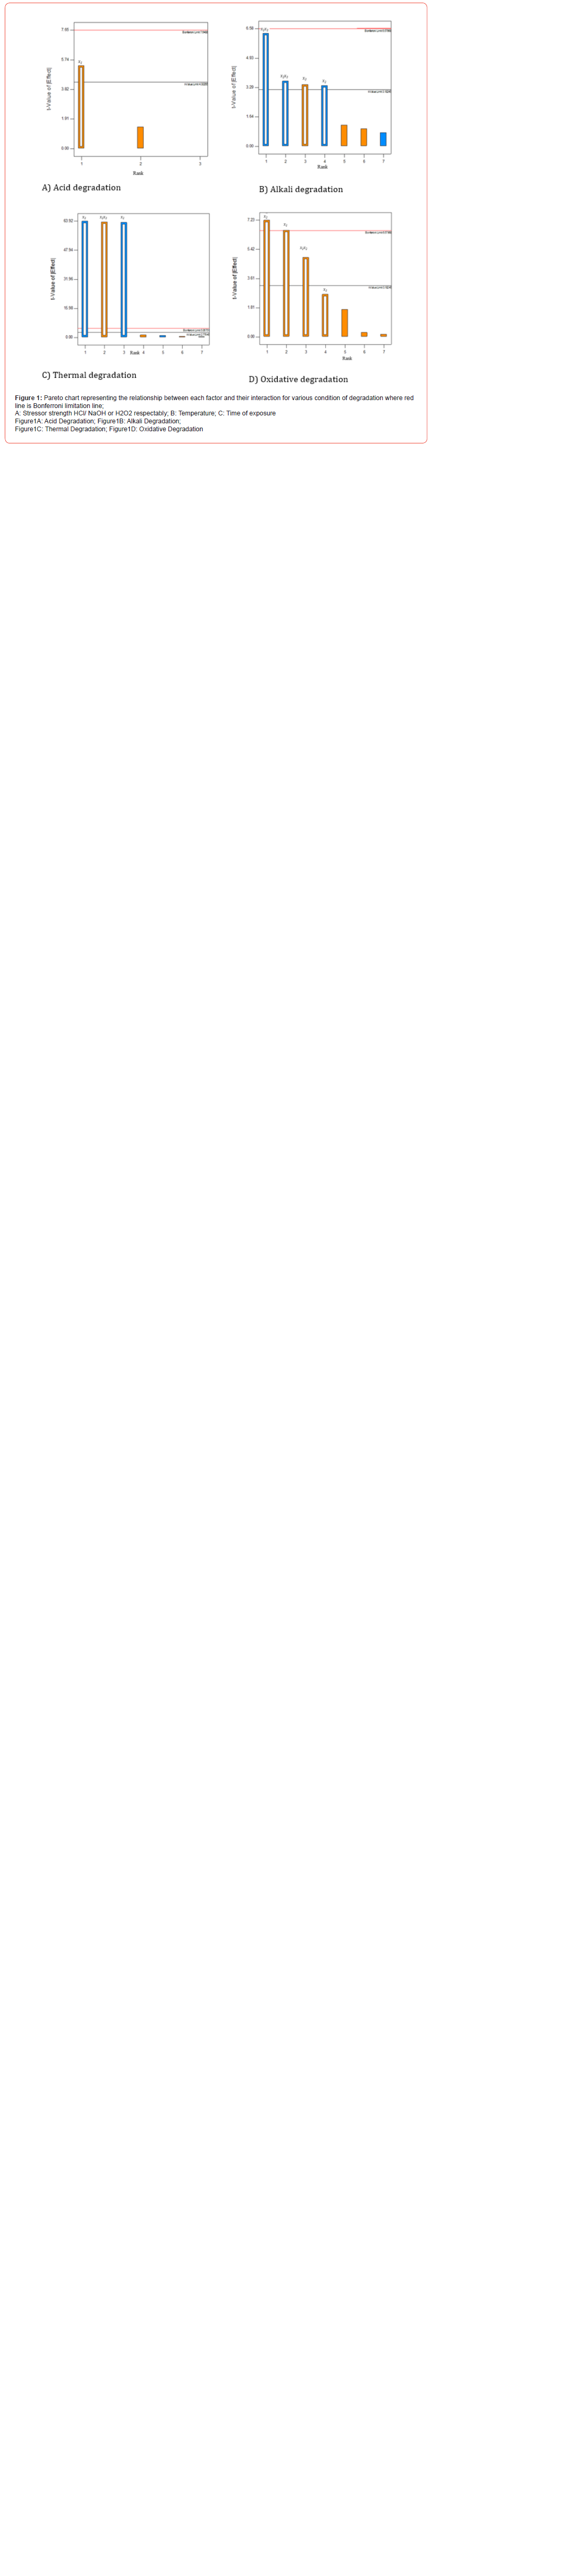
The results obtained from the oxidative degradation study indicate that temperature and exposure time are the most significant factors influencing degradation. As expected for thermal degradation, temperature exhibited the greatest effect. This behavior is consistent with chemical reaction kinetics, as rate constants show an exponential dependence on reaction temperature in accordance with the Arrhenius equation. A graphical representation of the regression coefficient values using Pareto charts is presented in Figure 1. The evaluation of factor effects, distinguishing statistically significant from insignificant contributions, was performed using the statistical to limit line. Effects exceeding the t value are considered statistically significant. Positive coefficient values are represented in orange, whereas negative coefficients are shown in blue. To enable rigorous interpretation and quantitative assessment of the relationships between independent variables and the response, three-dimensional (3D) response surface plots were constructed for each degradation condition (Figure 2).

The response surface for acidic degradation of rosuvastatin was generated by fixing the exposure time at its maximum level (Figure 2A). Analysis of the obtained results demonstrated that rosuvastatin is most susceptible to acidic degradation, which is influenced by all three investigated factors. The number of total impurities increased progressively with increasing stressor concentration and temperature. Furthermore, evaluation of the results revealed that the highest degradation levels were observed under acidic conditions, reaching approximately 50%. The response surface plot provides an informative presentation of the experimental data and enables comprehensive visualization of degradation behavior across a broader experimental region. Analysis of the response surface for alkaline degradation of rosuvastatin (Figure 2B) showed that degradation increased gradually with increasing sodium hydroxide concentration from 0.1 M to 1 M. Within the investigated experimental domain, the maximum percentage of total impurities obtained was approximately 9%.
The response surface for oxidative degradation of rosuvastatin was generated while maintaining the temperature at its minimum value (Figure 2 C). Evaluation of the results indicated that degradation increased progressively with increasing hydrogen peroxide concentration from 3% to 30% H₂O₂; however, within the studied experimental region, the maximum total impurity level did not exceed approximately 3%. Analysis of the response surface for thermal degradation showed that increasing the temperature from 80 °C to 105 °C significantly enhanced degradation, indicating that the combined effects of temperature and exposure time are positive. This suggests that prolonged exposure at 105 °C results in increased degradation. Nevertheless, under the investigated experimental conditions and within the defined design space, rosuvastatin exhibited good thermal stability. Photodegradation studies were initially performed using a conventional approach, resulting in approximately 1.49% degradation after exposure to ultraviolet light for seven days. An additional photodegradation study, described in Section 3.4.7, was subsequently conducted. Following 35 hours of exposure, the total impurity content increased to 24.40%.
The selection of optimal conditions was performed using a desirability function approach. The value of the desirability function depends on how the lower and upper limits are defined relative to the region of the actual optimum. The objective of the optimization is to identify a combination of experimental conditions that satisfies the predefined targets, without necessarily requiring a desirability value of 1.00. The desirability function represents a straightforward mathematical approach for locating the optimum, whereby adjustment of the relative importance (weighting on a scale from 1 to 5) assigned to each dependent variable (response) allows modulation of the resulting desirability value. When multiple factors and responses are considered simultaneously, all individual objectives are combined into a single overall desirability function, with the total desirability calculated from the individual desirability values of each response.
The selection of optimal conditions for acidic degradation of rosuvastatin was carried out using the desirability function, with the percentage of total impurities evaluated within the target range of 5–20%. In contrast, for alkaline degradation, the optimization criterion was based on achieving the maximum percentage of total impurities. Under oxidative and thermal stress conditions, rosuvastatin did not exhibit substantial degradation; therefore, optimization under these conditions was not performed. Based on the desirability plots shown in Figure 3, it can be concluded that the combinations of experimental parameters yielding high desirability values (D_HCl = 0.975 and D_NaOH = 0.986) were 1 M HCl at 25 °C for 15 min (Figure 3A) and 0.1 M NaOH at 25 °C for 15 min (Figure 3B), respectively. The optimized conditions were subsequently selected for experimental verification. The predicted response values associated with these optimal conditions are summarized in Table 4. Comparison between obtained and predicted results was made and noticeable difference was not clearly observed (Table 4). The results of the experiments confirmed that the chosen model was adequate for reflecting the expected optimization. Good predictability of the desirability plot provides valuable information about proposed methodology, saving considerable amounts of chemicals and experimental time.

Table 4:Comparison of experimental and predictive values of different responses under optimal conditions.
Predicted Error = (Obtained values – Predicted)/Predicted*100 BDL- Below disregard limit (0.05%); NA-Not applicable
Conclusion
The proposed methodology offers a systematic, efficient, and regulatory relevant approach for establishing optimal forced degradation conditions. The application of a full factorial design enabled the development of empirical models that reliably describe and predict degradation behavior across the investigated parameter space. The strong agreement between experimental and predicted results demonstrates the robustness, reproducibility, and suitability of the approach for controlled degradation studies. By enabling rational selection and optimization of stress conditions, this experimental design-based strategy addresses key regulatory expectations for scientifically justified forced degradation studies and supports the development of stability indicating methods. Consequently, the proposed methodology represents a viable and knowledge driven alternative to conventional trial and error practices, contributing to improved method understanding, reduced experimental burden, and enhanced compliance with current regulatory guidelines.
The application of experimental design for determining theoretical optimum degradation conditions proved effective, as the experimentally obtained results closely matched the predicted responses when the optimized parameters were implemented in practice. A key advantage of the proposed methodology lies in the simplicity of sample preparation, as analyses were performed directly on liquid samples without additional processing steps, while achieving the desired level of degradation using a minimal number of experimental trials. Overall, the integration of experimental design into the optimization of forced degradation studies enhances data quality, reduces experimental workload, and significantly lowers analytical costs, supporting its value as a robust and efficient alternative to conventional methodologies.
Acknowledgement
None.
Conflict of Interest
No conflict of interest.
References
- Singh S, Bakshi M (2000) Guidance on conduct of stress tests to determine inherent stability of drugs. Pharm Technol 4: 1-14.
- Klick S, Muijselaar PG, Waterval J, Eichinger T, Korn C, et al. (2005) Toward a generic approach for stress testing of drug substances and drug products. Pharm Technol (February): 48-66.
- Blessy M, Patel RD, Prajapati PN, Agrawal YK (2014) Development of forced degradation and stability indicating studies of drugs – A review. J Pharm Anal 4(3): 159-165.
- Sharma MK, Murugesan M (2017) Forced degradation study: An essential approach to develop stability indicating method. J Anal Bioanal Tech 8(1): 8-10.
- Singh S, Junwal M, Modhe G, Tiwari H, Kurmi M, et al. (2013) Forced degradation studies to assess the stability of drugs and products. TrAC Trends Anal Chem 49: 71-88.
- Bakshi M, Singh S (2002) Development of validated stability indicating assay methods: Critical review. J Pharm Biomed Anal 28(6): 1011-1040.
- Shete S, Dhale C, Joshi S (2014) Forced degradation study to stability indicating method. World J Pharm Pharm Sci 3(8): 863-873.
- Aneesh TP, Rajasekaran A (2012) Forced degradation studies: A tool for determination of stability in pharmaceutical dosage forms. Int J Biol Pharm Res 3(5): 699-702.
- ICH (2003) Stability testing of new drug substances and products Q1A(R2). Int Conf Harmon: 1-24.
- Singh R, Rehman Z (2012) Current trends in forced degradation study for pharmaceutical product development. J Pharm Educ Res 3(1): 54-64.
- Swarbrick J, Augsburger LL, Brittain HG, Hickey AJ, Hill C (2005) Pharmaceutical stress testing. Drugs Pharm Sci: 1-496.
- Lundstedt T, Seifert E, Abramo L, Thelin B, Nyström Å, et al. (1998) Experimental design and optimization. Chemom Intell Lab Syst 42(1-2): 3-40.
- Kurmi M, Kumar S, Singh B, Singh S (2014) Implementation of design of experiments for optimization of forced degradation conditions and development of a stability indicating method for furosemide. J Pharm Biomed Anal 96: 135-143.
- Sonawane S, Gide P (2012) Application of experimental design for optimization of forced degradation and development of a validated stability indicating LC method for luliconazole. Arab J Chem 6(3): 1-9.
- Sonawane S, Gide P (2011) Optimization of forced degradation using experimental design and development of a stability indicating LC assay method for rebamipide. Sci Pharm 79(1): 85-96.
- Sonawane S, Gide P (2011) An experimental design approach for forced degradation studies and development of a stability indicating LC method for eplerenone. J Liq Chromatogr Relat Technol 34(17): 2020-2031.
- Sweetman SC (1999) Martindale: The complete drug reference. Pharm Press 32nd ed.: 1-2148.
- Hussain MI, Hasin F, Hossain MM, Mazumder MMU, Habib NA (2017) Forced degradation and stability indicating studies of pharmaceutical dosage form (rosuvastatin tablet). Eur J Biomed Pharm Sci 4(9): 116-119.
- Trivedi HK, Patel MC (2012) Development and validation of a stability indicating RP UPLC method for determination of rosuvastatin and related substances in pharmaceutical dosage form. Sci Pharm 80(2): 393-406.
- Mehta TN, Patel AK, Kulkarni GM, Suubbaiah G (2005) Determination of rosuvastatin in the presence of its degradation products by a stability indicating LC method. J AOAC Int 88(4): 1142-1147.
- Jana K (2024) Degradation estimation of rosuvastatin calcium in pharmaceutical tablet formulation. Int J Pharm Sci Res 17(5): 2455-2461.
- Borioni A, Mammone FR, Risoluti R, Panusa A, Pierini M, et al. (2023) Insight into the photolytic degradation products of rosuvastatin: Full chiral and structural elucidation and conversion kinetics. J Pharm Biomed Anal 236: 115636.
- Reddy GR, Reddy PR, Jyothi PS (2014) Development of a stability indicating stereoselective method for quantification of enantiomer and related substances in rosuvastatin calcium. Sci Pharm 83(2): 279-296.
- European Pharmacopoeia Rosuvastatin Ph Eur, Monograph.
-

This work is licensed under a Creative Commons Attribution-NonCommercial 4.0 International License.