 Research Article
Polyethylene Glycol-Based Solid Dispersions to Enhance Eprosartan Mesylate Dissolution and Bioavailability
Ismaiel A Tekko1,2*, Ola M Ali1, Taher Hatahet3 and Mustafa F Chehna1
1Drug Formulation and Clinical Studies Group, University of Aleppo, Syria
2School of Pharmacy, Queen`s UniversityBelfast, MBC Building, 97 Lisburn Road, Belfast, BT9 7BL, Northern Ireland, UK
3School of Pharmacy, AL Rasheed International University for Science and Technology, Syria
Ismaiel A Tekko, School of Pharmacy, Queen`s University Belfast, MBC Building, 97 Lisburn Road, Belfast, BT9 7BL, Northern Ireland, UK.
Received Date:October 31, 2019; Published Date: November 07, 2019
Abstract
Purpose: The aim of this study was to improve the dissolution of eprosartan mesylate (ESM) using solid dispersions (SDs). Various compositions of polyethylene glycol polymers (PEG) were tested in attempt to improve ESM bioavailability after oral administration.
Methods: ESM solid dispersions (SDs) were prepared (by solvent method) using mixtures of PEG 3350 or PEG 6000 at various drug-polymer ratios (1:1), (1:2), (1:3), (1:4), (1:5) w/w with or without Tween 80 added at 0.1% of drug weight. Physical mixtures (PMs) of drug and carriers were also prepared at same ratios and used. Drug solid dispersions and physical mixtures were characterized in terms of drug content and drug dissolution using USP II dissolution apparatus. Drug dissolution enhancement ratio (ER) from SD in comparison to the crude drug was calculated. Drug- polymer interactions were also evaluated using Differential Scanning Calorimetry (DSC) and Fourier transform infrared (FT-IR).
Results: The in vitro dissolution studies showed that SDs prepared using both polymers produced a remarkable improvement in drug dissolution which reached around 32% in comparison to the crude drug (p<0.05). The dissolution enhancement ratio was polymer-concentration dependent but up to a certain concentration and this varied according to the used polymer. Adding Tween 80 to the SD did not show further dissolution enhancement but reduced the required amount of the polymer to get the same dissolution enhancement. The DSC and FT-IR studies indicated that using SD resulted in transformation of drug from crystalline to amorphous form.
Conclusion: This study indicated that SD prepared by using both polymers i.e. PEG 3350 and PEG 6000 improved the in vitro dissolution of ESM remarkably which which could result in improving in improving the drug bioavailability, but further in vivo studies are required (Graphical Abstract).
Keywords: Eprosartan mesylate; Solid dispersions; Solvent method; PEG 3350; PEG 6000; Dissolution test
Introduction
Cardiovascular diseases are the cause of most mortalities worldwide with a staggering 17 million deaths per year [1]. One of these lifelong cardiovascular diseases is hypertension. Hypertension has a silent mode of progression which results in only one out of four hypertensive people to seek medical care [1]. Hypertension can be controlled by different therapeutic strategies using one or combination of drugs that acts like beta blocker, angiotensin-converting enzyme inhibitors or Angiotensin II receptors antagonists [2]. Eprosartan mesylate (ESM) is a potent antihypertension drug marketed as oral tablets (Teventen®). It acts by antagonising the Angiotensin II receptors, resulting in peripheral blood vessels wideness and blood pressure reduction [3]. The drug decreases sympathetic norepinephrine production which also results in blood pressure reduction as well [4]. The drug is not only well-tolerated but it also presents effective benefit in the secondary prevention of cerebrovascular events. ESM has a low potential for serious adverse events and has not been associated with any clinically significant drug interactions. All of these demonstrate ESM as a promising agent for solo or combination antihypertensive strategies [5]. The recommended daily starting and maintenance dose of ESM when used as monotherapy is 735.8 mg, equivalent to 600 mg Eprosartan, available as the commercial Teveten® 600 mg tablets. In parallel, ESM has low water solubility (< 0.1 mg/ml) and is classified as a Class II drug according to Biopharmaceutical Classification Systems (BCS). Considering the drug water-solubility value, the drug requires over 5 L of water to dissolve the total dose which consequently lead to low and variable oral bioavailability (approximately 13%) [6]. Furthermore, this is a relatively high dose and requires to be incorporated into large tablets which are less preferred in terms of patient compliance [7]. ESM successful formulation strategy needs to address drug solubility which is the rate-limiting step in drug bioavailability
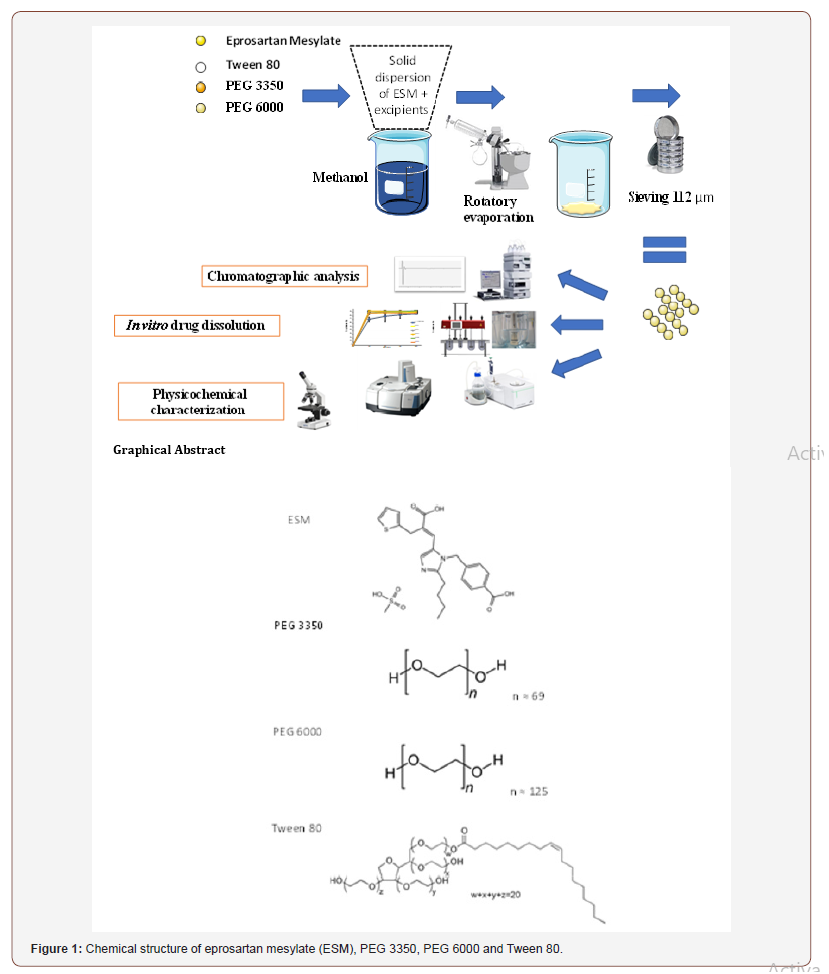
To overcome the issue problem of low oral bioavailability of ESM, efforts to increase its dissolution rate are needed. Several techniques have been proposed to increase the dissolution rate of poorly watersoluble drugs like salt formation, micronization [8], surfactants addition [9] and solid dispersions (SDs) [10]. SD method involves a dispersion of one or more active ingredients in an inner carrier or matrix in the solid state [11]. This method has many advantages like particle size reduction, improving wettability properties of the compound surface, and drug transformation into its amorphous form [12]. Various carriers have been employed including Polyethylene glycols (PEGs) [13,14], Poly(vinylpyrrolidone) (PVP) [15], Polyacrylate [16] etc. A further increase in drug solubility and dissolution can be achieved by the addition of inclusion surfactants such as Tween 80 in the formulation containing a polymeric carrier. This is attributed to the surfactant ability to prevent precipitation and/or protect a fine crystalline precipitate from agglomeration into much larger hydrophobic particles, thus enhancing the wettability of particles [11,17]. For these reasons, SD technique was selected as formulation strategy for ESM. Different methods have been proposed to prepare SD including fusion method, spray drying, lyophilization, supercritical fluid, and solvent method [18]. Solvent method was selected in this work for ESM solid dispersion formulation. SD prepared using PEG polymers mixtures (PEG 3350 and PEG 6000) with Tween 80 at certain ratios have been used successfully to enhance the solubility and dissolution rate of several molecules like Daidzein [17], Piroxicam [11], Silybin [13] and Norfloxacin [14]. However, these well studied polymeric combination have not been reported to enhance the dissolution rate of ESM. The objective of this study was to evaluate the potential of enhancing the dissolution rate of EMS with SD technique using two grades of PEG polymers; PEG 3350, PEG 6000. The PEGs were tested individually at various (drug: carrier) ratios or in combination with 0.1 %w/w Tween 80 of drug weight. Physical mixtures of the same carriers at the same ratios were also prepared and evaluated as controls. The chemical structure of ESM and carriers are presented in Figure 1. The prepared SDs were characterized in terms of their drug content, in vitro drug dissolution, thermal properties using differential scanning calorimetric (DSC) and drug-carrier molecular interactions using Fourier Transform Infrared Spectroscopy (FTIR). Also, formulations morphology was evaluated using a highresolution microscope and compared with the crude drug and its physical mixtures (Figure 1).
Materials and Methods
Eprosartan mesylate of pharmaceutical grade (batch no. EM0061010, purity 99%) was purchased from Andhra Pradesh, India. PEG 3350 and Tween 80 were purchased from Sigma-Aldrich, Germany. PEG 6000 from Sasol, Germany. Nylon filters (0.45 μm, 13 mm) obtained from Millipore, USA. All other used chemicals and solvents were of analytical grade and were provided from Sigma- Aldrich, Germany.
Preparation of solid dispersions (SDs)
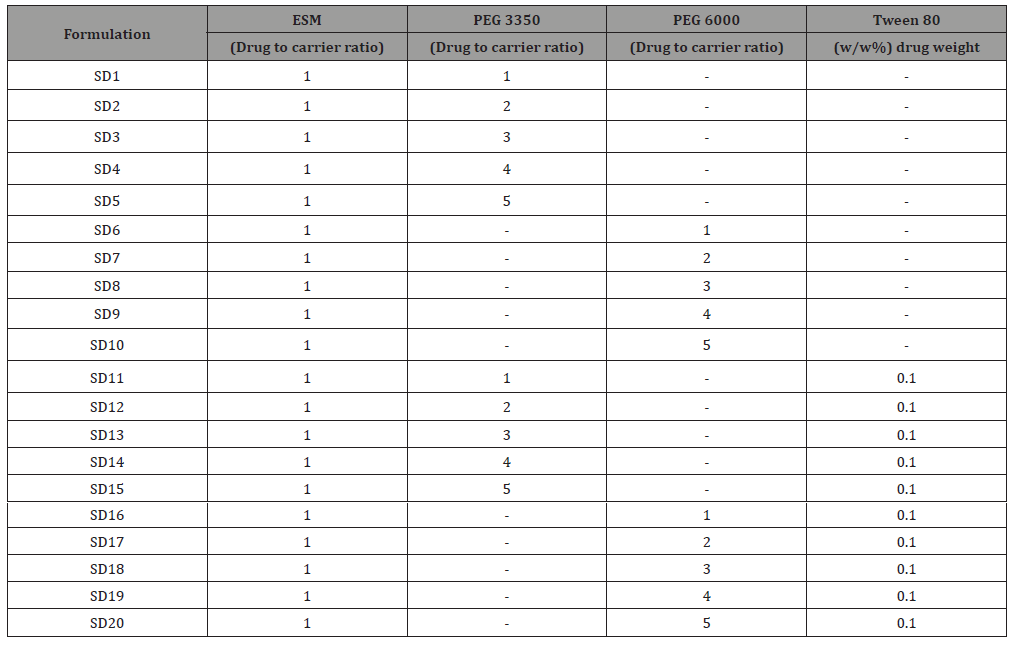
Solid dispersions of ESM (SD-ESM) were prepared by solvent method [19]. ESM, PEG 3350, PEG 6000 and Tween 80 were accurately weighed using Sartorius R180D analytical lab scale balance (Sartorius GmbH, Germany) and mixed according to Table 1. The mixtures were dissolved in an appropriate volume of methanol and acetone (25:75 v/v). Solvents were, then, evaporated at 45°C under reduced pressure using a Rotary Evaporator (Buchi 215 Rotavapor, Germany) operated at the speed of 100 rpm. The final obtained mass was cooled immediately using an ice bath and then pulverized and passed through a sieve with a pore size of 112 μm to produce the SDs. The SDs were left to dry for 48 hours at room temperature to remove residual solvents and then stored in airtight containers for further tests (Table 1).
Table 1: Composition of the various formulations of eprosartan mesylate solid dispersion (ESM-SD). PEG stands for polyethylene glycol.
Preparation of physical mixtures (PMs)
Physical mixtures having the same composition of solid dispersions were prepared by simply triturating and homogenizing the ESM drug with the polymers and Tween 80 in a porcelain mortar. The mixtures were then sieved with a sieve of pore size 112 μm and stored in airtight containers for further tests.
Eprosartan mesylate assay
A quantitative drug assay was carried out employing a developed and validated HPLC method from Patel and co-worker [20], using an apparatus of (HPLC LC 20 – AT, Shimadzu, Japan) equipped with DAD (SPDM20-A/D2 ) and auto-sampler, ODS column (RP C18, 5μ,ID: 250×4.5mm) housed at 25ºC. The mobile phase consisted of formic acid 0.5%: methanol: and acetonitrile (80:25:20 v/v/v) pumped at 1 ml/minute. ESM drug was detected at wavelength of 232 nm. ESM peak. The developed assay was checked for linearity, selectivity, precision, intermediate precision and accuracy.
Eprosartan mesylate formulation yield
The SD`s drug content was determined in triplicates by accurate weighing of amount equivalent to 50 mg of ESM. These samples were dissolved in 10 ml of methanol in stopper conical flasks. The sealed flasks were agitated on a rotary shaker for 1 hour. The solution was diluted with methanol, filtered and analysed for ESM content using the above described HPLC method. The yield of formulation was calculated using the following equation:

Where: Q weighed is the amount of drug weighed at the beginning of SD preparation. QHPLC is the amount of drug detected at the end of SD preparation.
In vitro dissolution
The In vitro dissolution studies were carried out for 1 hour in triplicate for crude ESM, PMs and SDs using Copley (Copley Scientific, UK) dissolution test apparatus Type II (Paddle) at rotation speed of 75 rpm. The dissolution medium was 1000 ml phosphate buffer 0.2M at pH=7.5. The temperature was maintained at 37±0.3°C throughout the study [21]. Predetermined weights of crude ESM, PMs and SDs equivalent to 300 mg of ESM were taken for test. At predetermined time intervals (0, 15, 30, 45 and 60 minutes), samples of (5 ml) were withdrawn and replaced with an equal amount of fresh dissolution medium. The withdrawn samples were filtered through 0.45 μm nylon filters and analysed by HPLC at 232 nm (method in section 2.3). Dissolution profiles were plotted as the mean percentage of released drug versus time. The percentage of dissolution enhancement percentage (DE%) was calculated using the following equation:

Where: QSD is the amount of drug released from its solid dispersion after 15 minutes of dissolution test commencing. QPD is the amount of drug released from its crude drug powder after 15 minutes of test dissolution test commencing.
Differential scanning calorimetry (DSC)
The thermal behaviour of crude ESM, empty carriers, PMs and SDs, were evaluated using differential scanning calorimetry (DSC, model PT10, Linseis, Germany). DSC measurements were performed at a heating rate of 10°C /min within a range of 25- 310°C using aluminium pans without seals. An empty aluminium pan was used as a reference. Samples of 3-10 mg of crude ESM, empty carriers, PMs, and SDs were accurately weighed, placed in aluminium pans and tested to determine melting point (Tm) for the crystalline form and Glass Transition Temperature (Tg) for amorphous form of ESM.
Fourier transform infrared spectroscopy (FT-IR)
The infrared spectra of crude ESM, empty carriers, PMs and SDs were recorded using FT-IR (Bruker, Germany) Samples were prepared using KBr disk method with around 5 mg of sample mixed with KBr at 2%, the scanning was performed between 400 to 4000 cm-1. OPUS Spectroscopy Software was used for the normalization and treatment of the obtained spectra.
Microscopic studies
A sample of SDs prepared with PEG3350 in ratio (1:2) was taken to study the shapes and diameters of SDs using Olympus CX31 (Olympus Corporation, Japan) photos were compared to those of crude ESM.
Statistical analysis
One Way Analysis of Variance (ANOVA) was used to determine the presence of any significant differences in dissolution rates (p<0.05) among the test groups. All other figures were created using Microsoft Excel 365 software (Microsoft, USA).
Results and Discussion
Eprosartan mesylate assay
HPLC is the method choice for the quantification of active substances in formulation due to its ability to separate excipients by chromatography [22]. The developed method was selective for ESM in the presence of other SD formulation excipients and the retention time for ESM was 15.8 minutes. The method was linear for ESM over a concentration range from 10 to 200 μg/ml with a correlation coefficient of r2=0.99999. Table 2 shows the precision of the method with RSD% of less than 1.5% recorded at all tested concentrations (n=3). The intra-day and inter-day precision was also established and all RSD% values were less than 1.5%. Finally, method accuracy was investigated by injecting a reference concentration of ESM and compared the results obtained to the true value Table 3. shows accuracy values, where the percentage yield falls in the range of 99.8 to 101.0 %. Based on the below data, the developed HPLC method can be regarded as a suitable method for ESM analysis in the subsequent steps of the study (Table 2,3 and Figure 2).
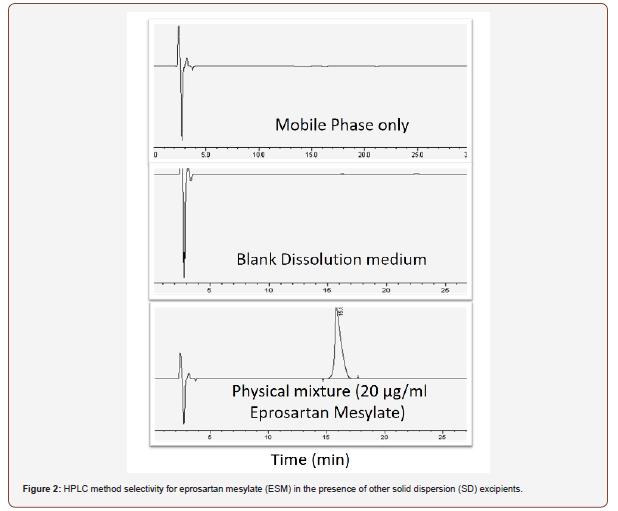
Table 2: Intra-day and Inter-day precision values for eprosartan mesylate HPLC detection method. Data reported as mean ± SD (n=3).

Table 3: Accuracy values for eprosartan mesylate HPLC detection method. Data reported as mean ± SD (n=3).

Eprosartan mesylate formulation yield
ESM was successfully formulated in different SDs, the drug content of formulations was found to be in the range (94 -102 %) by HPLC method (section 2.3 and 3.1). Thus, the proposed solvent method which was used to prepare the SDs in this study appears to be a good and reproducible method to prepare a stable and homogenized SDs.
In vitro dissolution studies
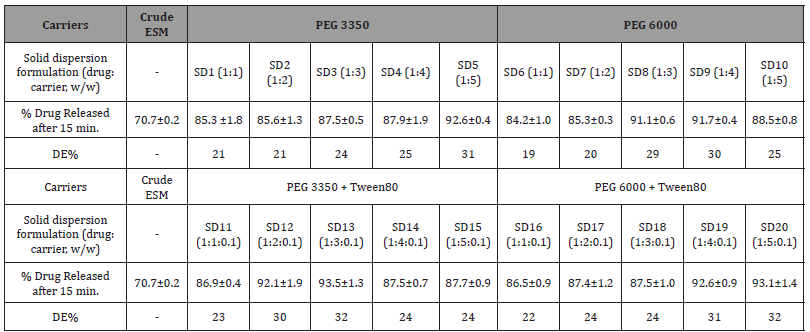
Dissolution profiles of the solid dispersions of ESM prepared with either PEG3350 or PEG 6000 alone and in combination with Tween 80 added at constant concentration (0.1%, w/w) in relation to the drug itself are shown in Figure 3. In vitro dissolution test exhibited a considerable improvement in the amount of released drug from solid dispersions in comparison to that from crude drug in the dissolution medium used (p<0.05). The percentage of released drug after 15 minutes from dissolution testing of the crude ESM and its SDs and the enhancement ratios (ER) are shown in (Table 4). The percentage of released drug from the crude drug was around 70% of the dose after 15 minutes and 86% after 60 minutes of the dissolution testing (Figure 3a). Applying the solid dispersion technique using polymers of PEG 3350 or PEG 6000 lead to a significant dissolution enhancement ranged between 19.5% and 31% in comparison to that from the crude drug (p<0.05) (Figure 3a,3b). Using PEG 3350 and PEG 6000 polymer as carriers in ESM-SD enhanced ESM dissolution rate independent of polymer ratio (p>0.05). Within the first 15 minutes of the study. The highest dissolution enhancement ratio was obtained at (drug: carrier) of 1:5 and with PEG 3350 and was 31%, while the lowest was 19% and was observed with PEG 6000 at drug: carrier ratio of 1:1. After one hour in the dissolution medium, more than 90% of ESM was released from all formulations indicating a complete drug release. The SD 20 formulation with PEG 6000 and Tween 80 enabled the highest drug release with highest dissolution enhancement percentage of 40% (Figure 3d). This can be brought back to the reduction of particle size and the increase of formulation wettability by the addition of Tween 80 [12,23]. Surprisingly, the lowest DE% (24%) was observed with SD 15 which differs from SD 20 only by the grade of PEG used (3350 with SD 15 and 600 with SD 20). In general, SDs formulated with PEG 6000 and Tween 80 showed the fastest and the highest dissolution rate for ESM (Figure 3 and Table 4).
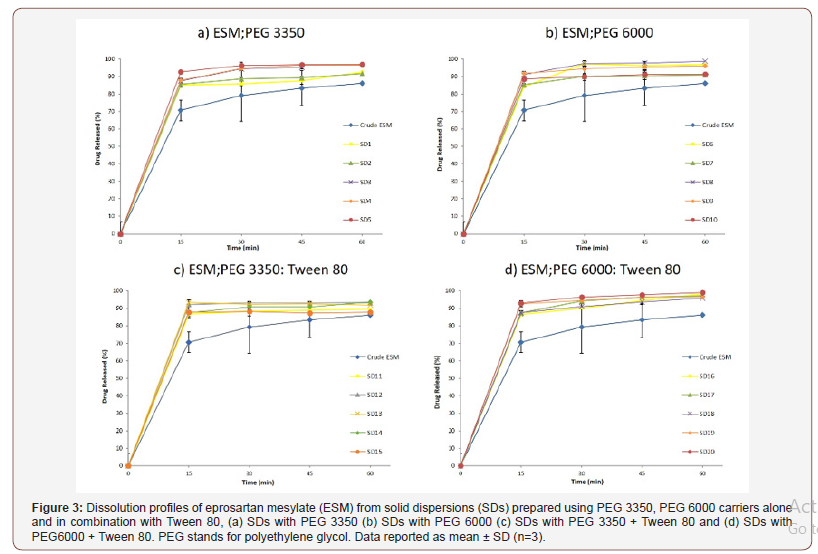
Table 4: In vitro drug release of eprosartan mesylate (ESM) from solid dispersions (SDs) prepared with PEG 3350, PEG 6000 with or without Tween 80 in the first 15 minutes of dissolution testing. DE% stands for dissolution enhancement percentage and PEG stands for polyethylene glycol. Data reported as mean ± SD (n=3).
Differential scanning calorimetry (DSC) studies
The molecular interactions between the drug and the polymers used in preparation of the solid dispersions are evaluated by conducting a thermal analysis on the fabricated solid dispersions using DSC. Thermograms of crude ESM and ESM-SDs are shown in Figure 4. The thermograms of crude Eprosartan Mesylate (ESM) and its solid dispersions (SDs) with PEG 3350 and PEG 6000 alone and in combination with Tween 80: (a) SDs with PEG3350 (b) SDs with PEG 6000 (C) SDs with PEG 3350 + Tween 80 and (d) SDs with PEG 6000 + Tween 80. PEG stands for polyethylene glycol (Figure 4).
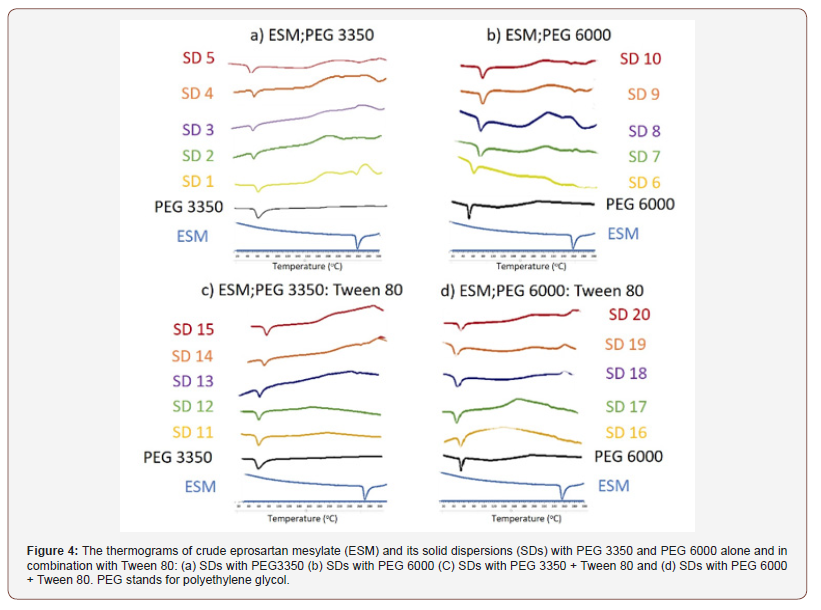
Thermal study of SDs prepared with PEG 3350: The thermal study of ESM and PEG3350 are presented in Figure 4a. The thermogram of ESM showed a sharp endothermic peak at 256°C corresponding to the melting point of the drug [24]. Regarding SDs prepared with PEG3350, a wide peak appeared around 60°C which is the melting point of PEG 3350 [25]. Physical mixtures thermograms exhibited both the drug and the polymer peaks, but broadened ones with reduced intensity Figure 4a. This could be attributed to the complete miscibility of molten drug in the polymer, as a result of homogeneous distribution of drug in the surface of the polymer [26]. With PEG 3350 SDs, only formulation with ratio of (1:1) showed a small peak at 247°C. and this can be explained by part of ESM is still in a crystalline form [27]. Whereas all other thermograms of PEG 3350 SDs showed only the peak of PEG3350 with the absence of ESM peak. This indicates that the whole drug has changed to amorphous form [28].
Thermal study of SDs prepared with PEG 6000: Thermograms of SDs of ESM prepared with PEG6000 are presented in (Figure 4b). PEG 6000 thermograms show and endothermic peak at around 70°C which is also observed elsewhere and attributed to the oxidation of PEG 6000 [29]. SDs thermograms showed the presence of PEG 6000 peaks and a very small peak related to the melting point of ESM and shifted towards lower temperatures. This peak is clearly observed in the curve of SD (1:1) at 251°C (Figure 4b). This could be explained by some amount of ESM still in crystalline form and not molecularly dispersed in the polymer matrix [30].
Thermal effect of Tween 80 addition to SDs prepared with PEG 3350 and EPG 6000: For SDs prepared from ESM mixed with PEG 3350: Tween 80 (Figure 4c). and PEG 6000: Tween (Figure 4d). respectively. The DSC studies showed that the thermal behaviour of a PEG-Tween 80 mixture is similar to that of the PEG`s alone in SDs formulations. This is a further confirmation to what was observed by Morris et al, that Tween 80 up to 50% doesn’t influence PEG melting point and Tween 80 is incorporated into the amorphous region of PEG solid structure [31]. ESM peaks were absent from the thermograms of ESM-SDs which indicates that the drug has been transformed into amorphous form with SDs [28].
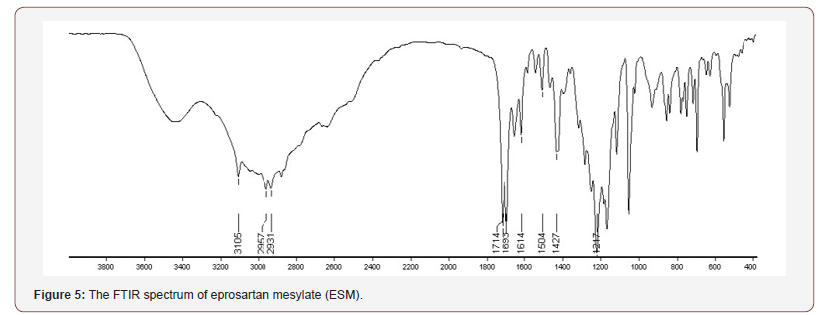
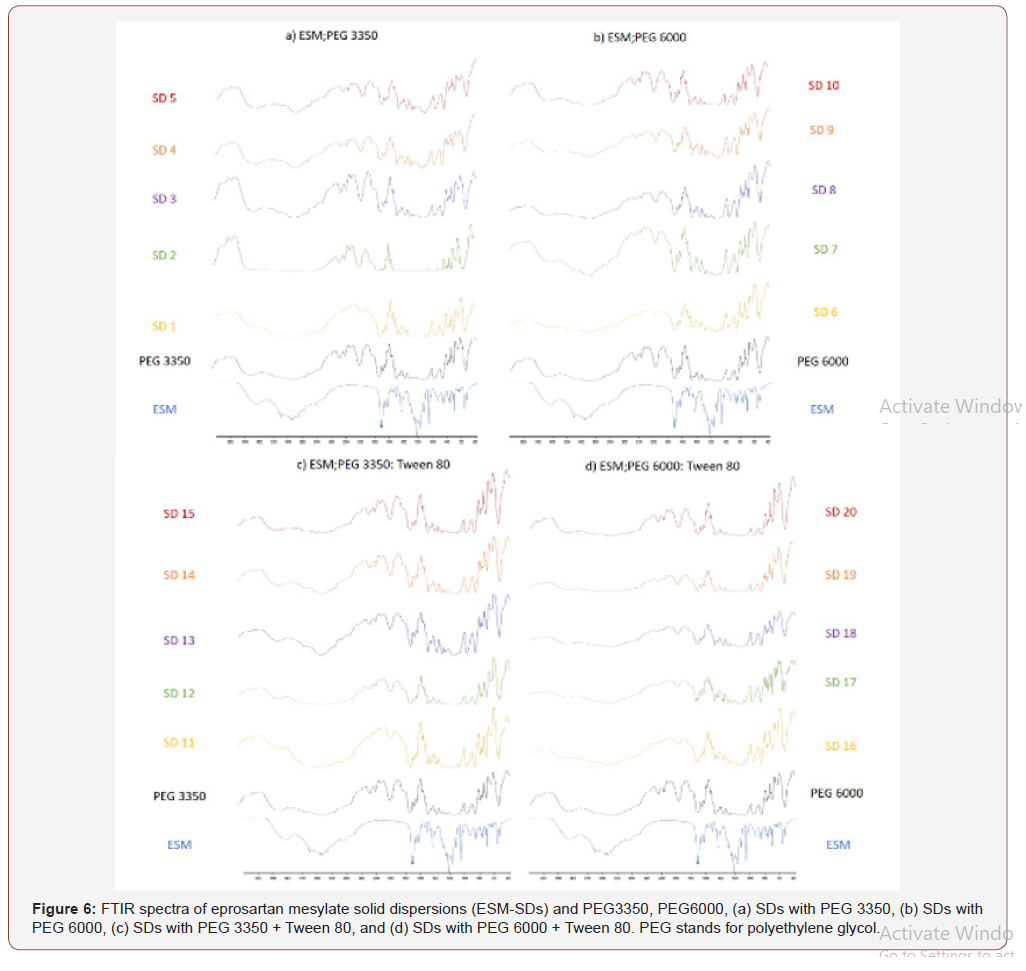
FTIR spectroscopy was carried out to further elucidate the interaction between ESM and the carriers in the SDs. The FTIR spectrum of crude ESM is shown in (Figure 5), ESM has three characteristic bands for the OH groups which were found at 2931, 2957 and 3105 cm−1. The peaks corresponding to two CO groups are found at 1693 and 1714 cm−1. The peak for the SO2 group appeared at 1217 cm−1. The peaks come in agreement to previous reports on ESM IR spectrum [32]. The ESM-SDs (1 to 20) are shown in (Figure 6), the spectra of PEG3350, and PEG6000 are similar due to their similar structure and exhibited a broad OH stretching vibration from 3200 to 3650 cm−1 (Figure 1,6a,6b). The peaks obtained with our sample are different from previously reported [33,34]. This can be explained by the source of PEG, the machine type, preparation method of sample and residual and impurities found in PEG [35]. In the spectra of SDs the absorption bands of OH groups were changed or disappeared. It could be attributed to hydrogen bonds formed between the OH groups of ESM and the oxygen atoms in the polymers [36]. In addition, a broadening of transmittance occurred also for CO and SO2 groups in ESM (Figure 1). These observations might indicate the presence of hydrogen bonds between the drug and the carriers resulting in reducing in drug recrystallization [37], these types of hydrogen bond extending the stability of the amorphous form of Griseofulvin in the solid dispersions [38]. It is worth noting that previous report on ESMSD prepared with polyvinyl alcohol (PVP K 30) as carrier did not show any interaction between ESM and PVP [32]. The addition of Tween 80 to SDs did not show any clear change in the recorded FTIR spectra (Figure 6c,6d) when compared to SDs without Tween 80 (Figure 6a,6b). The broadening of some of ESM characteristics peaks and the absence of others in SDs formation suggest that ESM is in its amorphous state with the solid dispersion. the amorphous form of ESM presents a higher dissolution ability than the crude drug [24] (Figure 5,6).
Microscopic studies
The higher in vitro dissolution rate of ESM from SD can also be attributed to the lower particle size obtained for ESM after incorporation into SDs. Microscopic images of crude ESM and ESM-SD 2 proofed the reduction of particle size of ESM in the SD compared to crude form (Figure 7a,7b). The lower particle size leads to higher surface area and higher dissolution rate according to Noyes–Whitney equation [39], (Figure 7).

Conclusion
Eprosartan mesylate, a hypotensive agent, suffers from poor water solubility and reduced oral bioavailability. The present study investigates solid dispersions of eprosartan mesylate prepared with the water-soluble carriers PEG 3350, PEG 6000 individually and in combination with Tween 80 using solvent evaporation method. The use of solid dispersion strategy showed significant increase in vitro dissolution rate of eprosartan mesylate. All formulations doubled the release rate of eprosartan mesylate compared to the crude drug within the first 15 minutes of the study. At the end of the in vitro dissolution study, the released eprosartan mesylate was 10% higher in SDs prepared with PEG 6000 and Tween 80 than crude drug. This observation could be interpreted by the amorphous nature of eprosartan mesylate inside solid dispersion formulations confirmed by FTIR studies and the increased wettability of formulation by the addition of Tween 80 and the hydrophilic polymer (PEG). Also, microscopic images showed a decrease in particle size between the crude drug and the solid dispersion which increased the surface area between the formulation and the dissolution medium and lead to an enhanced drug release rate. This formulation strategy can be used to improve the oral bioavailability of eprosartan mesylate. Further studies are required to define the correlation between the observed in vitro results and the in vivo situation.
Acknowledgment
The authors acknowledge the Research Council at Aleppo University for the financial support of this study.
Conflict of Interest
The authors declare no conflict of interest.
References
- WHO (2018) Cardiovascular diseases (CVDs). http://www.who.int/cardiovascular_diseases/en/.
- K Whalen (2015) Lippincott Illustrated Reviews: Pharmacology.
- O Rourke, Martindale (2010) The Complete Drug Reference. Am J Heal Pharm.
- De La Sierra, CVS Ram (2007) Introduction: The pharmacological profile of eprosartan--implications for cerebrovascular and cardiovascular risk reduction. Curr Med Res Opin 23(5): S1-S3.
- Abbott Laboratorie (2012) Teveten (Abbott Laboratories): FDA Package Insert, Teveten.
- D Tenero, D Martin, B Ilson, J Jushchyshyn, S Boike, et al. (1998) Pharmacokinetics of intravenously and orally administered eprosartan in healthy males: Absolute bioavailability and effect of food. Biopharm Drug Dispos 19(6): 351-356.
- JS Ahn, KM Kim, CY Ko, JS Kang (2011) Absorption enhancer and polymer (Vitamin e TPGS and PVP K29) by solid dispersion improve dissolution and bioavailability of eprosartan mesylate. Bull Korean Chem Soc 32(5): 1587-1592.
- KT Savjani, AK Gajjar, JK Savjani (2012) Drug solubility: importance and enhancement techniques. ISRN Pharm 2012.
- Kovačič, F Vrečer, O Planinšek (2012) Spherical crystallization of drugs. Acta Pharm 62(1): 1-14.
- T Patel, LD Patel, T Patel, S Makwana, T Patel (2010) Enhancement of dissolution of Fenofibrate by solid dispersion technique. Int J Res Pharm Sci 1(2): 127-132.
- KE Wu, J Li, W Wang, DA Winstead (2009) Formation and characterization of solid dispersions of piroxicam and polyvinylpyrrolidone using spray drying and precipitation with compressed antisolvent. J Pharm Sci 98(7): 2422-2431.
- Leuner C, J Dressman (2000) Improving drug solubility for oral delivery using solid dispersions. Eur J Pharm Biopharm 50(1): 47-60.
- WW Yao, TC Bai, JP Sun, CW Zhu, J Hu, et al. (2005) Thermodynamic properties for the system of silybin and poly (ethylene glycol) 6000. Thermochim Acta 437(1): 17-20.
- M Guyot, F Fawaz, J Bildet, F Bonini, AM Lagueny (1995) Physicochemical characterization and dissolution of norfloxacin/cyclodextrin inclusion compounds and PEG solid dispersions. Int J Pharm 123(1): 53-63.
- M Vasanthavada, WQ Tong, Y Joshi, MS Kislalioglu (2005) Phase behavior of amorphous molecular dispersions II: Role of hydrogen bonding in solid solubility and phase separation kinetics. Pharm Res 22(3): 440-448.
- H Suzuki, N Miyamoto, T Masada, E Hayakawa, K Ito (1996) Solid dispersions of benidipine hydrochloride. I. Preparations using different solvent systems and dissolution properties. Chem Pharm Bull 44 (2) 364-371.
- L Hu, N Zhang, G Yang, J Zhang (2014) Effects of Tween-80 on the Dissolution Properties of Daidzein Solid Dispersion in Vitro. Int J Chem.
- K Dhirendra, S Lewis, N Udupa, K Atin (2009) Solid dispersions: a review. Pak J Pharm Sci 22 (2) 234-246.
- T Tachibana, A Nakamura (1965) A methode for preparing an aqueous colloidal dispersion of organic materials by using water-soluble polymers: Dispersion of Β-carotene by polyvinylpyrrolidone. Kolloid Zeitschrift Zeitschrift Für Polym 203(2): 130-133.
- HU Patel, BN Suhagia, CN Patel (2010) Development and validation of a high-performance liquid chromatographic method for determination of eprosartan in bulk drug and tablets. J AOAC Int 93(6): 1862-1867.
- JS Bhandaru, N Malothu, RR Akkinepally (2015) Characterization and solubility studies of pharmaceutical cocrystals of eprosartan mesylate. Cryst Growth Des 15 (3): 1173-1179.
- B Nikolin, B Imamović, S Medanhodzić Vuk, M Sober (2004) High perfomance liquid chromatography in pharmaceutical analyses. Bosn J Basic Med Sci 4(2): 5-9.
- Karavas, G Ktistis, A Xenakis, E Georgarakis (2006) Effect of hydrogen bonding interactions on the release mechanism of felodipine from nanodispersions with polyvinylpyrrolidone. Eur J Pharm Biopharm 63(2): 103-114.
- Crasto, S Naik, N Joshi, M Khan (2008) Amorphous eprosartan mesylate and process for the preparation thereof.
- H Hsu, MT Harris, S Toth, GJ Simpson (2015) Drop printing of pharmaceuticals: Effect of molecular weight on PEG coated‐naproxen/PEG 3350 solid dispersions. AIChE J 61 (2): 4502-4508.
- Sharma, CP Jain (2010) Preparation and characterization of solid dispersions of carvedilol with PVP K30. Res Pharm Sci 5(1): 49-56.
- Choudhary, S Kumar, GD Gupta (2014) Enhancement of solubility and dissolution of glipizide by solid dispersion (kneading) technique. Asian J Pharm 3(3).
- Chauhan, S Shimpi, A Paradkar (2005) Preparation and evaluation of glibenclamide-polyglycolized glycerides solid dispersions with silicon dioxide by spray drying technique. Eur J Pharm Sci 26(2): 219-230.
- Arias, J Moyano, J Ginés (1998) Study by DSC and HSM of the oxazepam-PEG 6000 and oxazepam-D-mannitol systems: Application to the preparation of solid dispersions. Thermochim Acta 321(1-2): 33-41.
- X Wang, A Michoel, G Van Den Mooter (2004) Study of the phase behavior of polyethylene glycol 6000-itraconazole solid dispersions using DSC. Int J Pharm 272(1-2): 181-187.
- KR Morris, GT Knipp, ATM Serajuddin (1992) Structural properties of polyethylene glycol—polysorbate 80 mixture, a solid dispersion vehicle. J Pharm Sci 81(12): 1185-1188.
- PV Dangre, MD Godbole, PV Ingale, DK Mahapatra (2016) Improved dissolution and bioavailability of eprosartan mesylate formulated as solid dispersions using conventional methods. Indian J Pharm Educ Res 50(3): 209-217.
- Reddy Polu, R Kumar (2012) Impedance Spectroscopy and FTIR Studies of PEG - Based Polymer Electrolytes. E Journal Chem 8(1): 347-353.
- K Shameli, M Bin Ahmad, SD Jazayeri, S Sedaghat, P Shabanzadeh, et al. (2012) Synthesis and characterization of polyethylene glycol mediated silver nanoparticles by the green method. Int J Mol Sci 13(6): 6639-6650.
- KM Mc Namara, BE Scruggs, KK Gleason (1994) The effect of impurities on the IR absorption of chemically vapor deposited diamond. Thin Solid Films 253(1-2): 157-161.
- LP Ruan, BY Yu, GM Fu, DN Zhu (2005) Improving the solubility of ampelopsin by solid dispersions and inclusion complexes. J Pharm Biomed Anal 38(3): 457-464.
- R Kalaiselvan, GP Mohanta, PK Manna, R Manavalan (2006) Studies on mechanism of enhanced dissolution of albendazole solid dispersions with crystalline carriers. Indian J Pharm Sci 68 (5): 599-607.
- H Al Obaidi, G Buckton (2009) Evaluation of Griseofulvin Binary and Ternary Solid Dispersions with HPMCAS. AAPS PharmSciTech 10(4): 1172-1177.
- M Mosharraf, C Nyström (1995) The effect of particle size and shape on the surface specific dissolution rate of microsized practically insoluble drugs. Int J Pharm 122(1-2): 35-47.
-
Ismaiel A Tekko, Ola M Ali, Taher Hatahet, Mustafa F Chehna. Polyethylene Glycol-Based Solid Dispersions to Enhance Eprosartan Mesylate Dissolution and Bioavailability. Arch Phar & Pharmacol Res. 2(3): 2019. APPR.MS.ID.000537.
-
Eprosartan mesylate, Solid dispersions, Solvent method, PEG 3350, PEG 6000, Dissolution test, Hypertension, Norepinephrine, Biopharmaceutical classification systems, Micronization, Solid dispersions, Surfactants addition, Agglomeration.
-

This work is licensed under a Creative Commons Attribution-NonCommercial 4.0 International License.


