 Research Article
Evaluation of 2012/2013 Public Health Recommendations for Hepatitis C Testing Using Multiple Data Sources
William W Thompson1*, Lauren Canary1, Jay Soh1,2, Mohammed Khan1,3, Jane Sullivan4, Ade Osinubi1, Aaron M Harris1, Harvey W Kaufman5, John W Ward1,6, Carolyn Wester1, Claudia Vellozzi1 and Noele P Nelson1
1Division of Viral Hepatitis, National Center for HIV/AIDS, Viral Hepatitis, STD, and TB Prevention, Centers for Disease Control and Prevention, Atlanta, GA
2Department of Biostatistics and Bioinformatics, Rollins School of Public Health, Emory University, Atlanta, GA
3Department of Epidemiology and Laney Graduate School, Emory University, Atlanta, GA
4OptumLabs, 11000 Optum Circle, Eden Prairie, MN
5Quest Diagnostics, 500 Plaza Drive, Secaucus, NJ 07904
6Coalition for Global Hepatitis Elimination, Task Force for Global Health, Decatur GA, 30030
William W Thompson, U.S. Centers for Disease Control and Prevention, Atlanta, Georgia
Received Date: April 16, 2024; Published Date: July 09, 2024
Abstract
Objective: Using medical claims, laboratory test orders and self-reported survey data, examine the impact of the CDC’s 2012 and USPSTF’s 2013 public health recommendations for hepatitis C testing between 2011 through 2017.
Data Sources and Study Setting: Commercial claims data were obtained from IBM Health Truven Market Scan® and Optum Labs® Data Warehouse. Laboratory data were obtained from Quest Diagnostics and LabCorp. Self-reported HCV testing was obtained from the National Health Interview Survey (NHIS).
Study Design: Using multiple data sources, evaluate the recommendations for one-time hepatitis C testing. Hepatitis C testing rates were estimated by year and birth cohort from 2011 through 2017.
Data Collection: Markets can and Optum labs medical claims data were restricted to adults with commercial claims and continuous enrollment in a given calendar year. Laboratory data and the NHIS data were restricted to adults.
Principal Findings: Hepatitis C testing rates increased significantly from 2011 through 2017 among the 1945-1965 birth cohort with a sharper increase in 2017 relative to the other two cohorts. Annual testing rates among the birth cohort increased from 1.70% [95% CI 1.69-1.71] to 8.06% [95% CI 8.04-8.08] using IBM Health Truven Market Scan®, 1.71% [95% CI 1.70-1.73] to 8.55% [95% CI 8.52-8.58] using Optum Labs®, and 2.97% [95% CI 2.95-2.97] to 7.09% [95% CI 7.08-7.10] using laboratory data between 2011 and 2017. Rates of self-reported hepatitis C testing (ever tested) among baby boomers increased from 12.27% [95% CI 11.47-13.07] to 17.33% [95% CI 16.34-18.33] between 2013 and 2017. Self-reported HCV testing rates were substantially lower than cumulative annual testing rates obtained from the medical claims and laboratory tests.
Conclusions: Medical claims and laboratory data appear to be more reliable for assessing the impact of public health recommendations relative to self-reported survey responses.
Keywords: Hepatitis C; Testing; Prevention; Birth Cohort; Recommendations
Introduction
Hepatitis C virus (HCV) infection is a leading cause of liverrelated morbidity and mortality in the United States. An estimated 3.2 million people were living with HCV infection based on the 1999-2002 National Health and Nutrition Examination Surveys (NHANES), and most chronic infections were among persons in the 1945-1965 birth cohort (baby boomers) [1], who were primarily exposed to HCV decades ago from contaminated blood products or from unsafe injection drug use [2] In response, in 2012 the Centers for Disease Control and Prevention (CDC) expanded risk-based hepatitis C testing recommendations to include a one-time HCV antibody test for all persons born during 1945-19652. In 2013, the U.S. Preventive Services Task Force (USPSTF) followed with recommendations for hepatitis C testing of persons at high risk for infection and a one-time test for adults born during 1945-1965 [3].
In 2016, approximately 2.4 million people were living with HCV infection, a slight decline likely due in part to increased testing and treatment among the 1945-1965 birth cohort [4,5]. However, despite the availability of direct-acting antivirals that can cure more than 90% of persons with chronic hepatitis C, among 2015-2018 NHANES participants aged ≥20 years who were HCV RNA-positive, 60.6% (95% CI 46.1%-73.9%) reported having been told that they had hepatitis C [6]. Persons in the 1945-1965 birth cohort remain at the highest risk for chronic HCV infection and death from hepatitis C-related causes. Hepatitis C-associated deaths have substantially increased in the last decade and hepatitis C was reported as the underlying or contributing cause for 15,713 deaths in 2018 [6,7] Furthermore, there has been a rapid increase in hepatitis C incidence since 2010 primarily due to an increase in persons injecting drugs likely related, in part, to the opioid crisis [7-11].
Hepatitis C testing and treatment is critical to prevent HCVrelated morbidity and mortality. Therefore, understanding trends and socio-economic health disparities associated with testing are critical for identifying and implementing targeted interventions to increase the uptake of hepatitis C testing recommendations. In this study, we used multiple data sources including medical claims data, laboratory test orders and self-reported survey data to assess the impact of CDC’s 2012 and USPSTF’s 2013 recommendations for one-time hepatitis C testing of the birth cohort (i.e., those born from 1945 through 1965).
Methods
Study Design
An observational non-experimental study design using secondary data sources was carried out using data sources available annually from 2011 through 2017.
Source of Participants
Descriptive information regarding data sources, modes of data collection, representativeness, and annual sample size for the five data sources are provided in Table 1. Two commercial claims data sources (IBM Health Truven Market Scan® and Optum Labs® Data Warehouse) and two laboratory data sources (Quest Diagnostics and LabCorp) were used to estimate annual numbers and rates of hepatitis C testing. The National Health Interview Survey (NHIS) provided self-reported rates of ever being tested for hepatitis C. Institutional Review Board was not required because data were anonymized and publicly available. We provide further detail regarding data sources below.
Table 1: Description of data sources used to estimate rates of hepatitis C testing in the United States, 2011–2017

IBM Health Truven Market Scan® Medical Claims Data
We obtained health plan enrollment information and claims data for the 2011-2017 IBM Health Truven Market Scan® Commercial Claims and Encounters and Medicare Supplemental and Coordination of Benefits databases. These data consist of inpatient and outpatient service claims for persons with employersponsored health insurance coverage and their dependents. The database also contains longitudinal health information on enrollees.
Claims for HCV antibody testing was identified using CPT codes. We defined the annual hepatitis C testing rate as the number of patients with an HCV antibody test claim divided by the number of adults continuously enrolled in a commercial or Medicare Supplemental plan in a given calendar year. A 45-day gap was allowed during continuous enrollment. Enrollees were restricted to persons enrolled in managed care programs who also had outpatient prescription drug claims information.
Optum Labs® Data Warehouse Medical Claims Data
We obtained data from the Optum Labs® Data Warehouse (OLDW), which includes de-identified claims data for privately insured and Medicare Advantage enrollees. The health plan provides comprehensive full insurance coverage for physician, hospital, and prescription drug services. The database also contains longitudinal health information on enrollees.
Claims for HCV antibody testing was identified using CPT codes. We defined the annual hepatitis C testing rate as the number of patients with an HCV antibody test claim divided by the number of adults continuously enrolled in a commercial or Medicare Supplemental plan in a given calendar year. A 45-day gap was allowed during continuous enrollment. Enrollees were restricted to persons enrolled in managed care programs who also had outpatient prescription drug claims information.
Quest Diagnostics and LabCorp Laboratory Testing Orders
Laboratory testing orders were obtained from Quest Diagnostics and LabCorp which are commercial laboratories serving clinicians and hospitals in all 50 U.S. states and the District of Columbia. These data include both insured and uninsured individuals, and incarcerated persons. De-identified person-level data from HCV antibody immunoassay screening tests ordered during January 1, 2011 through December 2017 for Quest Diagnostics, and January 1, 2011 through October 2017 for LabCorp, were included in the analysis. Additionally, aggregate data on the number of unique patients served by each commercial laboratory for any purpose were used to account for fluctuations in population coverage during the study period and for accurate interpretation of observed trends.
Outpatient service claims with American Medical Association Current Procedural Terminology (CPT®) codes for HCV antibody testing (80074, 86803) were used to calculate patient-level data from the commercial laboratories. The numerator was defined as the number of unique individuals who received their first HCV antibody test during a month. The denominator was defined as the number of unique individuals who had any laboratory test performed by the commercial laboratory during the same month. All numerators and denominators were stratified by year of birth. The estimated HCV antibody testing rates are reported as number of persons tested for HCV antibody per 100 unique patients served.
National Health Interview Survey (NHIS)
The NHIS is a nationally representative cross-sectional face-toface household interview of civilian noninstitutionalized individuals in the United States [12]. The NHIS survey is a multistage probabilitybased survey design that includes stratification, clustering, and oversampling. Hepatitis C questions were administered on the survey from 2013 to 2017. The question used for this study was: “Have you ever had a blood test for hepatitis C?” We combined the responses “no” and “don’t know” into a single category because from a public health perspective “no” and “don’t know” are equally problematic in terms of the decision of whether to test or not test someone.
Statistical Analyses
Hepatitis C testing rates for all data sources were calculated for three different cohorts based on CDC’s 2012 and USPSTF’s 2013 recommendations for 1) persons born before 1945, 2) the “birth cohort” (i.e., persons born during 1945 through 1965) and 3) persons born after 1965. Proportions and 95% CIs were estimated for the commercial claims and laboratory data. Weighted proportions and 95% confidence intervals (CI) were calculated for NHIS. Nonoverlapping CIs were considered statistically significant. All statistical analyses were performed using SAS v9.4 and R version 3.5.2.
Results
IBM Health Truven Market Scan® Medical Claims Data
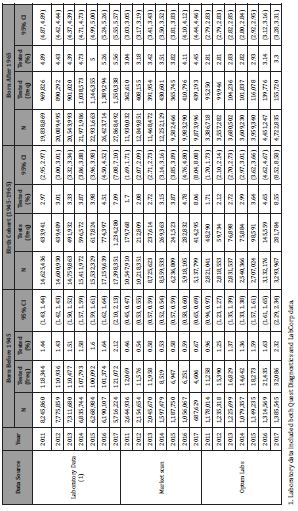
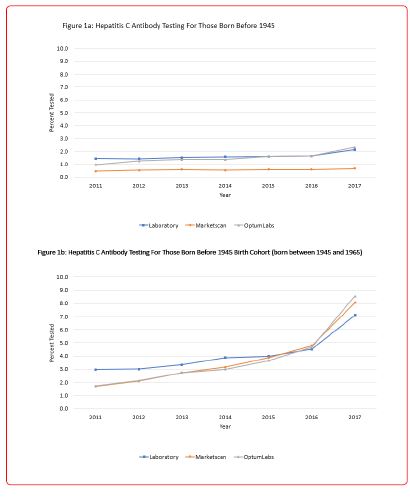
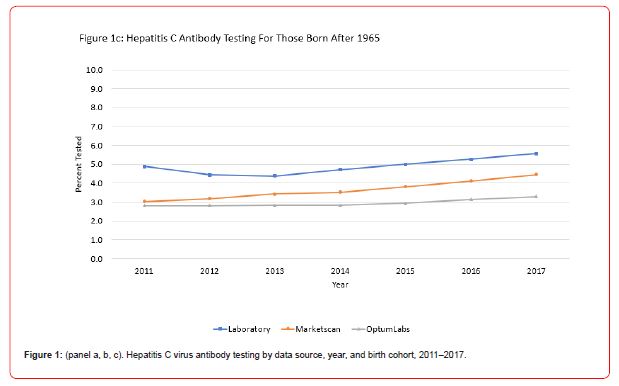
For the Market Scan sample, there were a total of 144,658,551 person years analyzed during the study period from 2011-2017. Across this time period, there were 4,709,184 individuals who had one or more inpatient or outpatient service claim with a CPT code for HCV antibody testing (average of 3.26% individuals tested per year). Overall, the annual testing rate increased from 2.21% in 2011 to 5.47% in 2017. Stratified by cohort, testing rates also increased significantly from 2011 to 2017 among all three cohorts. Among those born before 1945, the testing rates increased from 0.46% [95% CI 0.45-0.47] in 2011 to 0.67% [95% CI 0.65-0.69] in 2017. For the 1945-1965 birth cohort, testing rates increased from 1.70% [95% CI 1.69-1.71] to 8.06% [95% CI 8.04-8.08]. For those born after 1965, the annual testing rates increased less sharply from 3.04% [95% CI 3.03-3.05] to 4.45% [95% CI 4.44-4.46] (Table 2).
Table 2: Laboratory test orders and medical claims for hepatitis C antibody testing by data source, year, and birth cohort, 2011–2017

Between 2011 and 2017, there was a 373% increase in the testing rate among the birth cohort while only a 46% and 32% increase during the same time period for those born before 1945 and those born after 1965, respectively (Figure 1).


Optum Labs® Data Warehouse Medical Claims Data
For the Optum Labs® Data Warehouse Medical Claims Data, a total of 56,079,555 person years were examined from 2011 through 2017. There were 1,729,496 individuals who had one or more inpatient or outpatient service claim with a CPT code for HCV antibody testing (average of 3.08% individuals tested per year). The overall annual testing rate increased from 2.10% in 2011 to 4.99% in 2017. We also found testing rates increased significantly among all cohorts from 2011 through 2017. Among those born before 1945, the testing rates increased from 0.96% [95% CI 0.94-0.97] to 2.32% [95% CI 2.29-2.34]. For the 1945-1965 birth cohort, testing rates increased from 1.71% [95% CI 1.70-1.73] to 8.55 % [95% CI 8.52-8.58]. For those born after 1965, the testing rates increased from 2.81% [95% CI 2.79-2.83] to 3.30% [95% CI 3.28-3.31].
From 2011 to 2017, a 400% increase in the testing rate among the birth cohort was observed while only a 142% and 15% increase was noted during the same time period for those born before 1945 and those born after 1965, respectively.
Quest Diagnostics and LabCorp Laboratory Test Orders
The two laboratory data sources provided a total of 317,501,190 person-years during 2011-2017, which included 13,244,221 individuals who had one or more claims with a CPT code for HCV antibody testing (average of 4.17% individuals tested per year). The overall annual testing rate increased from 3.56% in 2011 to 5.70% in 2017. The testing rates across all age cohorts increased significantly from 2011 compared to 2017. Among those born before 1945, the testing rates increased from 1.44% [95% CI 1.43- 1.44] to 2.12% [95% CI 2.10-2.13]. For the 1945-1965 birth cohort, the testing rates increased from 2.97% [95% CI 2.95-2.97] to 7.09% [95% CI 7.08-7.10]. And for those born after 1965, the testing rates increased from 4.89% [95% CI 4.87-4.89] to 5.56% [95% CI 5.55- 5.57].
Between 2011 and 2017, there was a 139% increase in the testing rate among the birth cohort while only a 48% and 12% increase during the same time period for those born before 1945 and those born after 1965, respectively.
National Health Interview Survey
We analyzed a sample of 148,674 adults who responded to the hepatitis C test question that was administered on the NHIS from 2013 through 2017. For this sample, 12.82% (weighted; 95% CI 12.54-13.10) responded that they had received a hepatitis C test (“yes”). In Table 3, sample size, number tested, and weighted annual rates of self-reported hepatitis C testing are reported by birth cohorts. In 2013, among those born before 1945, 4.42% [95% CI 3.55, 5.29] reported ever having been tested for hepatitis C. This increased to 5.68% [95% CI 4.72-6.63] in 2017 but was not statistically significantly different. The rates of testing statistically significantly increased from 12.27% [95% CI 11.47-13.07] in 2013 to 17.33% [95% CI 16.34-18.33] in 2017 for the 1945-1965 birth cohort and from 12.98% [95% CI 12.23-13.73] in 2013 to 15.34% [95% CI 14.46-16.22] in 2017 for those born after 1965. The increase in testing rates was greater for persons with government insurance (i.e., Medicaid, Medicare, or military insurances) relative to those with private insurance (Appendix 1). Conversely, those with no insurance had lower testing rates and very small increases in testing relative to those with other types of insurance.
Table 3: Self-Reported Hepatitis C Testing (National Health Interview Survey 2013-2017).

Discussion
This study demonstrated significant increases in annual rates of hepatitis C testing from 2011 through 2017 in the United States using multiple data sources including medical claims data, laboratory test orders, and self-reported survey data. Among the 1945-1965 birth cohort, rates of hepatitis C testing increased substantially faster relative to the other two cohorts suggesting a clear positive impact of the CDC 2012 and USPSTF 2013 testing recommendations. Extremely consistent results were found using the two medical claims data sources which represent large samples of insured noninstitutionalized individuals in the U.S. The results from the two commercial laboratory data sources also showed results that were quite consistent and similar in magnitude to medical claims data. Among the three data sources (i.e, MarketScan, Optum Labs, and Laboratory Data (Quest Diagnostics and Labcorp) there was a 374%, 400%, and 139% increases in testing among the birth cohort between 2011 and 2017, respectively, with the largest increase in testing occurring between 2016 and 2017.
Using the NHIS self-reported rates of hepatitis C testing data, rates of testing among the birth cohort increased from approximately 12% to 17% between 2013 and 2017. This represents an individual’s awareness of whether they have been tested. Using the two medical claims data sources and laboratory data sources, the sum of the testing rates across the study period from 2011 to 2017 for the birth cohort ranged from 26.4% to 28.8% tested which likely represents a lower limit of the total number of individuals that have been tested in these populations. The medical record estimates for hepatitis C testing rates are approximately 56% higher than the estimates from the NHIS suggesting that selfreporting hepatitis C testing status may be problematic. In addition, a substantial percentage of persons surveyed by NHIS reported that they “don’t know” if they were tested (8%). Persons unaware of their testing status are also likely to be unaware of their disease status; an estimated 39% of persons with HCV infection were unaware of their disease status.6 Although there may be some issues with self-reported information, awareness of an individuals’ testing and treatment status is critical for persons to advocate for care and treatment if appropriate.
Although a clear positive impact for the cohort-specific CDC and USPTF recommendations appears to have occurred, there is still substantial room for improvement in HCV testing rates. In addition, in response to the CDC and USPSTF recommendations, several additional actions helped to promote HCV testing of the 1945- 1965 birth cohort. The Centers for Medicare and Medicaid Services implemented reimbursement for hepatitis C testing in January 2015 (two years after the USPSTF recommendations were issued) for adults at high risk for HCV infection or who were born during 1945-1965 [13], which likely led providers to be more likely to test. Increased awareness of hepatitis C among providers and patients was also an important factor. The CDC’s “Know More Hepatitis” campaign, including promotional messaging and providing limited clinical education, was developed with the goal of increasing hepatitis C testing and knowledge among persons born 1945-1965 and their primary care providers [14] This national campaign likely played a role in hepatitis C testing implementation in conjunction with other promotional programs. Finally, widespread pharmaceutical company advertising for curative treatments with funding and support of testing also brought greater provider and public awareness of hepatitis C.
For persons testing positive for HCV infection, linkage to care and treatment has been shown to be cost effective and improves health outcomes [15-17] Direct-acting antiviral agents, initially approved in 2011 are now safe, all-oral, interferon-free, tolerable, and highly curative.16 Cure rates are over 90% and access to care and treatment has improved over time due to Medicaid expansion as part of the Affordable Care Act, decreases in Medicaid restrictions (i.e., liver damage, sobriety, prescriber) and decreases in drug prices, though barriers remain. Improved access to available treatments and the likelihood of cure for treated persons also provides greater incentive for providers to test for HCV infection and for the public to request testing [18].
In the future, this approach of analyzing multiple diverse data sources to study national hepatitis C testing rates over time could be utilized for state level data, as well as for evaluating other steps of the care continuum, such as trends in engagement in care or treatment among persons with current HCV infection.
The CDC and USPSTF recommendations for hepatitis C birth cohort testing was followed by significant increases in hepatitis C testing rates among persons born during 1945-1965. After the implementation of the recommendation, a wide range of additional factors also likely contributed to the success of this policy. Together, the data reveal the birth cohort recommendation was a successful public health policy initiative that also required sufficient time to fully implement due to necessary changes in health systems (e.g., electronic message prompt), reimbursements, standard operating procedures (e.g., electronic message prompts, reflex PCR testing) and behaviors of both providers and patients. Increased hepatitis C testing is critical for identifying infected persons in time for curative treatment prior to liver disease progression and HCV transmission. Improved implementation of hepatitis C testing recommendations is needed, particularly as attention shifts to the post-1965 birth cohort and the increase in incident HCV infections among injection drug users.
There were several limitations associated with the analyses and data presented in this paper. First, the results for commercial claims data sources were based on a sample of individuals receiving benefits from commercial insurance or Medicare Advantage plans and excluded uninsured individuals or those who were covered by other types of insurance. Second, the denominators for the laboratory tests were based on individuals tested and were not necessarily representative of the individuals who were not tested. Therefore, factors that would lead one to obtain laboratory tests, most notably, having a chronic condition, may have biased the results. Third, for the NHIS survey data, the question represented self-reported awareness of testing and likely underestimates actual testing rates due to recall bias. Future studies should consider assessing the impact of recall bias by comparing self-reported awareness to actual medical records.
In the future, analyzing multiple diverse data sources to study trends in hepatitis C testing rates appears to be promising and could be used to assess trends at the national and state level in order to monitor federal goals to eliminate HCV. In addition, using multiple data sources to evaluate the effectiveness of more recent HCV public health testing recommendations will be important [19].
Financial Support
Quest Diagnostics, LabCorp, and Optum Labs were given financial support from the CDC for the purposes of CDC staff accessing and analyzing the data.
Disclaimer
The findings and conclusions in this report are those of the authors and do not necessarily represent the official position of the US Centers for Disease Control and Prevention or the authors’ affiliated institutions.
References
- Sterne JAC, Davey Smith G (2001) Sifting the evidence - what’s wrong with significance tests? BMJ 322: 266-231.
- Greenland S, Senn SJ, Rothman KJ, Carlin JB, Poole C, et al. (2016) Statistical tests, P values, confidence intervals, and power: a guide to misinterpretations. European Journal of Epidemiology 31(4): 337-350.
- Amrhein V, Greenland S, McShane B (2019) Retire statistical significance. Nature 567: 305-307.
- McShane BB, Gal D, Gelman A, Robert C, Tackett JL (2019) Abandon Statistical Significance. The American Statistician 73(sup1): 235-245.
- Wasserstein RL, Schirm AL, Lazar NA (2019) Moving to a World Beyond “p < 0.05”. The American Statistician 73(sup1): 1-19.
- Twisk JWR (2024) Refrain from statistical testing in medical research; it does more harm than good. Annals of Public
- Bland JM (2009) The tyranny of power: Is there a better way to calculate sample size. BMJ 339: b3895.
- Schulz KF, Grimes DA (2005) Epidemiology 1 - Sample size calculations in randomized trials: mandatory and mystical. Lancet 365(9467): 1348-1353.
- Bacchetti P (2010) Current sample size conventions: Flaws, harms, and alternatives. BMC Medicine 8: 17.
- Noordzij M, Dekker FW, Zoccali C, Jager KJ (2011) Sample size calculations. Nephron Clinical Practice 118: c319-c323.
- Edwards SJL, Lilford RJ, Braunholtz D, Jackson J (1997) Why “underpowered” trials are not necessarily unethical. Lancet 350(9080): 804-807.
- Guyatt GH, Mills EJ, Elbourne D (2008) In the era of systematic reviews, does the size of an individual trial still matter? PLoS Medicine 5(1): e4.
-
William W Thompson*, Lauren Canary, Jay Soh, Mohammed Khan and Jane Sullivan. Evaluation of 2012/2013 Public Health Recommendations for Hepatitis C Testing Using Multiple Data Sources. Annal of Pub Health & Epidemiol. 2(4): 2024. APHE. MS.ID.000541.
-
Global warming; climate change; lac +ve and lac-ve mutants; microbiota; lactococcus lactis var. lactis; tornados; tsunami; hurricanes; plasmids; probiotics; public health; iris publishers; iris publisher’s group
-

This work is licensed under a Creative Commons Attribution-NonCommercial 4.0 International License.


