


 Research Article
Significant Role of Ocean Heat Content on the Cyclone Intensity Over the North Indian Ocean
Received Date: May 22, 2021; Published Date: June 11, 2021
Abstract
Recent evidence shows that the subsurface ocean structure plays an important role in modulating air-sea fluxes during the storm, which affects the change in intensity. We investigated the importance of surface sea temperature (SST) and the heat content of the upper ocean (UOHC) in the intensification of the tropical cyclone (TC). From an oceanic environmental viewpoint, a rapid deepening of TC central pressure occurs when UOHC is relatively high on a basin scale, while composite distributions of UOHC, vertical wind shear, lower tropospheric relative humidity, and wind speed occurring in cases of rapid intensification are different for each TC season. To explore the influence of UOHC on TC intensification, analyses using MW-IR-OISST, SLA, and Geostrophic Currents data for the cases of Cyclones namely Kyarr (2019), Sidr (2007), Ockhi (2017), Mukda (2006), Nanauk (2014). The increase in Ocean heat content anomaly (OHCA) led to the intensification of these five cyclones even though there are cold-core eddies along their tracks and also suppression of intensity is caused by a decrease in Ocean Heat Content Anomalies. These results suggest that UOHC plays an important role in TC intensity and its intensification. This analysis confirms that consideration of the underlying eddies in the cyclone tracks, UOHC variations must be considered in forecasting the cyclone intensity and its track.
Keywords: Ocean heat content, Sea level anomaly, Sea surface temperature, ACE.
Introduction
The tropical cyclone is one of nature’s destructive mesoscale systems, a well-organized rotating low-pressure system with clouds and thunderstorms over tropical waters. It consists of three different phases, namely genesis, intensification, and landing. In the Arabian Sea and the Bay of Bengal basins, about 4.8% of tropical vortices have sprung up [1]. Compared to the Bay of Bengal, the frequency ratio of tropical cyclones in the Arabian Sea is about 4:1 [2,3]. The pre-monsoon seasons (April-June) and Post Monsoon (October-December) are the favorable periods for the formation of cyclones in the northern Indian Ocean (NIO). The Arabian Sea is very cold compared to the Bay of Bengal and therefore prevents the formation and severity of storms, but in recent years the frequency and severity of hurricanes have gradually increased.
A slight increase in the frequency and intensity of tropical cyclones can lead to greater damage. Therefore, in addition to the intensity, it is also necessary to study the trend and variability of tropical cyclones. Various methods have been used around the world to study the effects of storm activity around the world. The effects of storm activity are measured in the form of frequency, duration, maximum sustained wind intensity, cyclone ground fall, significant wave height concerning integrated base dimensions such as surge altitude, precipitation associated with the cumulative storm index (ACE), and critical performance index (PDI) [4].
In theory, it has been well demonstrated that sea surface temperature (SST), Coriolis strength, vortices in the low-level troposphere, relative humidity, and vertical shear of the shear wind are the important factors influencing storm births. Webster et al. (2005) [5] studied the relationship between SST and the number, duration, and intensity of tropical cyclones in all basins. They concluded that SST is increasing in all pools with the highest rate of NIO. The heat content of the upper oceans also plays a decisive role in the formation and intensification of the storm [6]. For decades, the oceans have been considered a major cause of climate change due to their great thermal inertia [6]. They store large amounts of thermal solar energy in the upper layers on low time scales and deeper layers for long periods. The change in heat flow between the atmosphere and the ocean occurs from the upper layers. The vast majority of changes in ocean heat content over the past 50 years are found in the more than 700 m of the global ocean [7]. Therefore, monitoring the thermal structure of the upper ocean is important for studying storm-ocean interactions, including storm variability. There is a significant correlation between tropical cyclone formation and intensity changes with ocean heat content (OHC) [8, 10, 11]. Many researchers have also reported seasonal TC activity modulations based on large-scale environmental conditions. [12].
Data and methods
Data
Best Track TC Data: In this study, the northern Indian Ocean region (0°- 30°N; 45°-100°E) was considered as an area of interest. Cyclone information, including time (UTC), central location, maximum sustained wind speed (MSW), and minimum sea surface pressure, are retrieved from the best track data from the IMD and IBTrACS [13] . Five different category cyclones are consider studying the role of upper ocean heat content on intensity of each cyclone and the tracks of all cyclones are show in Figure 1.
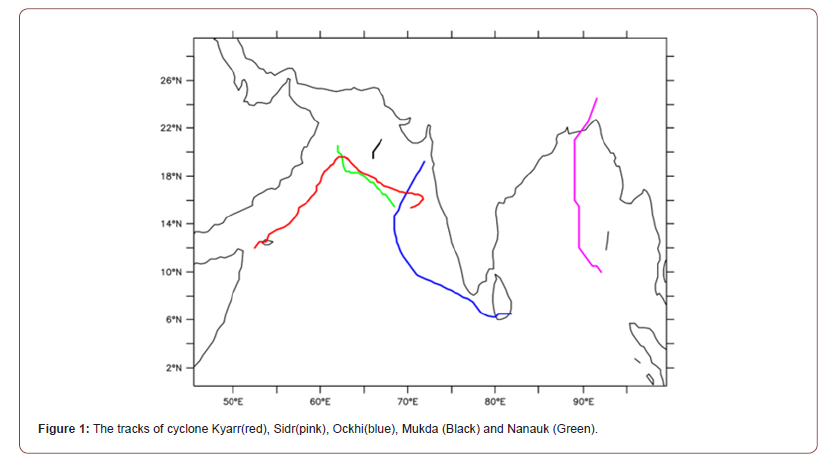
Daily Microwave and Infrared Optimum Interpolated SST (MW-IR-OISST) by remote sensing systems (http://www.remss. com) with a spatial resolution of 4 km x 4 km to study the surface cooling contrast between cyclones. Combines the OI-SST product with cloud capacity [14]. The Asia Pacific Data Research Center daily SLA and geostrophic datasets. Positive ALS (negative) usually corresponds to mesoscale vertebrae with hot (cold) water in the central area [15].
Digital outputs of the ocean model: Daily data on sea temperature and Salinity of HYCOM - NCODA Global 1/12 s GOFS3.1 41-layer analysis (GLBv0.08 expt_92.9-expt_93. (GLBa0.08_rect) and HYCOM - NCODA Global 1/12 (http://www.hycom.org/) analysis with 9.25 km spatial resolution for the study of 5 cyclones on NIO [16].
Methods
Cyclone Accumulated Cyclone Energy calculated by (1)
The spatial distribution of the ocean’s heat content is calculated based on the HYCOM output of the ocean temperature profiles T(z): (2)
The density of seawater (1024 kg/m3) is located; Cp is the heat capacity (4186 J/kg), d1, d2 is the depth range on which the heat content is calculated.
To understand the effects of OHC on cyclone intensity changes, we made the OHC (OHCA) change [17].
OHCA - OHC (before)-OHC (Post) (3)
Results and Discussion
Thermal Response
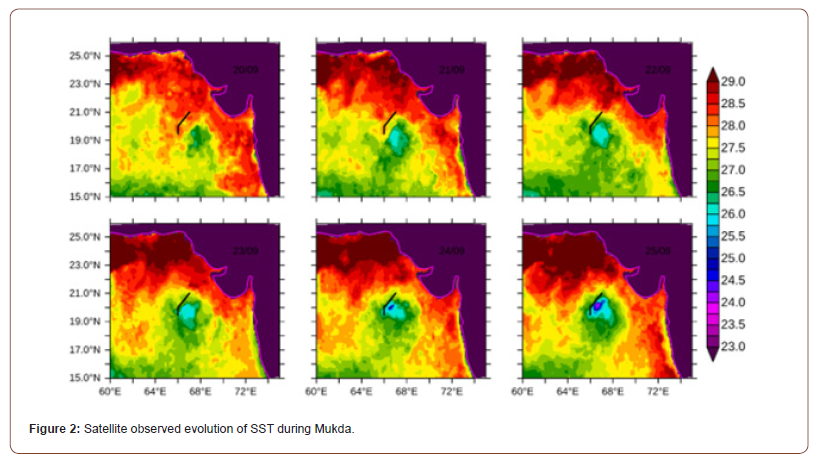
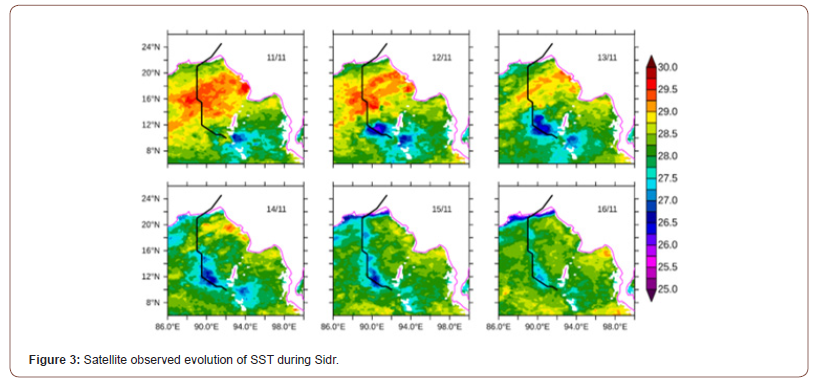
Figure 2 depicts the SST changes at different stages of the Mukda storm. During the Mukta storm, SST dropped over 28.5 C (20 September 2006), and the SST storm area and had a low- SST area compared to the surroundings. SST decline eventually increases gradually, and on September 25, 2006, SST drops to 24 ⁰C. Maximum depreciation of SST on the right side of the Mukda track on 25 September 2006> 4. C. We can observe from Figure 3 that the SST variation at different stages is a Sidr storm. During the Sidr storm, SST dropped to 28.5 C (11 November 2007), and the SST cyclone area and had a low-SST area compared to the surroundings. On 16 November 2007, the SST decline gradually increased and the SST fell to 27 ⁰C. Maximum depreciation of SST on the right side of the cedar track on 14 September 2006> 2. ⁰C.
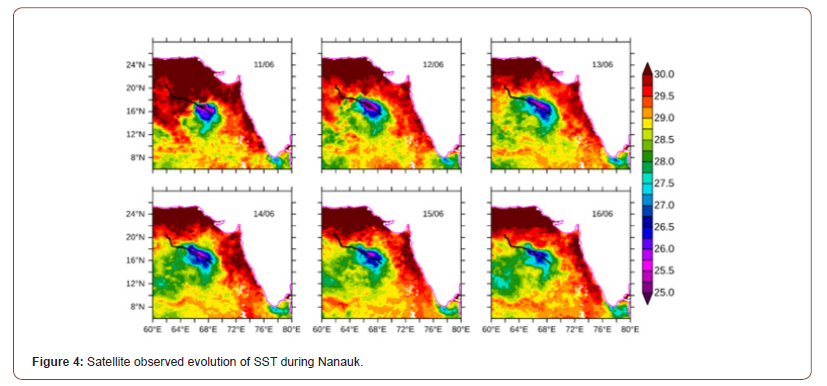
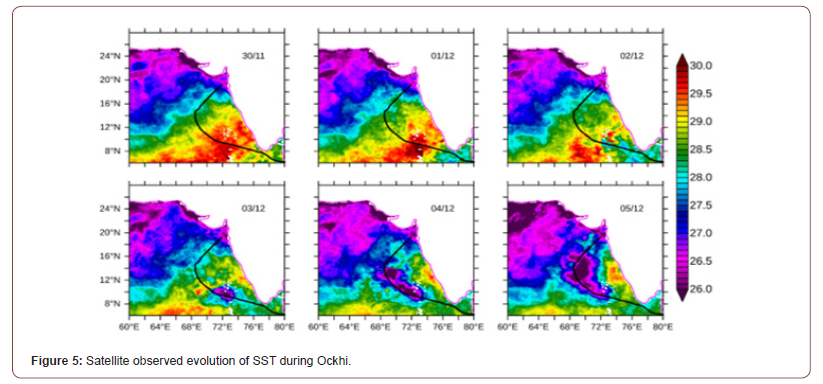
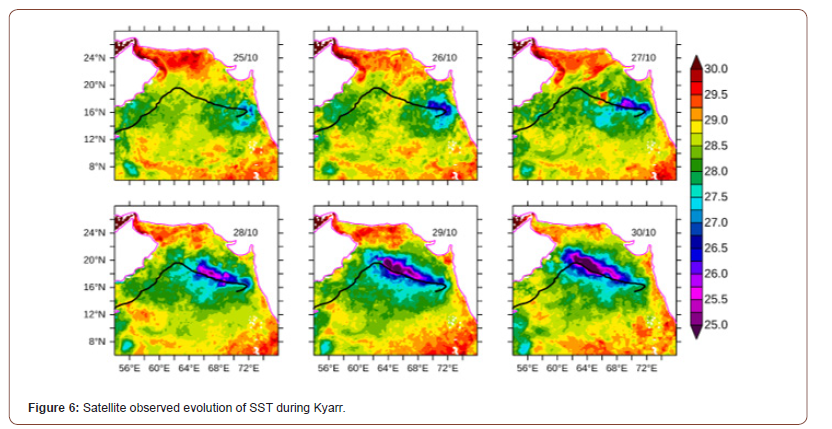
Figures 4-6 also illustrate the SST variations during Nanauk, Ockhi, and Kyarr cyclones. In Figure 4, the low-SST patch was gradually developed along the Nanauk track. It shows a decrease of approximately 25 ⁰C along the track [Figure5, 6]. Ockhi and Kyarr also show low-SST area along the track. On 05 December 2017. in Ockhi has almost> 5 ⁰C track, in the case of Kyarr, a low SST patch appeared along the track. SST was reduced from 29 ⁰C (25 October 2019) to 25 ⁰C (30 October 2019). Therefore, the induced strong mixing effects were able to bring the cold water from depth to the surface.
Upper-ocean dynamics on intensification
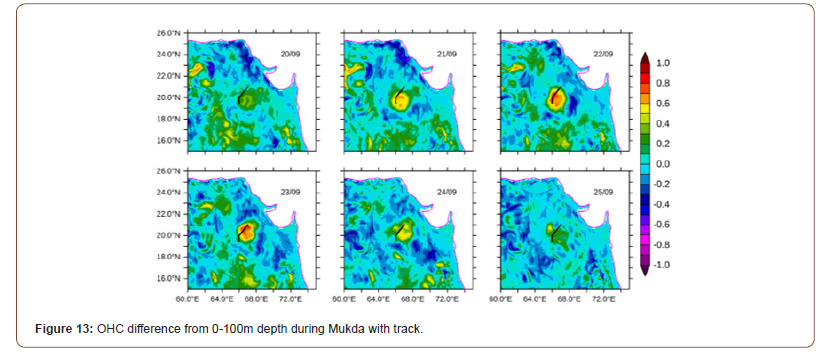
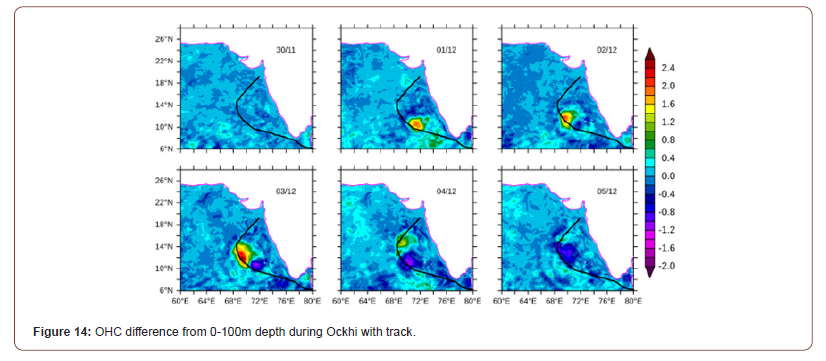
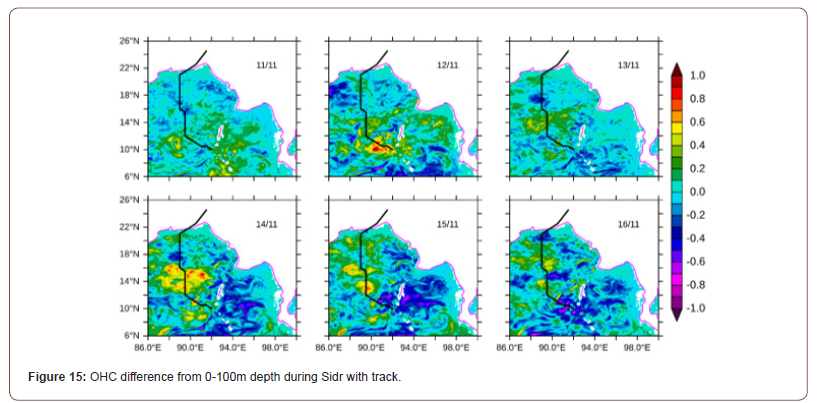
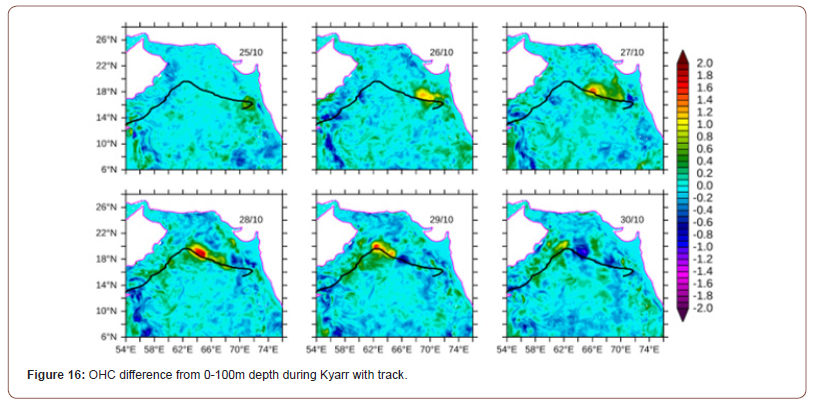
Figure 7-11 depict the changes in sea level anomalies (SLA) and geostrophic current circulation during different stages of 5 cyclones. Kyarr in the Arabian Sea (24 October-02 November 2019) and it was a superstorm in the Arabian Sea that landed on November 02, 2019, with a maximum intensity of 134 knots. From Figure 11, it is clear that there are cold-core eddies on its track, but the UOHC was high as the storm passed. From our analysis of UOHP, high UOHP was observed during intensification and a sufficiently large UOHP was observed along the storm path. Sidr in Bob (11-16 November 2007) and a very severe storm in Bob, which landed on November 16, 2007, with a maximum intensity of 115 knots. From Fig. 10, it is clear that there are cold-core eddies on its track, but UOHC was high as the storm passed. From our analysis of UOHP, high UOHP was observed during intensification and a sufficiently large UOHP was observed along the storm path. Hurricane “Ockhi” emerged in the southern hemisphere on November 29, 2017, and intensified into a full-scale cyclone, finally reaching the coast of Gujarat on December 6, 2017. Its severity reached a maximum of 85 knots (Figure 9). From the storm track, it is clear that a cold-core eddy is on its track, however, the UOHC is significantly higher during peak intensity. Mukda (21-24 September 2006) in the Arabian Sea and a severe storm in Bob, which landed on September 24, 2006, with a maximum intensity of 55 knots. From Figure 8, it is clear that there are cold-core eddies on its track, but UOHC is high as the storm passes. From our analysis of UOHP, high UOHP was observed during intensification and a sufficiently large UOHP was observed along the storm path. Nanauk (06 October 2014) in the Arabian Sea and it was a hurricane in Bob, which landed on September 24, 2006, with a maximum intensity of 55 knots. From Figure 7, it is clear that there are cold-core eddies on its track, but UOHC is high as the storm passes. From our analysis of UOHP, high UOHP was observed during intensification and a sufficiently large UOHP was observed along the storm path.
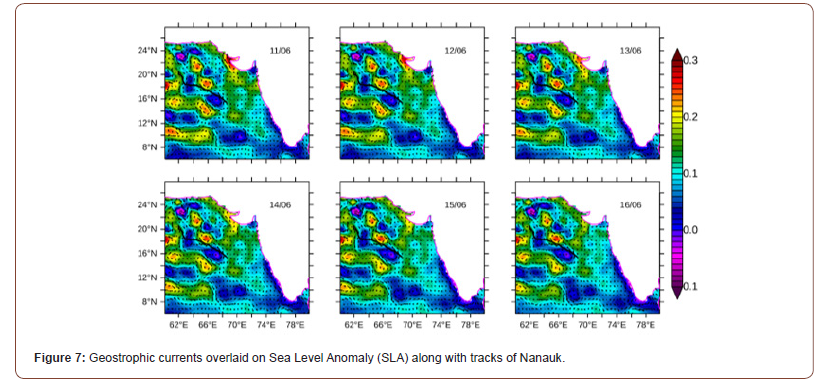
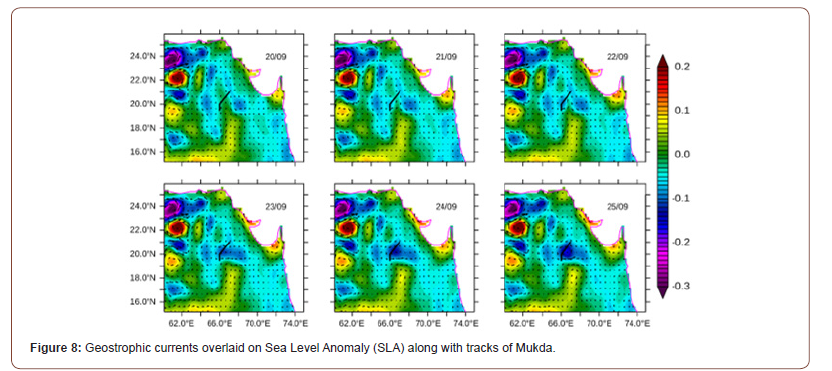
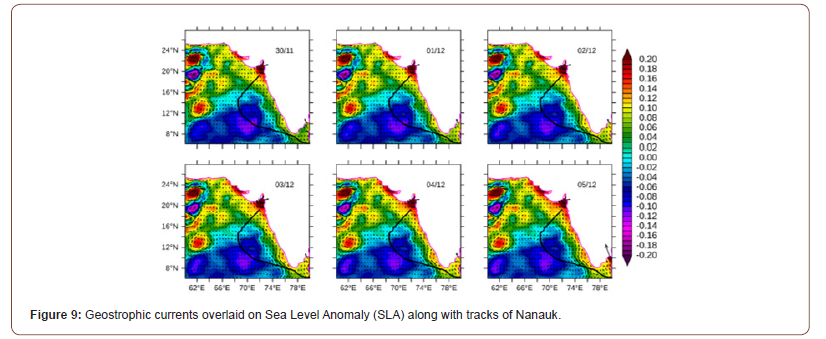
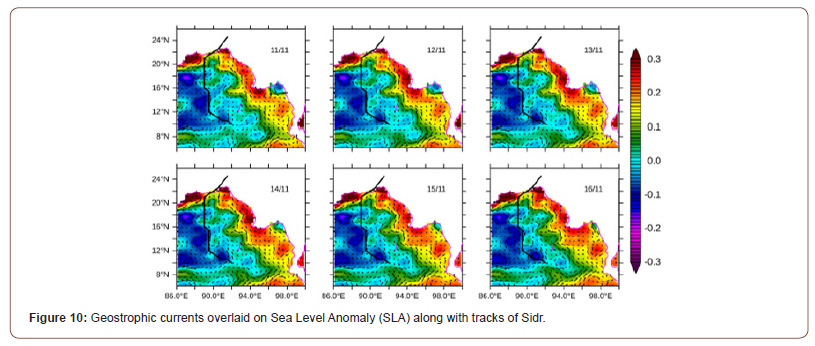
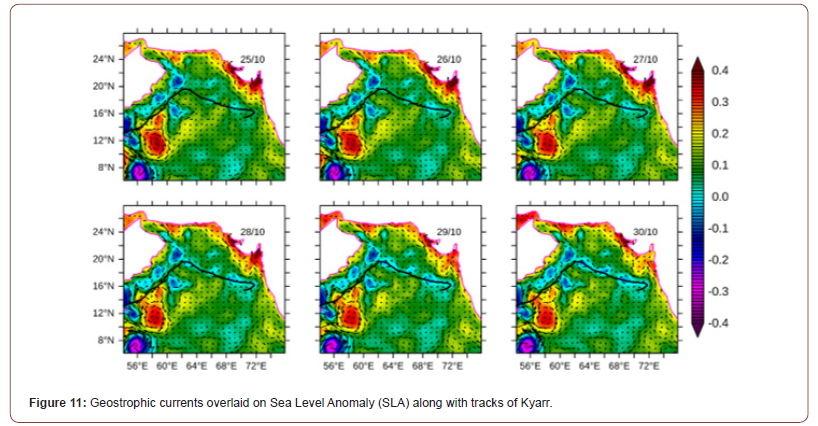
For these five hurricanes (namely. Kyarr, Sidr, Ockhi, Mukda, and Nanauk), it was found that there was significantly more UOHC available for intensity, although there were no eddy and coldcore eddy along their tracks [18]. Along the Sidr storm track, we observed three strong cold-core eddies and SLA - 0.1 m. Along the Ockhi track, we noticed that the former Cold Core Eddie plays a key role and the SLA then is higher - 0.13 m. We noticed that there are no eddies along the Nanauk storm track but there are two warm-core eddies on the right side of the track, and three warm-core eddies are displayed on the left side of the track. We noticed that there was a cold-core eddy along the Mukda track, and the SLA was then high - 0.1 m. We observed four strong CCEs along the Kyarr storm track. Although it passed through the CCEs, the storms intensified due to energy input from the upper ocean layer (0-100 m) in the form of ocean heat content. The role of OHC in the intensification of these 5 cyclones were discussed below. To understand the effect of OHC on cyclone intensity changes, we took OHC change (OHCA) [17].
OHCA = OHC (pre)-OHC (post)
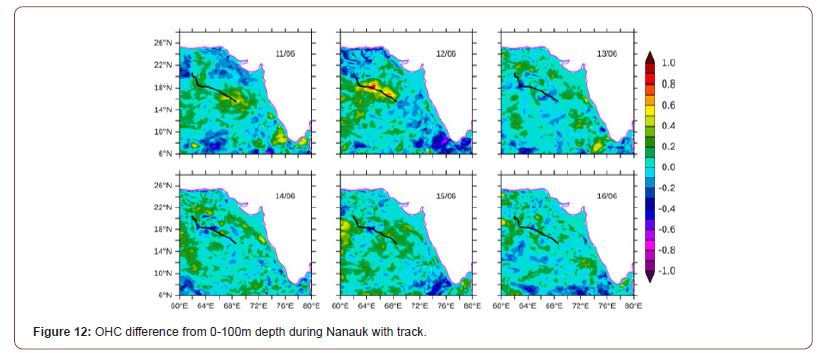
Figures 12-16 illustrate the OHC anomaly (OHCA) of the upper ocean (0–100 m) during Kyarr, Sidr, Ockhi, Mukda, and Nanauk cyclones. Strong positive OHCA observed along with the Kyarr cyclone and they are gradually increasing from 24 October 2019 to 01 November 2019 and also equated with a different stage of Kyarr Cyclone. We observed a very strong positive OHCA during 27 and 28 Oct 2019 nearly 2x10⁹ J/m2 which coincide with the rapid intensification of Kyarr cyclone. Like Kyarr all remaining cyclones are shown high OHCA along their tracks and equally correlated with their intensity and shape of the cyclones. positive OHCA observed during these all cyclones. OHCA at the intensification point of five super cyclones also indicated strong positive anomaly during these cyclones and it is varies based on the category of the cyclones also (Table 1). From table 1 the top layer of the ocean (0-100) shows strong positive OHCA observed during all of these 5 cyclones. Table 1. Upper-ocean heat content anomaly at intensification point of 5 different category cyclones.
Table 1 reveals that high upper OHC are associated with TC intensification, and CCEs or low upper OHC are observed to reduce their intensities. Intensification of these 5 cyclones is caused by the presence of high upper Ocean Heat Content.
Table 1: Accumulated cyclone energy and ocean heat content anomaly of five cyclones.

Conclusion
Accurate track and intensity assessment of cyclones is a problem that has been challenging cyclone surge and risk management for decades. However, there have been significant improvements in cyclone track forecasts recently, but the severity forecast is still lacking for rapid, unexpected cyclones. These unexpected unforeseen events are catastrophic before a landslide in the world’s most populous and cyclone surge areas. The presence of eddies on or near cyclone tracks (which can be easily deduced from satellite altimetric SLA data sets) can play a key role in predicting sudden cyclone severity changes. The combination of satellite data and numerical model products provides a unique opportunity to study the impact of Tropical Cyclones (TC) on changes in the upper ocean. In this paper, multi-platform datasets were used to research the thermodynamic and dynamics of the upper ocean to five different category cyclones formed in the NIO, namely Kyarr, Sidr, Ockhi, Mukda, and Nanauk. After crossing the 5 TCs, the SST decreased significantly due to strong sea intrusion and surge. The magnitude and extent of sea surface cooling are related not only to the intensity and translational speed of TC but also to the local ocean conditions. The upper OHC plays a vital role in modulating the thermodynamics of the upper ocean. Under different oceanic background conditions, the upper ocean responses to TCs may be different, with TC-induced vertical mixing being the main factor influencing upper ocean conditions. Therefore, the main results of this study such as sea surface cooling, sea level, and geostrophic currents circulation and OHC.
Acknowledgement
We thank the Director of Indian Meteorological Department, Remote Sensing System, and IBTrACS team for providing cyclone track data, satellite data products used in this study.
Conflict of interest
None
References
- MP Vasudha, G Raju (2017) Observation of cyclone occurred in Arabian sea and bay of bengal from SAPHIR sensor data. Int J Appl Eng Res 2(22): 12821–12832.
- Dube (1970) Storm Surge Forecasting in the Bay of Bengal and Arabian Sea.
- IPCC Working Group 1. IPCC, 2013: Climate Change 2013: The Physical Science Basis. Contribution of Working Group I to the Fifth Assessment Report of the Intergovernmental Panel on Climate Change Ipcc, vol. AR5: 1535.
- L Wu , B Wang, SA Braun (2008) Implications of tropical cyclone power dissipation index. Int J Climatol.
- PJ Webster, GJ Holland, JA Curry, HR Chang (2005) Atmospheric science: Changes in tropical cyclone number, duration, and intensity in a warming environment. Science 309 (5742): 1844–1846.
- KA Emanuel (1999) Thermodynamic control of hurricane intensity. Nature 401(675): 665–669.
- S Levitus, J Antonov, T Boyer (2005) Warming of the world ocean, 1955-2003. Geophys Res Lett 32(2): 1–4.
- MM Ali, P Sandery, K Kang, A Mehra, E Chassignet, et al. (2009) Applications of Satellite-Derived Ocean Measurements to Tropical Cyclone Intensity Forecasting. Oceanography ODAE (3).
- A Wada, N Usui (2007) Importance of tropical cyclone heat potential for tropical cyclone intensity and intensification in the Western North Pacific. J Oceanogr 63(3): 427–447.
- A Wada and JCL Chan (2008) Relationship between typhoon activity and upper ocean heat content. Geophys Res Lett 35(17): 1–6.
- LK Shay, JK Brewster (2010) Oceanic heat content variability in the eastern pacific ocean for hurricane intensity forecasting. Mon Weather Rev 138(6): 2110–2131.
- PS Chu, X Zhao, CT Lee, MM Lu (2007) Climate prediction of tropical cyclone activity in the vicinity of Taiwan using the multivariate least absolute deviation regression method. Terr Atmos Ocean Sci 18 (4): 805–825.
- KR Knapp, MC Kruk, DH Levinson, HJ Diamond, CJ Neumann (2010) The international best track archive for climate stewardship (IBTrACS). Bull Am Meteorol Soc 91(3): 363–376.
- RW Reynolds, TM Smith (1994) Improved global sea surface temperature analyses using optimum interpolation. J Clim
- J Ning, Q Xu, H Zhang, T Wang, and K Fan (2019) Impact of cyclonic ocean eddies on upper ocean thermodynamic response to Typhoon Soudelor. Remote Sens 11(8).
- EP Chassignet, Harley E Hurlburt, Ole Martin Smedstad, George R Halliwell, Patrick J Hogan, et al. (2005) The HYCOM (Hybrid Coordinate Ocean Model) data assimilative system. J Mar Syst 65(1-4): 60–83.
- NK Vissa, ANV Satyanarayana, B Prasad Kumar (2013) Intensity of tropical cyclones during pre- and post-monsoon seasons in relation to accumulated tropical cyclone heat potential over Bay of Bengal. Nat Hazards.
- II Lin, GJ Goni, JA Knaff, C Forbes, MM Ali (2013) Ocean heat content for tropical cyclone intensity forecasting and its impact on storm surge. Nat Hazards 66(3): 1481–1500.
-

This work is licensed under a Creative Commons Attribution-NonCommercial 4.0 International License.