 Opinion
Has Seasonal Ocean Calcification Been Overlooked as a Cause of the Increasing Keeling Curve? A Thermal Acidifying Calcification Hypothesis
Ivan R. Kennedy1*, John W. Runcie2, Angus N. Crossan3, and Raymond J. Ritchie4
*1School of Life and Environmental Sciences, Sydney Institute of Agriculture, University of Sydney, NSW 2006, Australia
2Aquation Pty Ltd., P.O. Box 3146, Umina Beach, NSW 2257, Australia
3Quick Test Technologies Pty Ltd, www.ackle.au, Australia
4Faculty of Technology and Environment, Prince of Songkla University, Phuket Campus, Phuket 83120, Thailand
Ivan R. Kennedy, School of Life and Environmental Sciences, University of Sydney, NSW, Australia
Received Date:April 09, 2025; Published Date:June 10, 2025
Abstract
The Keeling Curve documents a steady rise in partial atmospheric pressure of CO₂ (pCO2), conventionally attributed to fossil fuel emissions. Here, we propose an alternative cause, the thermal acidifying-calcification (TAC) hypothesis, principles of physical chemistry showing that warmingwill induce calcification in surface seawater, driving seasonal and longer-term increases in atmospheric pCO2. Using thermodynamic modeling and oceanographic data, we estimate that precipitation of ~10 μmol of of CaCO₃ per kg of surface seawater annually could release sufficient CO₂ to equilibrate locally with the recent 2 ppmv annual rise in atmospheric pCO2. Seasonal pH and pCO2 variations at marine stations (e.g., ALOHA, Hawaii) support this mechanism, challenging the dominant terrestrial photosynthesis- respiration explanation for Keeling oscillations. The TAC process can also explain the decreasing trend in 13CO2 in air because of dilution by the same processes that are driving the longer-term increase in atmospheric pCO2. To test this hypothesis, we recommend the following program: 1. field validation of CaCO₃ deposition rates, 2. measures of the CO2 flux and 3. isotopic analysis to test this alternative carbon cycle driver with measures to be taken both in the northern Pacific and in the southern hemisphere on a transect past the Great Barrier Reef.
Keywords:Keeling curve; carbon dioxide; bicarbonate; Mauna Loa; calcite; calcium ions; calcification; carbonic anhydrase; acidification; CaCO₃
Introduction
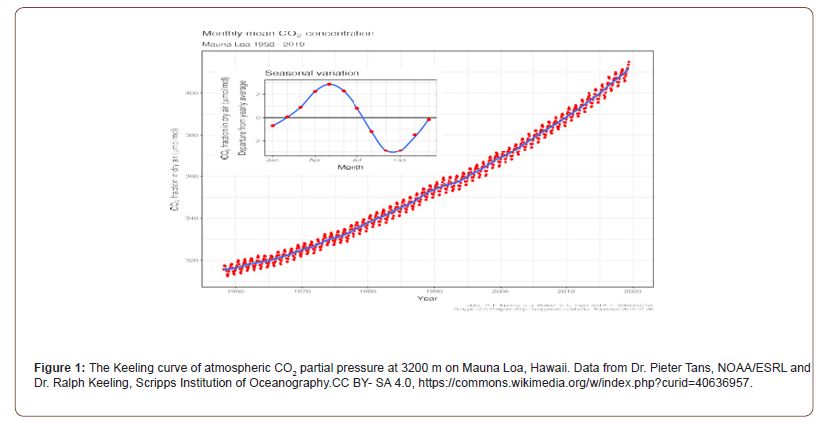
Atmospheric carbon dioxide (CO₂) concentrations in the Keeling Curve [1] at Mauna Loa, Hawaii, have risen from ~280 ppmv pre-industrially to 420 ppmv in 2021, with a current annual increase of ~2 ppmv. The Intergovernmental Panel on Climate Change (IPCC) attributes [2] this trend primarily to anthropogenic fossil fuel combustion, with seasonal oscillations linked to Northern Hemisphere terrestrial carbon cycling [2]. However, the ocean, covering 71% of Earth’s surface and exchanging ~90 GtC/ year with the atmosphere, may play an underappreciated role. We hypothesize that warming sea surface temperatures enhance CaCO₃ precipitation (calcification), acidifying surface waters and releasing CO₂ via a thermal acid-calcification (TAC) process. This could explain both seasonal pCO2 fluctuations and the long-termKeeling trend, potentially reversing the assumed cause-and-effect of atmospheric CO₂ driving ocean acidification. Charles Keeling’s sampling location on Mauna Loa, Hawaii, to analyze dry air, is historically significant. This research convinced scientists that CO2 was increasing, and the cause was human (Figure 1).
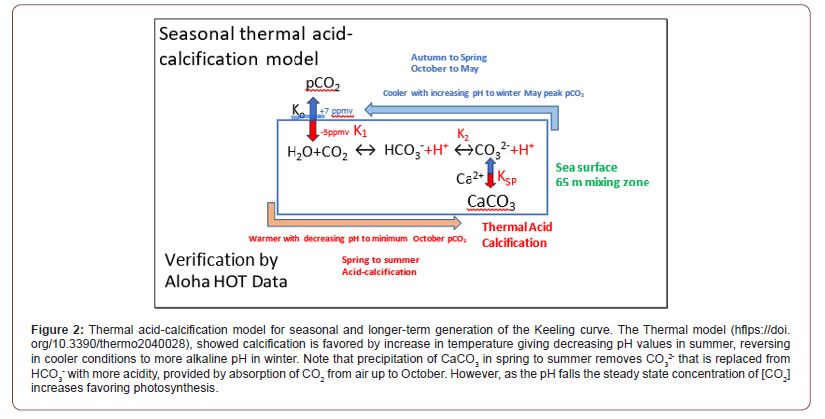
Yet CO2 is the very stuff of plant life on Earth in photosynthesis as well its source of carbon as the structural basis of all living creatures. We are now advised by the United Nations based IPCC that the continuing rise of CO2 in the Keeling curve shown in Figure 1, is from fossil fuel emissions, threatening global catastrophe from global warming. Such a paradoxical contrast for good and bad perhaps challenges credibility, given the longevity of life on Earth. Modeling that underpins the TAC process in Figure 2, detailed in Kennedy et al. [3], explains how variations in sea surface temperatures can mediate changes in ocean pH through calcification. This paper extends this work to hypothesize that there will be a net yearly increase in atmospheric CO2< from global warming. Further, we will detail the policy implications and make suggestions for hypothesis proving research. While CO2 is a trace gas, now present at a minute pressure of 0.00042 atm, it is much more reactive with water than the primary constituents of air and is coupled to biological action, including human activities.
At the surface layer of the atmosphere and within the oceans, CO2 is produced and destroyed through chemical and biological processes affected by temperature, pH and atmospheric pressure. These processes will also be affected by the concentration of other molecules, particularly salts in the seawater solution. The various quasi-equilibria reached will be continually changing with temperature and concentration, affecting the amount of CO2 released to the air from the ocean. Consideration of the TAC hypothesis requires an understanding of mixing zone chemistry and must not be confused between short term surface C02 cycling and the more static reservoir of dissolved inorganic carbon in the deeper ocean. The TAC hypothesis only makes sense with proper consideration of the dynamic nature of such ocean chemistry, an open system that includes abiotic and biotic components, all subject to kinetic effects of seasonal or longer term variation of temperature.
Our hypothesis for CO2 cycling in the global ecosystem (Figure 2) may seem counterintuitive, given CaCO3 is less soluble in warmer water. This scientific fact is consistent with CO2 being absorbed from the atmosphere into surface seawater in spring and summer, to form calcite or slightly more soluble aragonite. This feature of warming is a property of the calcium ion, given the solubility of calcium sulphate also decreases as temperature increases. This solubility behavior, known as retrograde, is uncommon: dissolution of most salts increases with temperature. The retrograde solubility of calcium sulphate is also responsible for its precipitation in the hottest zones of heating systems and for its contribution to the formation of scale in boilers together with the precipitation of calcium carbonate whose solubility also decreases when CO2 outgasses from hot water or otherwise can escape out of the system (https://en.wikipedia.org/wiki/Calcium_sulfate). The ocean is a vast reservoir of carbon, and the amount converted to carbon dioxide and transferred slowly to the atmosphere, are affected by abiotic as well as biotic processes. Perhaps half of the 02 emitted to the atmosphere, and CO2 absorbed from the atmosphere, are from phytoplankton, marine biota that underpin many food chains and cycle CO2 into O2.
There is poor appreciation of the role of calcification, which is the focus of this paper. This largely biological process, one favored by warming, gave the massive carbonate deposits including the white cliffs of Dover formed from biological calcification in the oceans millions of years ago, and the modern Great Barrier Reef visible even from outer space, but there is little understanding of the associated ocean abiotic chemistry and how this might affect atmospheric CO2. Remarkably, limestone as a geochemical product of calcification is inherently biological in its formation. It is frequently assumed that the isotopic composition of the carbon in CO2 of air distinguishes its origin as from the ocean, forests or fossil fuels. This error in part a consequence of ignoring important aspects of ocean chemistry, failing to distinguish between carbon that is from deep ocean upwellings versus carbon from the mixed uppermost layer of the ocean where temperature, salinity, and density are relatively uniform due to mixing driven by wind, waves, and convection.
The mixed layer is distinct from deeper waters where stratification (e.g. the thermocline) limits vertical mixing. The depth of the mixed layer will vary by location, season, and in particular conditions affecting the transport of energy and matter. A decreasing trend in δ13C in the atmosphere is claimed to indicate an anthropogenic source of carbon. By contrast, our TAC process could drive an equivalent δ13C reduction through dilution of air with 12CO2 enriched from surface seawater. The TAC hypothesis is primarily concerned with the redistribution of dissolved inorganic carbon (DIC) between carbonate, bicarbonate and CO2 forms, directly relevant to the formation of the biosphere’s great carbonate deposits. The TAC hypothesis considers both inorganic and biological processes. Phytoplankton operate at environmental temperatures in surface waters, their small size relative to surface area preventing warming by cellular metabolism. It is relevant that the enzyme carbonic anhydrase in surface seawater can increase the rate of interconversion between inorganic bicarbonate and CO2 in water by orders of magnitude, having also been shown to catalyze the dissolution of calcite in seawater in winter. This is an area for future research not specifically discussed in this paper.
Thermodynamic Modeling
We modelled seawater carbonate equilibria in Figure 2 using temperature-dependent constants (Henry’s coefficient K0, dissociation constants for H+ of K1 and K2, and solubility product Ksp for CaCO₃) using the proven algorithms summarized by Emerson and Hedges [4], such as from Mucci [5]. All these reactions are reversible and two involve either the release or the absorption of acidity as hydrogen ions (H+) (Figure 2). Our assumptions included a mixed layer depth of approximately 65 meters, representing the average seasonal mixing zone in the North Pacific where TAC-driven calcification and CO₂ outgassing occur, with salinity of 35 psu and atmospheric pCO2 of 420 ppmv. Any process of strong acidification of surface seawater will raise the concentration of carbon dioxide as [CO2] available to marine algae, including phytoplankton, for photosynthesis. Bicarbonate cannot be a direct substrate for Rubisco, although the presence of the enzyme carbonic anhydrase speeds up its interconversion to hydrated CO2. Our modeling analysis confirmed [3,6] that CaCO3 precipitation is strongly favored by warmer temperatures, shown below in Table 1.
Table 1:Outputs of estimated variation with temperature of equilibrium constants used for modeling surface seawater at pCO2 air 420 ppmv

Table 2:Van’t Hoff equation outputs of standard enthalpy, Gibbs energy and entropy changes for the K1 and K2 equilibria.

All the reaction equilibria in seawater are displaced by warming, acidifying the water, as shown in Figure 2. The equilibrium between CO2 concentration and pCO2 in air favors a lower concentration [CO2] in water in summer, compared to winter, when it is greatest (Table 1). Our results even confirmed that the formation of CaCO3 as calcite is predicted to increase in summer as water becomes warmer (Table 1b) and Ksp decreases. Thus, we predict more limestone formation in summer if the carbonate concentration reaches a sufficient level, caused by warming. The decline in average pH values in surface seawater to about 8.05 from pH 8.20 would explain the increased pCO2 in the atmosphere of 140 ppmv since the industrial revolution as a matter of dynamic equilibrium. If caused by calcification, this would require a simultaneous equivalent deposition of limestone as sediment, though only a global increase of about 10 μmoles per kg of surface seawater, or a net 1 mg per kg each year, a function of increasing temperature. This is a key prediction of our TAC hypothesis that can be tested experimentally in seawater.
An important feature of CaCO3 formation needing explanation is acidification. Removal of CO3 2- ions by precipitation displaces the equilibrium to generate even more acidification by extra H+ than that from dissolving CO2 alone in forming bicarbonate and carbonate. Each precipitation of a μmole of carbonate will reduce pH values by an equivalent amount. Even if calcite is not visibly formed, the fact that much of the surface layer in oceans are measured to be supersaturated with CO3 2- ions suggests that the activity of Ca2+ ions is diminished by binding to CO3 2- ions when the sea is warmer. Warmer water also dissociates water clusters, diminishing the shielding of Ca2+ ions from negatively charged carbonate and thus promoting acidification from bicarbonate dissociating a proton (H+), forming carbonate. This process of calcification is important for much photosynthetic life in the ocean since it raises the concentration of CO2, equivalent to a fugacity equal to 7 ppmv pCO2 in air for each fall of 0.01 pH units, an output of our thermal model [3,6].
This is our acid-calcification thermal (TAC) hypothesis. It is sufficient to explain the seasonal changes in pH and pC02. The Km concentration value for the enzyme absorbing CO2 known as Rubisco, the most common protein on Earth, is about the same as that of the concentration [CO2] in air and seawater, so any increased value speeds up photosynthesis. Without calcification, much photosynthetic life in seawater would cease for lack of sufficient CO2 for Rubisco from bicarbonate, explained by McConnaughey and Whelan [7]. We emphasize here the abiotic thermodynamic responses shown in Table 1, but calcite formation is promoted by phytoplankton taking advantage of these responses, contributing significantly to the net accumulation of CaCO3 equivalent to the net emission of CO2 to the atmosphere, that we have discussed previously. For example, coccolithophores excrete platelets of calcite to their surface, having benefited from increased [CO2] from acidification for their rate of photosynthesis. Once sedimented, these oil- containing exoskeletons may contribute to future fossil carbon products.
Data Sources
Seasonal pCO2 and pH data were sourced from the ALOHA Station [8] and WHOT measurements [9]. Keeling Curve data were obtained from NOAA/ESRL and Scripps Institution of Oceanography.
Seasonal and Long-Term CO₂ Dynamics
The Keeling Curve on Mauna Loa exhibits a 6 ppmv seasonal oscillation, peaking in late winter and troughing in October (Figure 1). We claim this reflects ocean outgassing rather than terrestrial plant growth cycles. In the TAC model (Figure 2), warming in spring- summer drives CaCO₃ precipitation, lowering pH and raising seawater equilibrium pCO₂, peaking in summer. CO₂ emits to the atmosphere in autumn-winter, exceeding spring reabsorption, yielding a net annual increase of ~2 ppmv.
Thermodynamic Support
Table 1a shows equilibrium constants shifting with temperature: The Henry coefficient (KO) is almost halved by over a 20oC increase in temperature. The pK values near pH 6 and 9 where [CO2] and [HCO3-] or [HCO3-] and [CO32-] respectively are of equal concentration both decline with temperature at a similar rate, showing K1 and K2 values increase (i.e., more acid). The solubility product shows a maximum near 285 K, being less soluble in seawater either warmer or colder than this temperature (Table 1b). This facilitates the solubility system Ω factor as ([Ca2+]x[CO32-]/Ksp) reachingan activity quotient greater than 1.0, signaling precipitation [3]. Van’t Hoff analysis (Table 1b) to measure changes in equilibrium constants (K2/K1) from variations in enthalpy (ΔH) showed that all reactions favored in summer are endothermic, absorbing heat at higher temperatures, cooling surface seawater. In winter when the reverse reactions are favored there will be a tendency to warm seawater slightly, these thermal effects being a good demonstration of Le Chatelier’s principle. When environmental conditions force reaction in one direction, natural processes tend to oppose such changes.
Observational Evidence
ALOHA data reveal a pH decline of 0.003 units per year [8] and larger seasonal swings of 0.04 units, with maximum seawater pCO2 coinciding with minimum pH (Figure 3) [8]. The ALOHA or HOT data in particular shows this seasonal variation in pH values of 0.04 units in seawater, with matching between minimum pH and maximum fugacity of CO2 in surface seawater (Figure 3). Our modeling indicates that absorption of CO2 alone is unable to explain the decreased pH value abiotically from this cause. Significant calcification removing more CO2 from the atmosphere is needed to explain the additional [H+] increase and pH changes involved. TAC hypothesis confirmation needs a field demonstration that additional CaCO3 precipitation is occurring each year, with more formed in summer than is decalcified in winter, in agreement with the Ksp predictions. Obviously, the extent of this process will be a function of the seasonal variation in surface seawater temperature.
We have expressed this according to the Ψ (psi) equation, following a similar suggestion by Smith [10] investigating whether the oceans were a net source or a sink for CO2, showing variation with depth rather than seasonal variations in temperature. Published data (Figure 4) confirms higher seawater pCO2 than for air in autumn-winter, supporting net emission. The ALOHA or HOT data in particular shows this seasonal variation in pH values of 0.04 units in seawater, with matching between minimum pH and maximum fugacity of CO2 in surface seawater (Figure 3). Our modeling indicates that absorption of CO2 alone is unable to explain the decreased pH value abiotically from this cause. Significant calcification removing more CO2 from the atmosphere is needed to explain the additional [H+] increase and pH changes involved, consistent with our TAC hypothesis. Its confirmation needs field demonstrations that additional CaCO3 precipitation occurs each year if global temperature increases, with more formed in summer than is decalcified in winter, in agreement with the Ksp predictions.
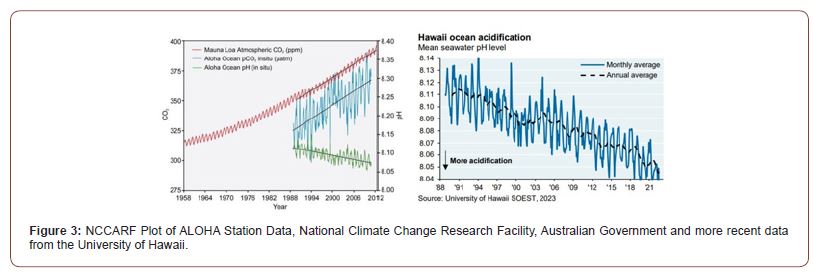
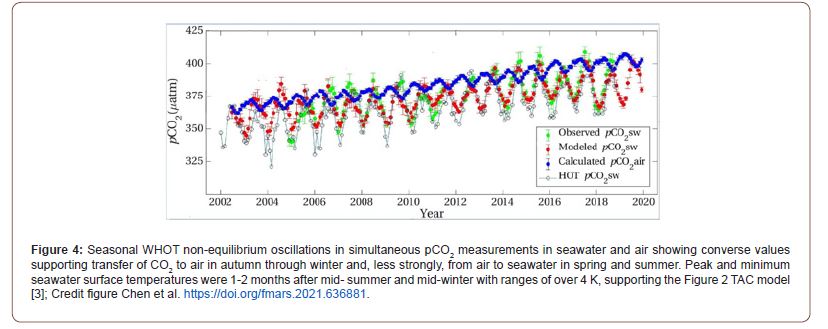
Obviously, the extent of this process will be a function of the seasonal variation in surface seawater temperature (Figure 4). The 18-year seasonal WHOT data of Chen et al. shown in Figure 4 [9] confirms this seasonal variation in fugacity of CO2 in the northern Pacific, even showing that values in surface seawater exceed that in air for several months each year, speeding up transfer when the greatest differences occur between the phases at highest temperature.
Isotopic Considerations
Our model assumes calcification across the ocean’s mixed layer that we define as above 65 meters in depth. Our model does not consider carbon from upwellings. The ocean’s dissolved inorganic carbon (DIC) is more usually, at least in climate models, treated as a uniform pool with a δ13C of ~0‰ to +2‰ (from marine carbonate equilibrium), averaged across depths to include surface layers and upwellings. The IPCC and others assume CO₂ absorbed into surface waters reflects this, acting as a sink that slightly raises atmospheric δ13C (counteracting fossil fuel’s -25‰ pull). Outgassing, they argue, is minimal and isotopically neutral, so fossil fuels dominate the observed -6.5‰ to -8.5‰ shift. If surface waters—where TAC’s calcification happens—have a distinct δ13C content from that in deep oceans, and if warming drives outgassing from this surface layer, the IPCC’s assumption needs revision. In particular, surface processes, not only calcification but also photosynthesis by phytoplankton, would enrich 12C in outgassed CO₂, lowering atmospheric δ13C delta more than deep ocean signatures suggest, mimicking fossil fuels. Note the equivalence predicted for CaCO3 formation and net CO2 emission. This hypothesis proposes a self-regulating system for control of atmospheric CO2 by surface seawater pH that needs testing.
Key Future Research to Test the TAC Hypothesis
a) Field Validation of CaCO₃ Deposition Rates
Objective: Test the TAC prediction of an annual CaCO₃ deposition of ~10 μmol/kg in surface seawater, linked to the 2 ppmv atmospheric CO₂ increase.
Approach: Conduct nearshore sediment core analyses and direct measurements of surface calcification rates in key ocean regions. We suggest this research be focused on both the northern Pacific at Aloha, Hawaii, and at the Great Barrier Reef that is the largest coral reef ecosystem, and on the western margin of the South Pacific. There is a need to quantify seasonal and yearly limestone accumulation in the mixed layer (~65 m depth) from biotic and abiotic sources.
Why: Confirms the model’s core claim that calcification drives CO₂ emissions stoichiometrically. Current estimates lack empirical backing, making this a critical gap.
b) Seasonal CO₂ Flux Measurements
Objective: Verify TAC’s explanation of Keeling Curve oscillations via ocean outgassing rather than terrestrial cycles.
Approach: Deploy high-frequency pCO2 sensors in surface seawater and air across seasons, focusing on marine-dominated regions (e.g., central Pacific and Great Barrier Reef). Correlate with temperature, pH, and calcification rates.
Why: Challenges the photosynthesis-respiration narrative. Data showing peak seawater pCO2 driving atmospheric rises (autumnwinter in each hemisphere) would support TAC.
c) Isotopic Analysis of CO₂ Sources
Objective: Distinguish ocean-derived CO₂ from fossil fuel emissions using isotopic fingerprints (13C/12C ratios).
Approach: Measure δ13C in atmospheric CO₂ near marine stations during peak outgassing (autumn-winter in both hemispheres) and compare to fossil fuel signatures. Assess whether TAC’s predicted enrichment from seawater holds up.
Why: The IPCC consensus argues fossil fuels explain the isotopic shift. Robust data could bolster TAC’s claim of a significant ocean source.
Implications
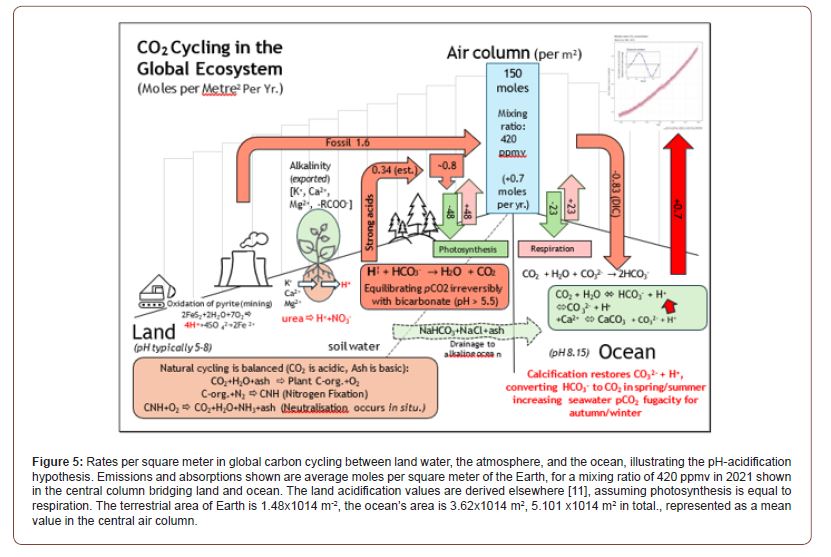
The IPCC attributes the Keeling rise to fossil fuel emissions, approaching 10 GtC/year; oceans are considered a sink for about half of this. The TAC model suggests a natural source: warminginduced calcification releases ~4.26 GtC per year (2 ppmv), though this needs regional adjustments for emissions on land and sea [10] amplified by ocean feedback. The seasonal oscillations (Figure 1), traditionally tied to terrestrial processes of photosynthesis and respiration, align better with marine temperature cycles near Mauna Loa (Figure 4). If the TAC Hypothesis and processes shown in Figures 2&5 were validated, then the logical conclusion is that ocean warming—regardless of cause—drives CO₂ increases in air, challenging widespread mitigation strategies focused solely on emissions as futile. The predicted net CaCO₃ deposition (~1 mg/kg surface seawater/year) is small but testable, including via sediment analysis.
In Figure 5 we present our current estimates of CO2 cycling globally, per square meter of the Earth’s surface. These numbers will be justified in more detail in an article in preparation. The key statistic is the 0.7 increase in atmospheric carbon dioxide measured as moles per meter squared per year, from surface ocean waters as an output from our modeling. In all of this it is important to consider the total ocean reserve of carbon as the IPCC modeling does, and C02 cycling as a distinct process within the global ecosystem. In this way it is possible to calculate a global budget for C02 as we have done. It may not always be realized by physicists, who perhaps dominate discussions concerning the physical basis of climate change, that C02 is continually produced and destroyed naturally near the Earth’s surface. Indeed, chemistry is much more complicated and reactive than the radiative climate models that currently dominate thinking.
Conclusions
The TAC hypothesis offers a plausible alternative to the fossil fuel-driven Keeling curve narrative, emphasizing ocean calcification as a CO₂ source. Field measurements of CaCO₃ deposition and isotopic fluxes are critical next steps. This work underscores the need to revisit natural carbon cycle feedback in a warming climate. The thermal acid-calcification (TAC) hypothesis proposes that warming-induced calcification in the ocean’s surface mixed layer (65 m) contributes significantly to the Keeling Curve’s observed 2 ppmv annual increase in atmospheric pCO₂ (4.26 GtC/year). Our thermodynamic modeling indicates that temperature-driven shifts in carbonate equilibria release CO₂ at rates consistent with this rise, potentially augmented by biotic processes if nutrient sources of nitrogen and phosphorus are available, while fossil emissions may be fully absorbed by oceanic and terrestrial sinks shown in Figure 5. Seasonal pCO₂ oscillations, conventionally linked to terrestrial carbon cycling, correlate with marine outgassing patterns at stations such as ALOHA, suggesting this oceanic driver.
The observed decline in atmospheric δ13CO2 compared to a standard (-6.5‰ to -8.5‰) could reflect dilution by processes favoring net 12CO2 emission, caused by calcification processes in the mixed layer. Validation requires field measurements—CaCO₃ deposition rates in warmed surface water, seasonal CO₂ fluxes, and δ13C profiles—at key sites (e.g., northern Pacific, Great Barrier Reef). These data could be used to test TAC’s premise that warming amplifies natural carbon feed backs, offering an alternative perspective on the global carbon cycle and its response to global warming from whatever cause.
To quantify temperature’s role in CO₂ release from acid calcification, we employ the Psi (Ψ) equation, adjusting stoichiometry to the range of seasonal thermal variations:
The Ψ Equation

The Ψ parameter scales CO₂ production with temperature range (e.g., 5-10°C annually near Mauna Loa), reflecting increased calcification under warmer conditions as opposed to depthdependent gradients [10]. To the extent in summer that temperature increases, the decreased pH value from the release of H+ ions increases the steady state concentration of [CO2], increasing its fugacity in seawater. Modeling showed that CaCO3 precipitation was accompanied by Ψ CO₃²⁻ of carbonate formation from bicarbonate, required to preserve the alkalinity of dissolved inorganic carbon. Given that phytoplankton are unable to generate an increased temperature from that of seawater by metabolism, because of their large surface area compared to their radial dimension, the equilibria shown in Figure 2 are dominated by varying seawater temperature as discussed elsewhere [3], whether considered biotic or abiotic. This dynamic seasonal and longer-term process, reversible by season, contrasts with static equilibrium models (e.g. K0 reduction over 20°C, Table 1a), emphasizing thermal energy’s influence on pCO₂
Observational data from ALOHA or WHOT [8,9] corroborate this — seasonal pH decreases (ca. 0.04 units) and pCO₂ increases align with elevated temperatures, driving CO₂ outgassing. The estimated ~0.7 mol per m2 CO₂ release (ca. 2 ppmv rise) hinges on this temperature-dependent mechanism, with biotic catalysis (e.g., carbonic anhydrase) potentially enhancing rates, though abiotic processes seeking equilibrium predominate in our current modeling framework, shown in Figure 2.
Acknowledgments
Our seasonal modeling depended on published algorithms [4] that reveal thermodynamic equilibrium constants for seawater change with temperature. The values estimated for Ksp near 4.2 × 10⁻⁷ for calcite employed in our thermal model are two orders of magnitude larger than those often given in textbooks for fresh water, with those for more soluble aragonite lower. The maturity of this physical chemistry research by dedicated oceanographers and their excellent analytical results made verification of our modeling predictions possible, using real world data from the northern Pacific [9,10].
We also acknowledge the assistance that peer reviewers and the editor of Thermo [6,7] provided. Our deciphering of the enigma of the ALOHA data [9,10] depended on knowing the strong seasonal non-equilibrium for the fugacity of CO2 in surface seawater and the atmosphere, a function of temperature and pH value. Publishing this hypothesis in Advances in Oceanography and Marine Biology, even as an Opinion, could seem a low bar for reviewing. Indeed, one key member of our team (JM) prefers not to be listed as a coauthor for an article in this journal. The hypothesis presented here depends entirely on peer reviewed publications by the authors and others. Readers are free to form their own opinion regarding its validity for experimental testing.
Corresponding author (IRK) however welcomes AOMB’s acceptance of this testable hypothesis by its editorial panel, claiming it as a plausible alternative cause for the increasing Keeling curve. It signals the urgent need for a fresh approach to research on the link between CO2 and climate change. To delay publication of an article potentially disruptive to the current IPCC global warming paradigm would be a failure in professional diligence. We acknowledge the essential contribution Jennifer Marohasy has made in helping bring forward this publication by emphasizing that the seasonal oscillation as a product of thermal conditions must also apply to global warming as a source of increasing pCO2 longer than seasonal.
References
- Keeling CD (2005) Atmospheric CO₂ records from Mauna Loa. Scripps Institution of Oceanography.
- Intergovernmental Panel Climate Change (2021) Sixth Assessment Report.
- Kennedy IR, Runcie JW, Zhang S, Ritchie RJ (2022) A New Look at Physico-Chemical Causes of Changing Climate: Is the Seasonal Variation in Seawater Temperature a Significant Factor in Establishing the Partial Pressure of Carbon Dioxide in the Earth’s Atmosphere?. Thermo 2(4): 401-434.
- Emerson S, Hedges J (2008) Chemical Oceanography and Marine Carbon Cycle. Cambridge University Press.
- Mucci A (1983) Solubility of calcite in seawater. Am J Sci 283: 780-799.
- Kennedy IR (2023) The Seasonal Keeling Oscillation in Atmospheric pCO2 is Caused by Variation in Seawater Surface Temperature. Examines Mar Biol Oceanogr 6(3).
- McConnaughey TA, Whelan JF (1997) Calcification generates protons for nutrient and bicarbonate uptake. Ear Sci Rev 42(1-2): 95-117.
- Dore JE, Lukas R, Sadler DW, Church MJ, Karl DM (2009) Physical and biogeochemical modulation of ocean acidification in the central North Pacific. Proc Natl Acad Sci U S A 106(30): 12235-12240.
- Chen S, Sutton AJ, Hu C, Chai F (2021) Quantifying atmospheric CO2 forcing on surface ocean pCO2 in the North Pacific. Front Mar Sci 8: 636881.
- Smith SV (2014) Carbon dioxide and the sea: A chemical and biological perspective. Oceanography 27(1): 88-97.
-
Ivan R. Kennedy*, John W. Runcie, Angus N. Crossan and Raymond J. Ritchie. Has Seasonal Ocean Calcification Been Overlooked as a Cause of the Increasing Keeling Curve? A Thermal Acidifying Calcification Hypothesis. Ad Oceanogr & Marine Biol. 4(3): 2025. AOMB.MS.ID.000590.
-
Keeling curve; carbon dioxide; bicarbonate; mauna Loa; calcite; calcium ions; calcification; carbonic anhydrase; acidification; CaCO3; iris publishers; iris publisher’s group
-

This work is licensed under a Creative Commons Attribution-NonCommercial 4.0 International License.


