 Research Article
Physiological Changes During Conscious and Unconscious Emotional Reactions in Persons with Temporal Lobe Epilepsy: A Pilot Study
Gerard van Erp1*, Johan Arends1 and Matthias Rauterberg2
1Department of Neurology, Kempenhaeghe/Maastricht University Medical Center, The Netherlands
2Department of Industrial Design, Eindhoven University of Technology, The Netherlands
M.G. van Erp, Department of Neurology, Academic Center for Epileptology, Kempenhaeghe/Maastricht University Medical Center, Sterkselseweg 65, 5591 VE Heeze, Postbox 61, 5590 AB Heeze, The Netherlands.
Received Date: October 27,2020; Published Date: November 23, 2020
Objective: To find out if there are subjective, autonomic and EEG differences between the emotional responses of patients with TLE and controls. Secondary objectives are to establish which modality is the most sensitive. Do implicit of explicit emoticons evoke stronger reactions, and does epilepsy surgery alter these responses.
Methods: We compared the emotional response to implicitly and explicitly induced emotions through movie clips of 12 patients with TLE, before and after epilepsy surgery, with those of controls. We looked at changes in EEG, heart rate and subjective experiences.
Results: Patents showed a greater arousal and a smaller dominance on subjective SAM scores, a greater variation in heart rate together with a reduced variation of parasympathetic activity and a greater increase in rhythmical activity in the EEG. Post-surgery changes consisted of a decrease in autonomic dynamics and a further increase in rhythmical activity in the EEG. The responses between the various types of explicit and implicit emotion start already before the specific movie clip begins, a reaction which can be interpreted as PAA. This PAA effect was more pronounced in controls than in patients.
Significance: This pilot emphasizes the importance of provoked changes in HRV in interpreting differences in activity of the autonomic system and its clinical consequences between patients with TLE and controls. It emphasizes also the importance of considering the -usually neglected- pre stimulus part of the trajectory in analyses of emotional responses.
Keywords:Temporal lobe epilepsy; Epilepsy surgery; Emotion; Autonomic nervous system; Heart rate variability; Predictive anticipatory activity
Abbreviations:AED: Anti Epileptic Drug; ANS: Autonomic Nervous System; FFT: Fast Fourier Transform; HR(V): Heart Rate (Variability); HF: High Frequency band; LF: Low Frequency band; MM: Mixed Model; PAA: Predictive Anticipatory Activity; PNES: Psychogenic Non-Epileptic Seizure; SAM: Self-Assessment Manikin; SUDEP: Sudden Unexpected Death in Epilepsy; TLE: Temporal Lobe Epilepsy
Introduction
Emotions play an important role in the provocation of epileptic and psychogenic non- epileptic seizures (PNES) and can be part of the seizure semiology. In both epilepsy and PNES, there is a high prevalence of comorbid mood disorders which are often described as the main factor contributing to poorer quality of life [1]. Especially in temporal lobe epilepsy (TLE), diverse emotional disturbances are described, that are connected with the involvement of the limbic system in this type of epilepsy.
Investigations in this field often concentrate on disturbances in recognition of facial emotions, which may hamper social integration [2]. Kotwas et al. [3] studied the impact of emotions in a more direct way by analyzing the changes in dermal conductance, a sympathetic function, during movie clips in patients with epilepsy and PNES. They found weaker responses for the emotions, fear, sadness and happiness, in patients with epilepsy, compared to controls.
When patients with medical intractable temporal lobe epilepsy (TLE) are subjected to epilepsy surgery, changes in emotional reactions can occur. Amlerova et al. [4] found impairment of emotional cognition and social cognition in patients with TLE but could not find consistent changes after epilepsy surgery. In our hospital, extensive cognitive testing is carried out before and after surgery, but we do not systematically test emotional responses. So, there are many reasons for developing new methods for directly testing emotions in the epilepsy field.
There has been extensive research on heart rate variability (HRV) in relation to epilepsy. A decreased parasympathetic activity in epilepsy is claimed [5,6], but results are not consistent. The same is true for the effect of epilepsy surgery: Persson [7] found no differences in HRV-parameters, while Dericioglu et al. [8] found an elevated sympathetic tone and an increased LF/HF (sympatheticparasympathetic) ratio.
The cause of the changes is also a matter of debate. Epilepsy as such and ictal effects have been mentioned, as well as the effects of anti-epileptic drugs (AEDs) and psychological comorbidity. Carbamazepine, in particular, may have a strong effect on the autonomic system, but the literature is not consistent: Persson et al. [9] found an effect of carbamazepine on autonomic cardiac control, but Harnod et al. [10] did not.
The present study began as an extension of work carried out by the Department of Industrial Design of the Eindhoven University of Technology (TU/e). They tried to analyze and categorize various types of conscious or explicit and unconscious or implicit emotion provoked by stimuli; first by pictures, later by movie clips [11]. Following the dimensional model, the explicit emotions are spaced over 2 axes: positive vs negative and activation vs deactivation [12]. They used subjective scores and physiological parameters based on heart rate (HR), heart rate variability (HRV) and changes in dermal conduction. These measured signals are primarily controlled by the autonomous nervous system (ANS) although the stimuli are processed by the central nervous system (CNS). To understand the relationship between ANS signals and CNS signals we included in this study EEG as well.
The objectives of this study are to find out if there are subjective, autonomic and EEG differences between the responses of patients with TLE and controls, and in what way does this change following epilepsy surgery. A further aim is to find out whether the EEG provides a higher discriminative potential than the other signals.
Secondary objectives are to establish whether HRV is more sensitive than HR alone, whether the EEG merely shows arousal or a more specific response, and whether implicit or explicit emotions display stronger reactions.
Materials and Methods
We enrolled consecutive patients with TLE accepted for presurgical video-monitoring in Kempenhaeghe hospital. Those with concomitant diseases affecting the autonomous system or with psychiatric disorders were excluded. Patients were asked to recruit a control from their environment. 13 Patients with TLE were included for registration. In one case there were problems with the triggering pulses resulting in 12 valid registrations as planned. 13 Controls were included, also resulting in 12 valid registrations. Patients and controls signed informed consent forms (Appendix Table 1a and Appendix Table 1b).
Table 1:Movie clips explicit emotions.

Table 2:Movie clips of implicit emotions.
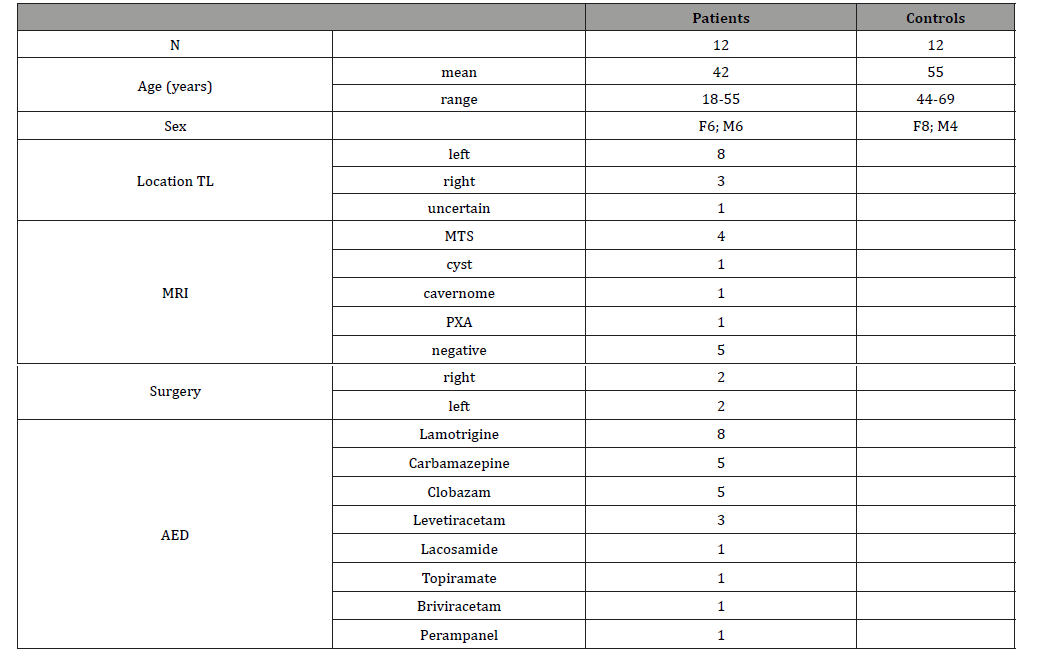
3 Patients were referred directly for surgery; in 1 patient, electrocoagulation was carried out; when this proved unsuccessful, surgery followed. These 4 patients were followed up 1 year after surgery and the results compared with those at first registration.
Table 1 presents the characteristics of those included. In most cases, patients asked their spouse to be the control, but some younger, unmarried patients chose one of their parents, usually their mother. For this reason, the average age of the controls was somewhat higher than that of the patients. We checked correlation between age and the different parameters and found low determination coefficients, usually below 0.03. The table also shows that left-sided temporal epilepsy is overrepresented (Table 1).
Table 3:Demography of patients and controls.
The protocol used to induce emotions was the same as used in the TU/e study; it is described by Ivonin et al. [11]. It consists of 36 movie clips, 3 examples of 12 categories each with a duration of 1 minute. The categories are divided into 5 explicit emotional and 7 implicit emotional clips (table 2). Following the dimensional model the explicit emotions are split up over 2 axes: positive vs negative and activation vs deactivation [12]. They were projected in random order (Table 2).
Table 4:The 12 categories of emotions and the abbreviations used.

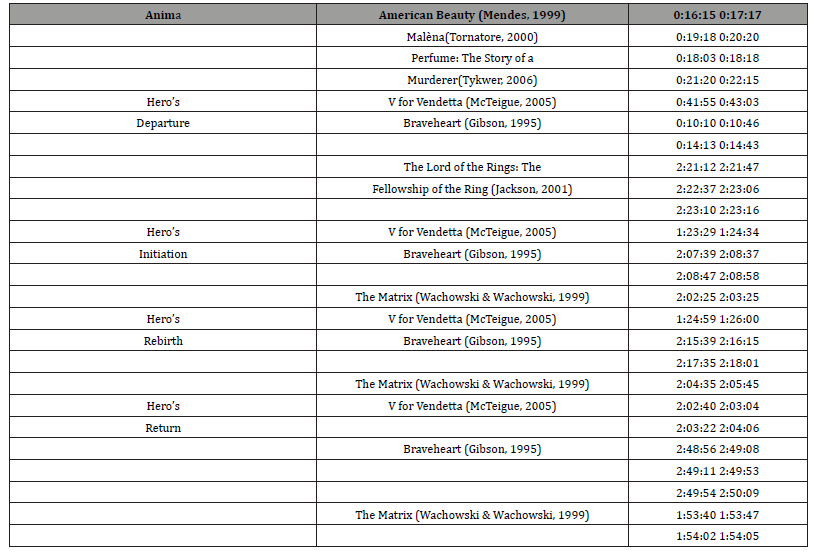
A table with the actual movie clips used is shown in Appendix A.
The movie presentation schedule is as follows:

Registration of patients was carried out during pre- surgery video-EEG/ECG monitoring. Recording was during day 2 of the monitoring. At that time, a start had been made to tentatively reduce antiepileptic medication and no seizures had yet occurred. Controls and post-surgery patients were registered in the EEG-lab for routine EEG-recordings. During the first year, post -surgery antiepileptic medication was not altered. For both patients and controls, 24 EEG-channels were used for analysis, sampled at 256 Hz as well as a standard ECG registration. During the EEG, 36 movie clips were presented, each with a duration of ca 60 sec (figure 2). Between the fragments there was a 20 sec pause for the subject to fill out a self-Assessment Manikin (SAM) score form [13], followed by a 20 sec presentation of a relaxing animation of respiration. The whole registration took ca 70 min. At the start and the end of each movie clip, a trigger signal with the number of the clip was sent to the EEG computer.
The registration was inspected for quality and stored on a server. From there it was transferred to a Matlab environment where further analysis took place.
The results of ECG- and EEG-analyses are mainly represented as figures. Some are presented in the article itself, a greater part can be found in the appendix A, numbered according to the sections.
Heart rate analyses
The ECG channel was transformed to a file with inter beat intervals (NN) by means of a QRS detection module. The NN -file was led to the HRVAS-module [14], where visual inspection took place and outliers were corrected. The corrected interval curves were transformed to heart rate curves and normalized by dividing by the average heart rate of the segment. The standard frequency and time domain parameters were calculated as recommended by the task force of the European Society of Cardiology and the North American Society of Pacing and Electrophysiology [15]. Using Fast Fourier Transformation (FFT) of the NN-intervals, a power distribution as function of frequency was obtained. Two bands were studied: the low frequency band (LF, 0.04-0.15 Hz) and the high frequency band (HF,0.15-0.4 Hz). LF components result predominantly from sympathetic effects on HRV; HF components are due mainly to the effects of the parasympathetic system on HRV [8]. Using time-frequency analysis, the time courses of the varying LF and HF activities during the registration interval were considered. The curves of this time-frequency analysis of the HF and LF bands were normalized, the HR, LF and HF curves of the 12 different types of movie clips were averaged for the 12 patients and 12 controls resulting in 3 X 144 average curves.
The curves of patients and controls for the explicit and implicit emotions were averaged resulting in 3X4 curves.
Two time domain measures of HRV were calculated: the SDNN (the SD of all NN-intervals) and the RMSSD (square root of the mean of the sum of the squares of differences between adjacent NN intervals). The SDNN is a global measure taking into account all components contributing to HRV, The RMSSD provides a useful estimate of HF variations of HRV and is considered an acceptable measure of the HF component of HRV [15].
EEG analyses
The Matlab toolbox EEGLAB [16] was used to process the EEG data. Independent Component Analysis (ICA) was applied to detect and remove components due to eye movements, blinks and muscular artefacts. The EEG traces were then segmented in periods of 25 sec before, and 65 seconds after the trigger marking the start of the movie clip.
Using newtimf.m in the EEGLAB, the Fast Fourier Transform (FFT) approach was applied. The analysis estimated the significant event-related changes in the amplitude of the power spectrum across different times and frequencies. The FFTs were calculated over a period of 25 sec in steps of 500 ms throughout the epoch. The spectra were divided by the average spectrum during the 25 sec before the start of the movie clip. The final time-frequency matrix for each epoch was set to have 51 linear-spaced frequencies from 5 Hz to 15 Hz and 200 time stamps. Time-frequency curves were analyzed using the Study program of EEGLAB.
Statistical analyses
For statistical analysis, MANOVA for repeated measures and Mixed Models (MM) were used, as many measurements were carried out in the same patient / control. For direct comparison between HRV-curves of several types of emotion, paired T-tests were used (alpha < 0.05, two-sided)
For statistical analysis, MANOVA for repeated measures and Mixed Models (MM) were used, as many measurements were carried out in the same patient / control. For direct comparison between HRV-curves of several types of emotion, paired T-tests were used (alpha < 0.05, two-sided)
Results
Subjective scores
Just as with the original TU/e study, a significant effect of the clips on the Self-Assessment Manikin (SAM) scores could be demonstrated. The results are presented in Table 3.
Table 5:Statistics of SAM scores.

We see differences between the scores in arousal and dominance: patients have a higher arousal and, for implicit emotions, a lower dominance score than controls. The differences between explicit and implicit emotions are slight, but clearest for mood with a more positive score for explicit emotions.
Heart rate analyses
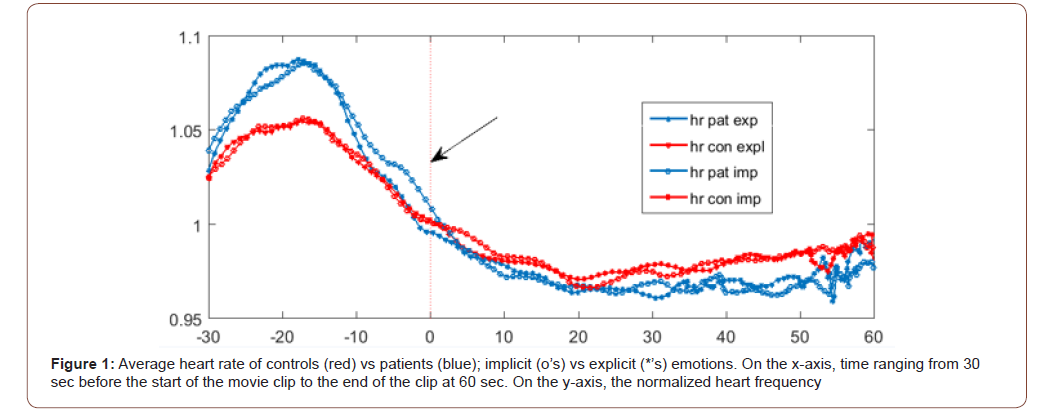
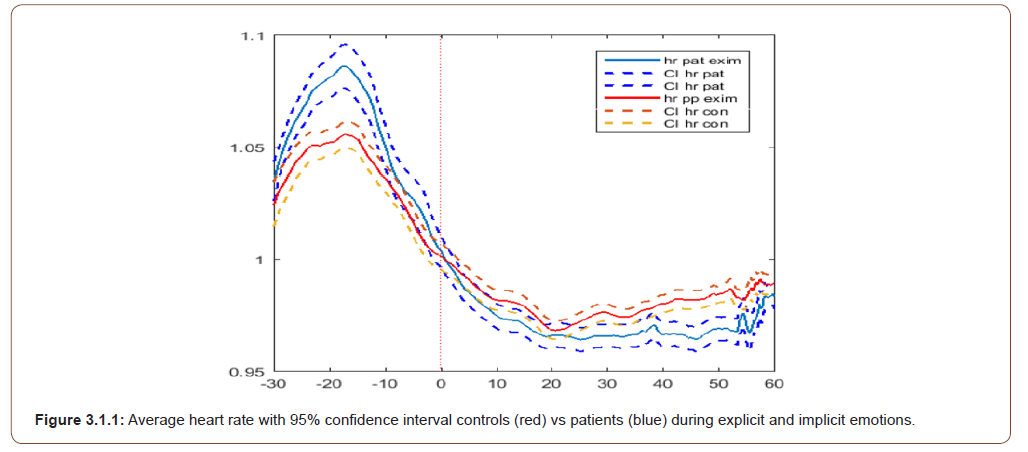
Figure 1 shows the average heart rate for patients and controls during explicit vs implicit emotions. The curve begins 30 seconds before the start of the movie clip. During this time there is a statistically significant initial rise in heart rate in patients and controls followed by a decline that continues during the movie clip. Patients show a statistically significant higher increase than controls. For implicit emotions, the decline shows some deviation (arrow). The decline of heart rate continues until the end of the movie clips for patients but shows an increase after 20 sec which is statistically significant for controls (see Table 4 and appendix Figure 3.1.1).
Table 6:Results of HRV analysis.
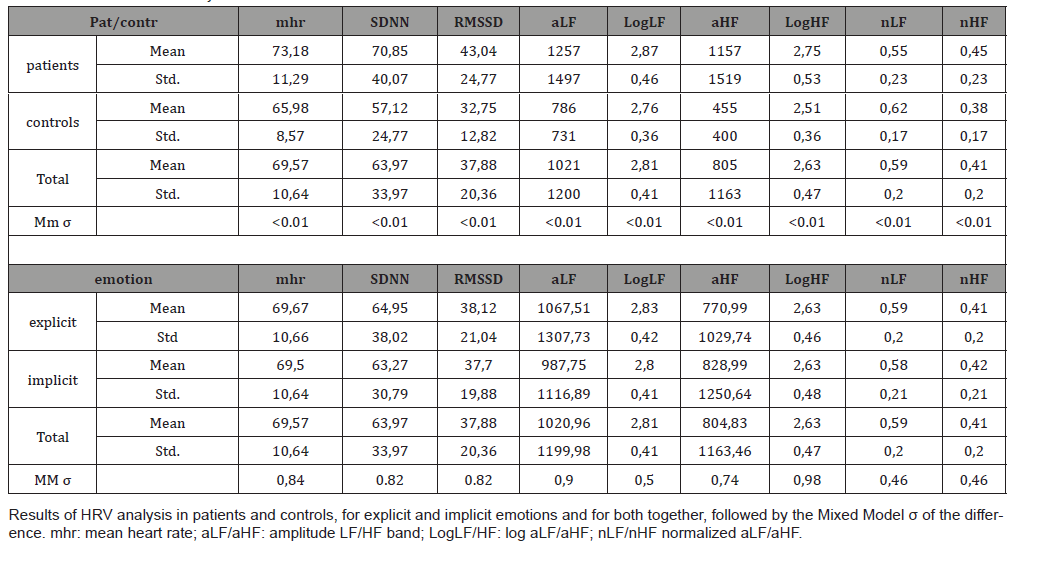
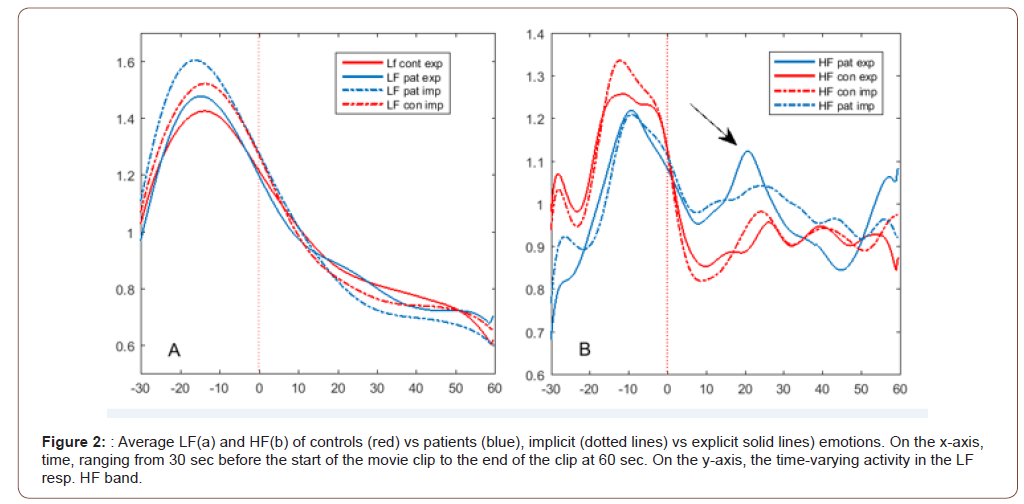
The quantitative results of the HRV analysis of the intervals are presented in Table 4. The analysis was carried out on the original as well as the normalized heart rate curves; the differences on the parameters other than the HR and RR intervals, were not significant, and so only the results of the not-normalized curves are shown. The differences in the HRV-parameters between controls and patients are all significant. Patients have a higher average HF(parasympathetic) and a lower LF (sympathetic) activity.
The RMSSD, a second measure of parasympathetic activity, is also higher in patients. We found no clear differences between explicit and implicit emotions (Table 4).
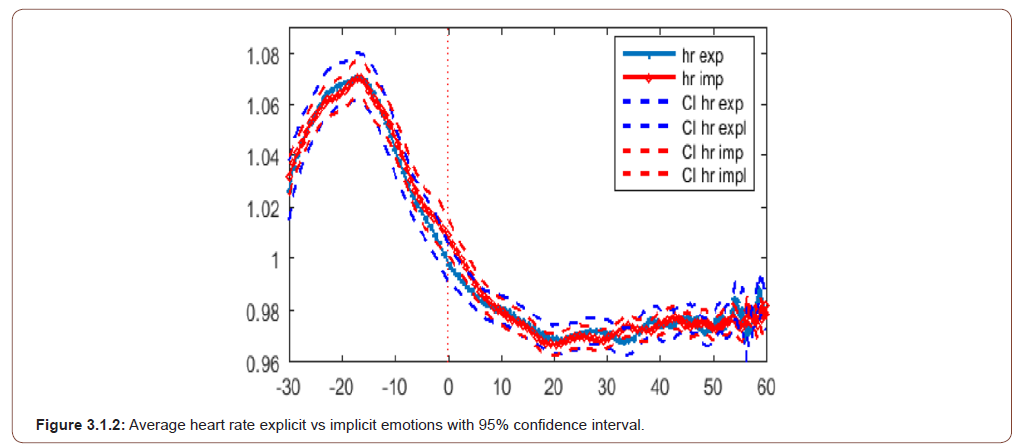
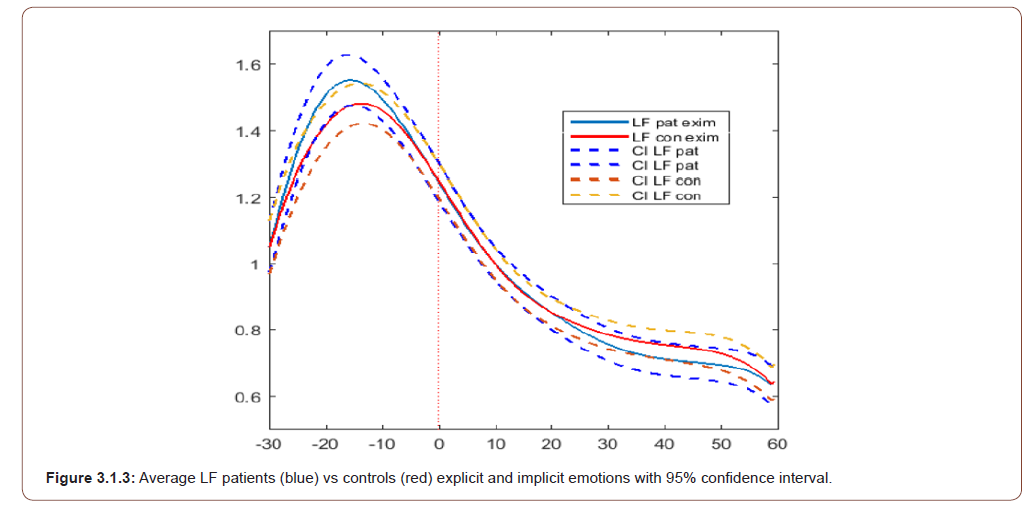
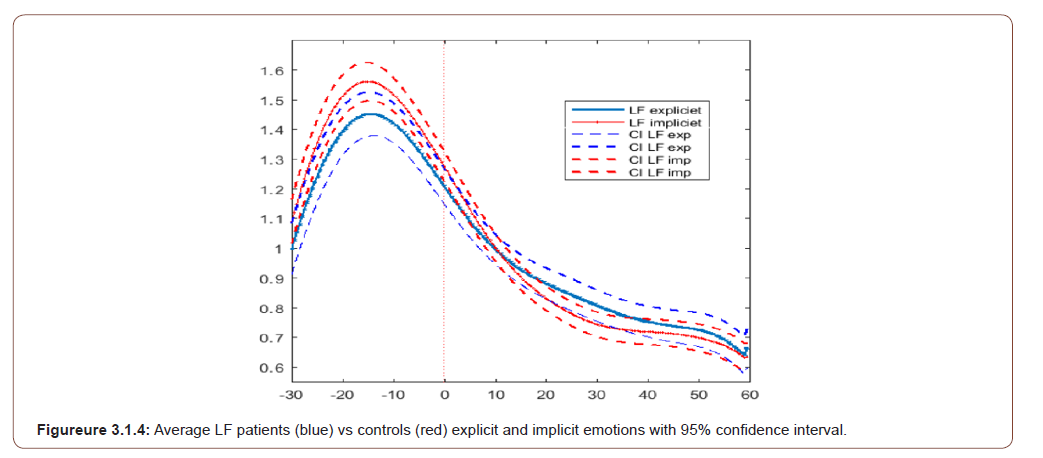
The course of HRV-activity in the Low Frequency (LF) and High Frequency (HF) band during the movie clip is depicted in Figure 2. Figure 2 a shows the activity in LF frequency band to explicit and implicit movie clips. In the explicit curve, the peak is higher and the decline steeper than in the implicit one. The Confidence Interval just overlaps (appendix Figure 3.1.3) but in Table 5, a p= 0.003 is computed. The differences between the curves start already before the movie clips begin and there is a certain symmetry over t=o where a higher peak is associated with a steeper decline. There were no clear differences between patients and controls. The differences in the amplitude of the peaks are summarized in Table 5 (Figure 3.1.2, Figure 3.1.3 and Figure 2).
Table 7:Statistics of HR, LF and HF peaks.
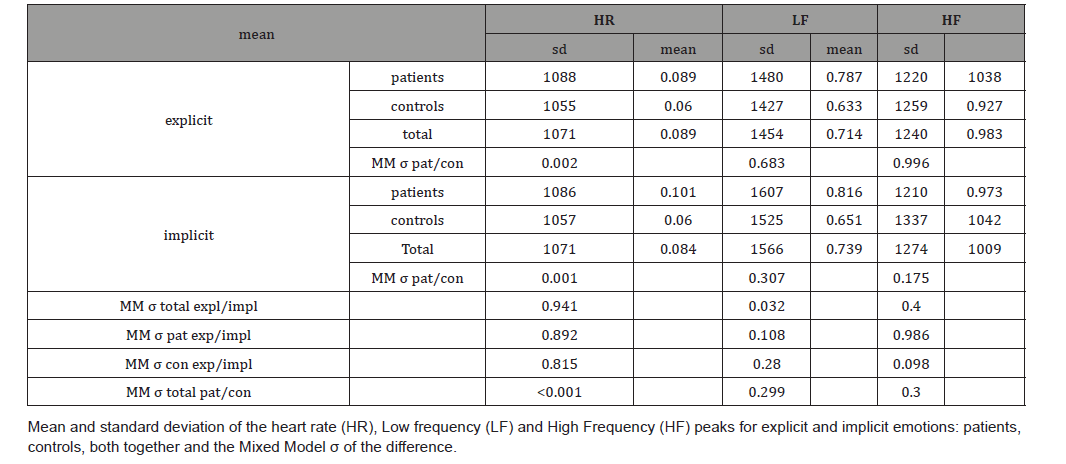
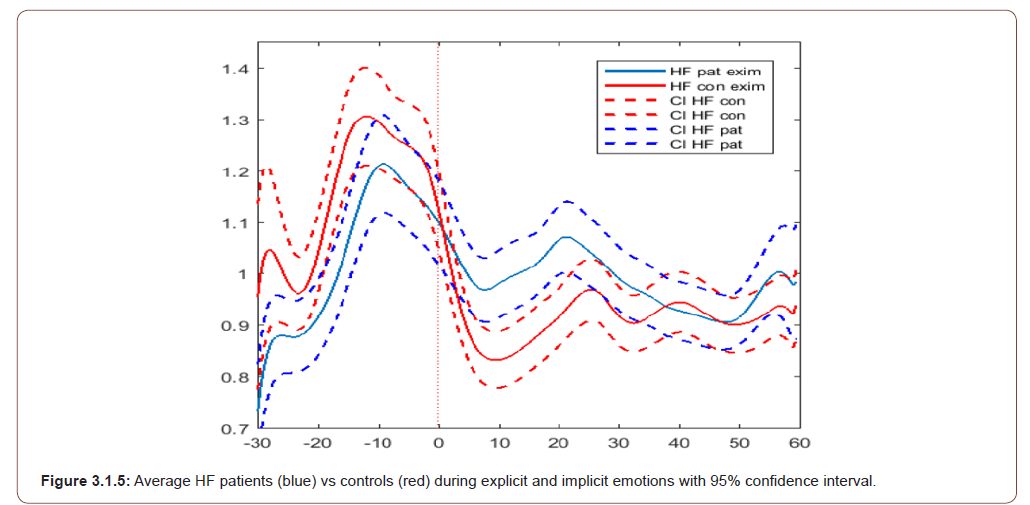
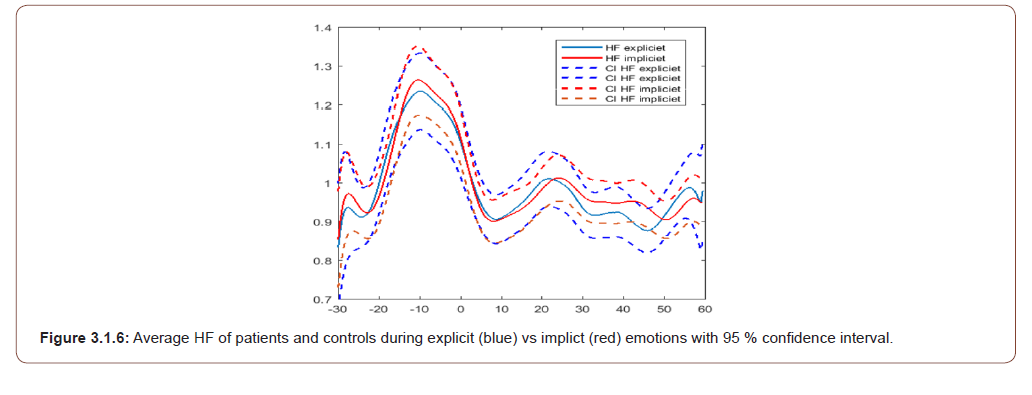
The results of the time-frequency analysis for the HF band are shown in Figure 2b.
The time course of the HF band for controls shows an increase and decline somewhat later than those of the LF with a longer plateau. The curve of the patients is less modulated with a lower and narrower increase and a smaller decline. There is a second top at ca 20 seconds, that is most pronounced for explicit emotions in patients Figure 3.1.4, Figure 3.1.5 and Figure 3.1.6).
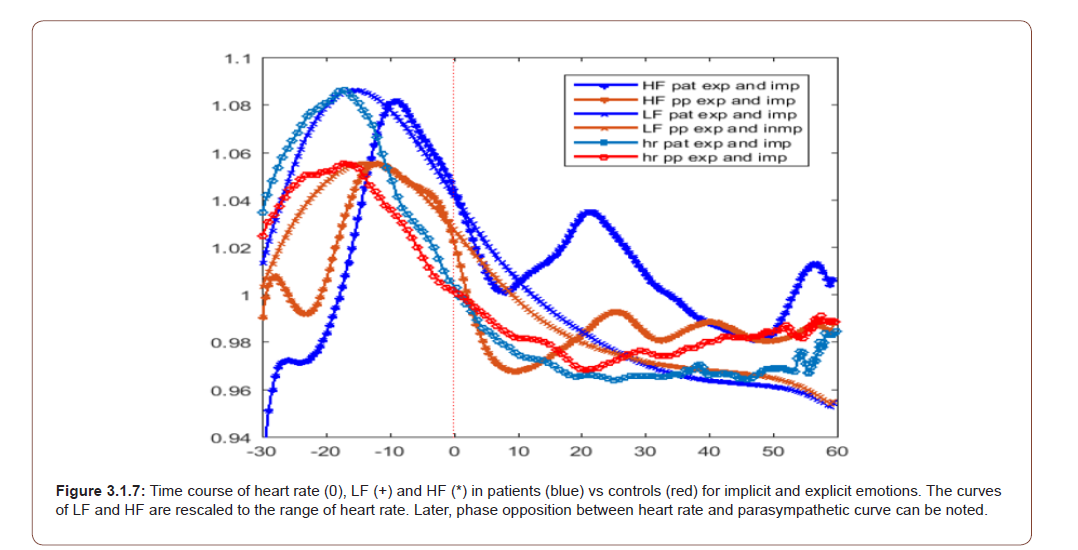
Activity in the HF band is usually considered to be linked to parasympathetic activity and that in the LF-band to sympathetic or mixed sympathetic and parasympathetic activity. Heart rate is under the control of sympathetic and parasympathetic influences. In the attempt to understand the coherence between heart rate and HRV-curves, we think that the increase in heart rate in patients is higher because of a smaller and later increase of parasympathetic activity; the continuing decline of heart rate in patients during the second half of the clip can be attributed to the smaller decrease in parasympathetic activity.: the LF- and heart rate curves initially overlap, but the curves are pulled downwards by the continuing parasympathetic activity. This is shown in Figure 3.1.7 of the appendix.
Rosenblueth at al. [17] tried to quantify these influences using stimulation and blocking experiments, producing the formula for steady state heart rate, HR: HR=m.n.HR(0)
where m is a factor representing sympathetic and HR(0) the intrinsic heart rate. They did not, however, quantify the dynamic response to stimulation. Therefore we could not fit the heart rate curves with the weighting factors of HF and LF bands.
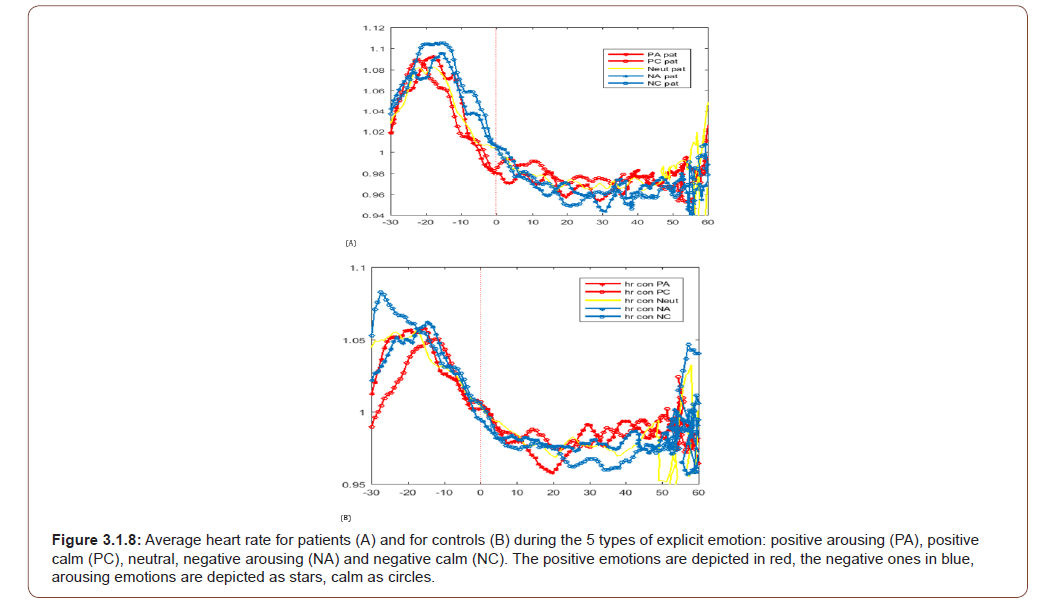
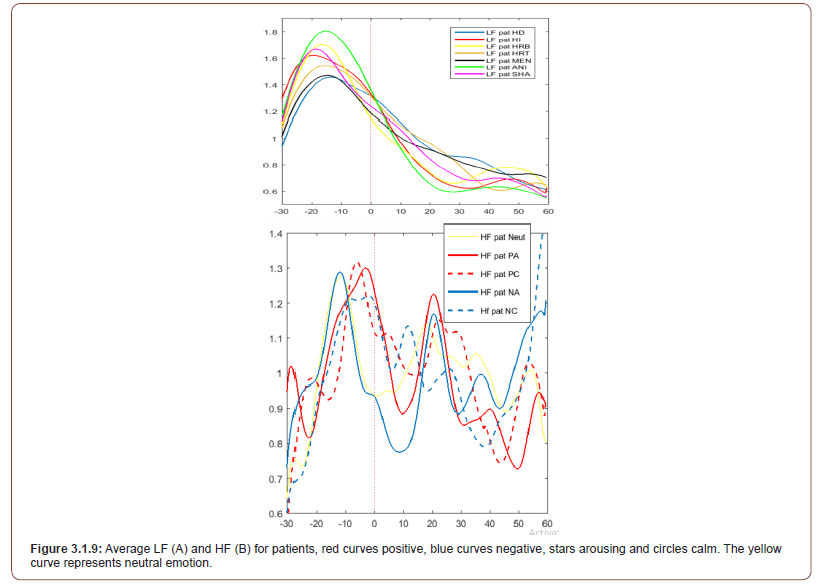
The heart rate- and HRV-curves on explicit emotions are not the same for the various types of emotion. We subdivided the responses by plotting the curves of the 5 different explicit emotions The results are shown in Figure 3.1.8 of the appendix. The heart rate shows an earlier decline for positive than for negative emotions (arrow), just as we saw for the explicit emotions fig 2 arrow (Figure 3.1.8 and Figure 3.1.9).
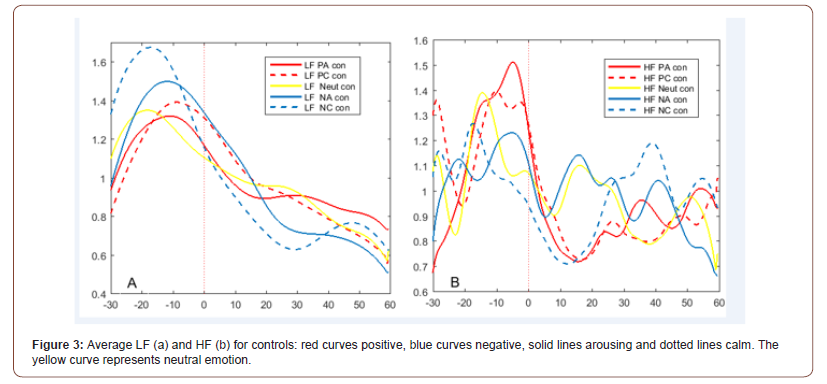
The HRV curves were also separated for the 5 different implicit emotions. The results for controls are shown in Figure 3.
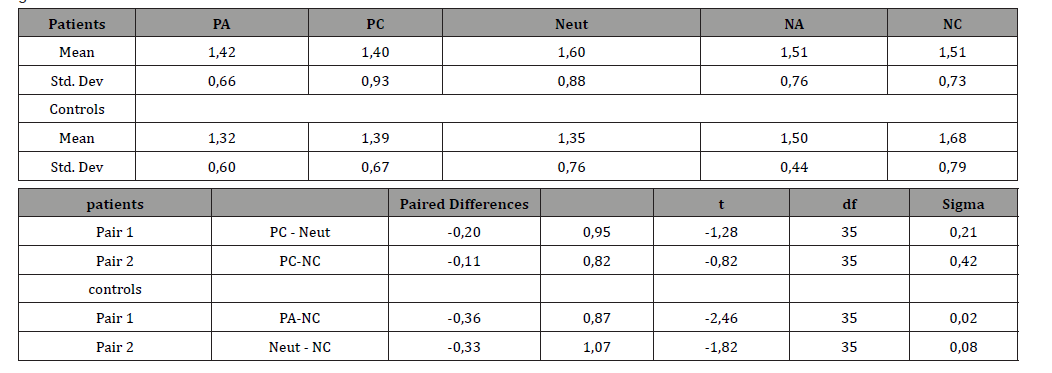
Here it becomes clear that the differences between the different emotions start already before the movie clip starts. Negative emotions show a greater increase and steeper decline in LF activity than positive emotions. In patients these effects are less clear. (See Appendix, Table 3.1.1a for the values of the mean amplitudes and their standard deviations.) For controls there is a significant difference between the PA and NC curves (p=0.02) (Table 3.1.1a).
Table 8:Statistics of amplitudes of positive peak of LF curves for explicit emotions and results of paired T tests for the peaks with the greatest differences.
We find the opposite results for parasympathetic activity: it is highest for positive emotions and higher for controls than for patients. The rise in parasympathetic activity at 20s is strongly correlated with arousing emotions. It is remarkable that, again in patients, this ‘arousing’ peak is higher than in controls. The curves show a certain symmetry with higher peaks during the pre-movie clip time corresponding with lower values during the movie clip.
When analyzing this aspect for the implicit emotions, we see the same effect, but to a lesser extent (Figure 3.1.10 appendix).
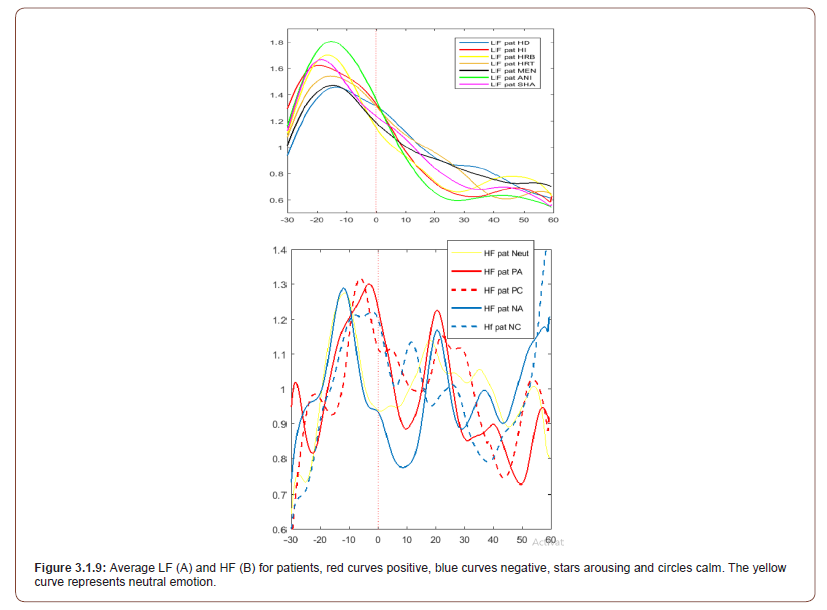
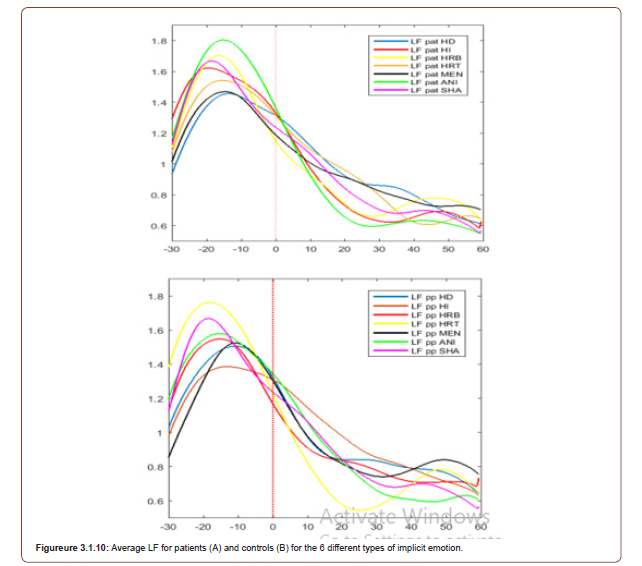
Table 9:Statistics of amplitudes of peak of LF curves for implicit emotions and results of paired T sample test for peaks for implicit emotions with the greatest differences.
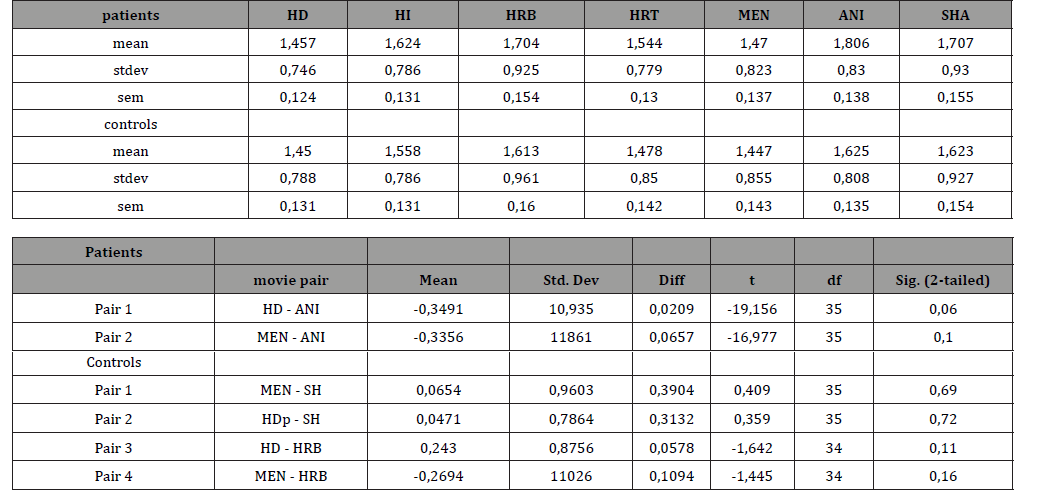
On paired T-test, the greatest difference had a p-value of 0.06. (Table 3.1.1b appendix).
EEG analyses
(Figure 4) The time-frequency analysis of channel F3 during the movie clips for explicit and implicit emotions is shown in Figure 4. Before the movie clip starts, there is a diffuse increase in activity. During the movie there is a modulating increase and decrease in activity in the alpha and theta bands. This is more pronounced during implicit emotions with a maximum at 20 seconds in patients and 45 sec in controls (encircled). The t-maps, scaled as p-values, only show statistical significance during parts of the increase at 20 and 45 seconds. At other EEG locations, the picture is more or less the same. For comparison of the t-maps, we used the t-score averaged over the whole map as a global measure of difference between time-frequency maps. This measure has the advantage that it covers the whole time frequency range, but the disadvantage that it has a somewhat ‘diluted’ value. The results are summarized in table 6 which shows the average t-score of 4 t-maps of difference (Table 6, Figure 3.2.1 and Figure 3.2.2).
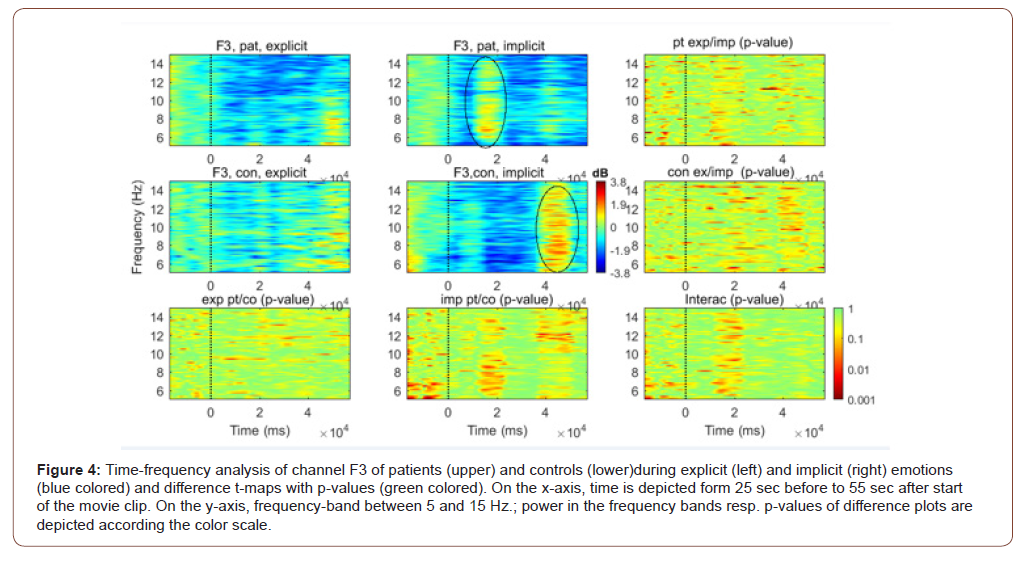
Table 10:Average t-scores of differences between time-frequency plots.

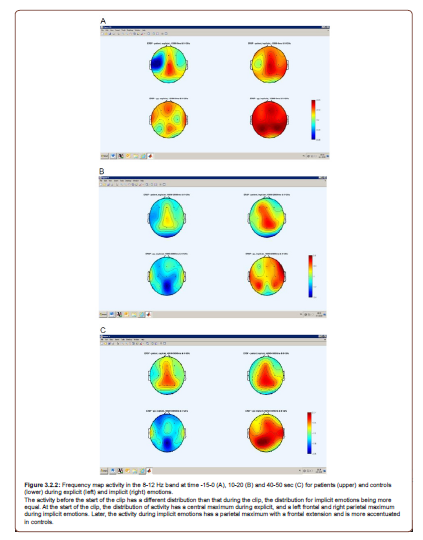
Table 11:
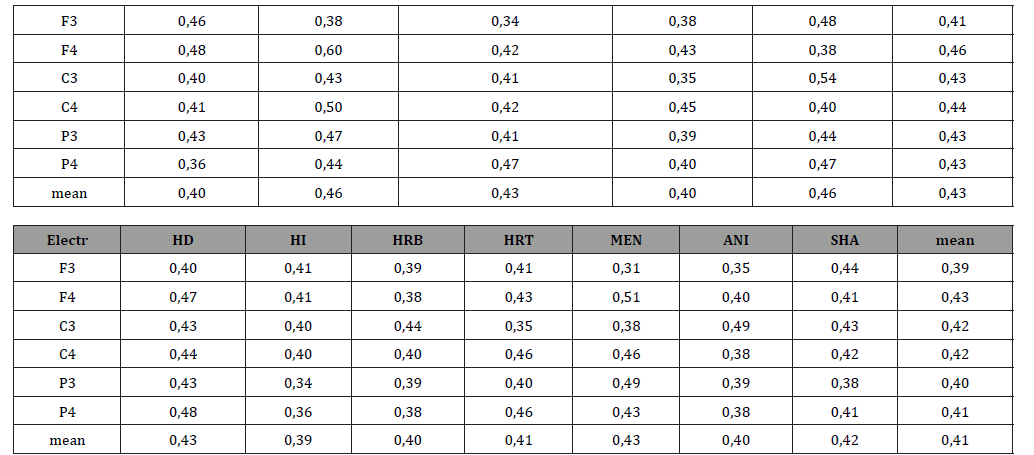
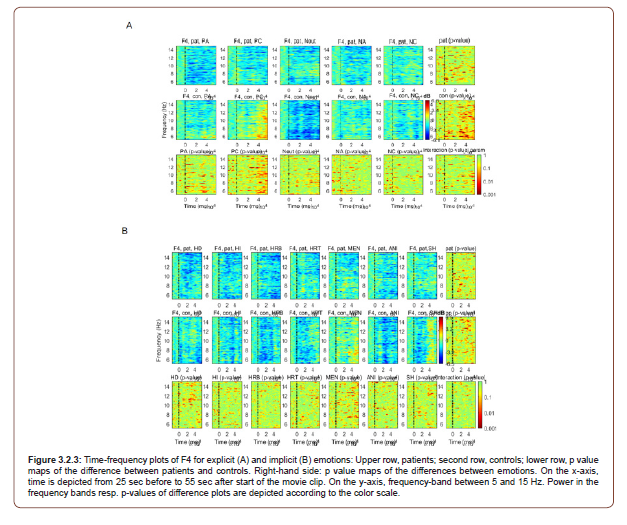
The differences between patients and controls on explicit emotions are somewhat greater than on implicit emotions. Greatest differences are reached on positive calm emotions on the right-hand side at electrode F4. Negative calm emotions have their maximum difference on the other side. For both explicit and implicit emotions, the differences are greatest on F4. During the time before the start of the clip, there are already differences between the different emotions.
We tried to find out how these different EEG reactions to the explicit movie clips affect the different axes, activaton / deactivaton and positive / negative, of the dimensional model [12]. The detailed results are shown in Figure 3.2.4AB, Figure 3.2.4CD, Figure 3.2.4EF, Figure 3.2.5AB, Figure 3.2.5CD, Figure 3.2.5EF and Table 3.2.1 in the appendix.

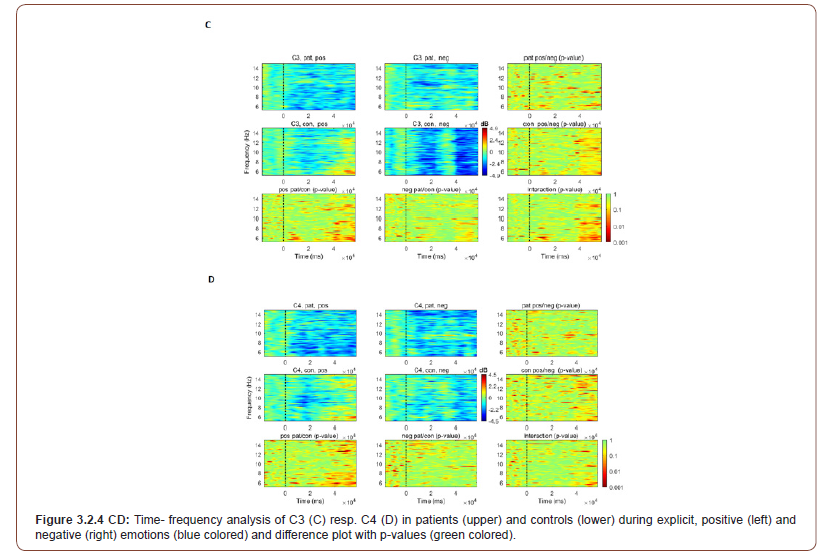
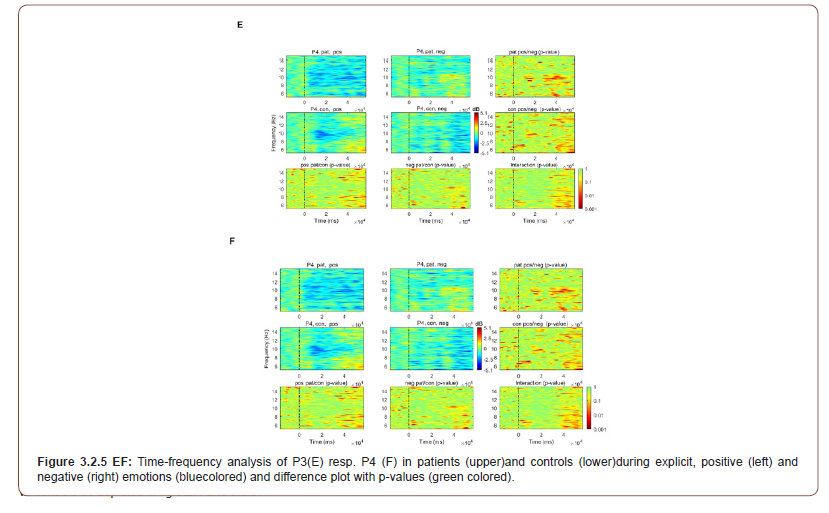
Table 12:

While controls show more activity on positive emotions, patients show more activity on negative emotions. The differences between patients and controls on the positive emotions are the greatest in the right hemisphere. In patients there is less activity during arousing than during calm emotions; in controls these differences are much smaller, but there are greater differences between positive and negative emotions. Again, just as with the subjective and ECG results, there is a greater difference in response between patients and controls to arousing emotions.
Effects of surgery
As stated in section 2, only 4 of the 12 patients underwent surgery. The small numbers limit the possibility of drawing any strong conclusions. There are no clear differences in SAM-scores except for a slight increase in dominance score, probably due to the strong reduction of seizures (appendix Table 3.4.1).
Table 13:Mean and st. dev. of SAM-scores for mood, arousal and dominance before and after surgery.

In the post-surgery state, the increase in heart rate is somewhat higher with a steeper decrease compared to the pre-surgery state. Both the LF and HF activity show a smaller modulation in the postsurgery state. These changes are illustrated in appendix Figure 3.4.1.
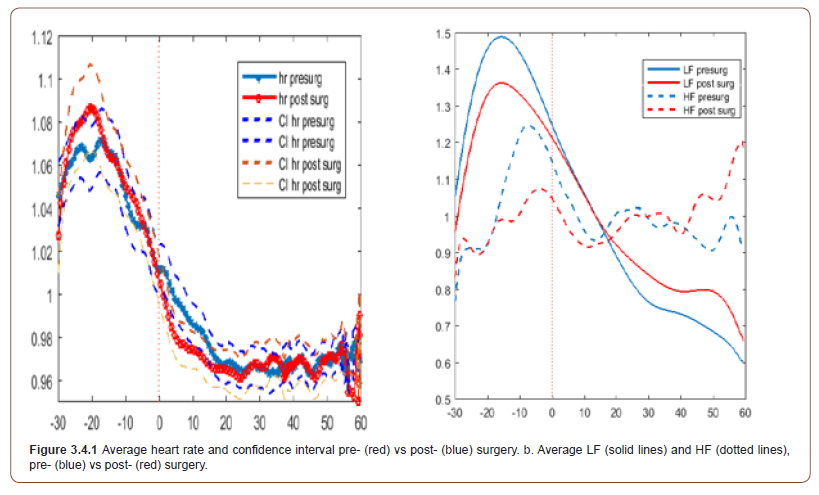
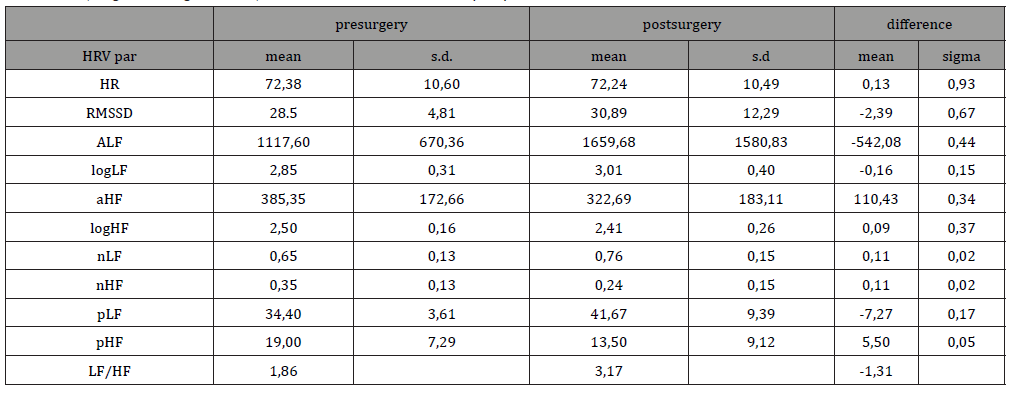
There is a significant post-surgery increase of the average normalized LF, a decrease of the average normalized HF and an increase of the average LF/HF ratio from 1.9 to 3.2 (sigma =0.02). The full table is depicted in the appendix Table 3.4.2.
Table 14:Means and st. dev. of HRV-parameters, pre vs post surgery, and the difference with the σ.HR: mean heart rate; ALF/aHF: amplitude LF/HF band; LogLF/HF: log aLF/aHF; nLF/nHF normalized aLF/aHF. pLF/pHF: %LF/HF.
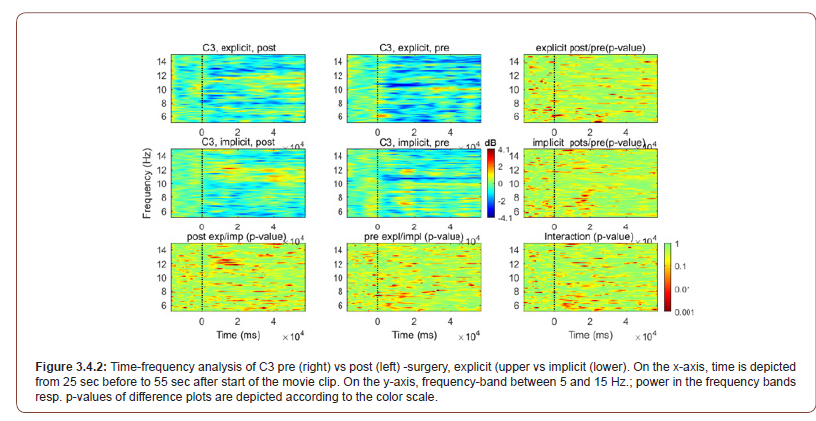
Time-frequency analysis of the EEG (Figure. 3.4.2 in appendix) reveals a post- surgery increase in activity in the alpha band, with a maximum at 10-20 and 40-50 sec, more during implicit than during explicit emotions (Figure. 3.4.2 in appendix).
Effect of medication
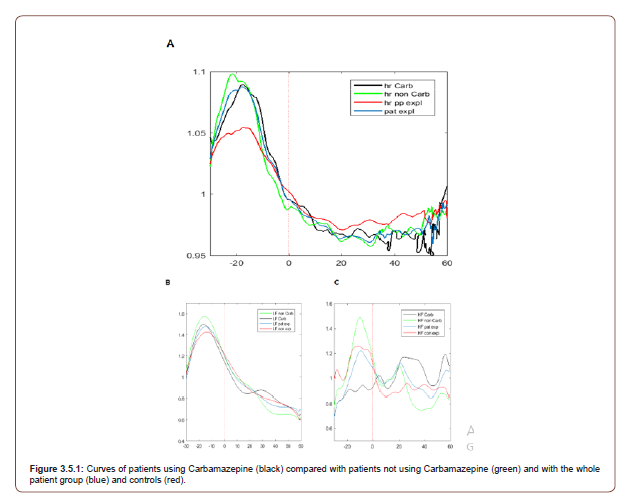
To explore the influence of AED, especially Carbamazepine, on the results, we divided the patients into Carbamazepine users (n=5) and non-Carbamazepine users (n=7). The results are presented in Figure 3.5.1 of the appendix and compared with the total group of patients and the controls. The heart rate curve of Carbamazepine users does not differ from that of the patient group as a whole; the same is true for the LF curves. The HF curve, however, shows less modulation in the first part of the curve than that of the non-users.
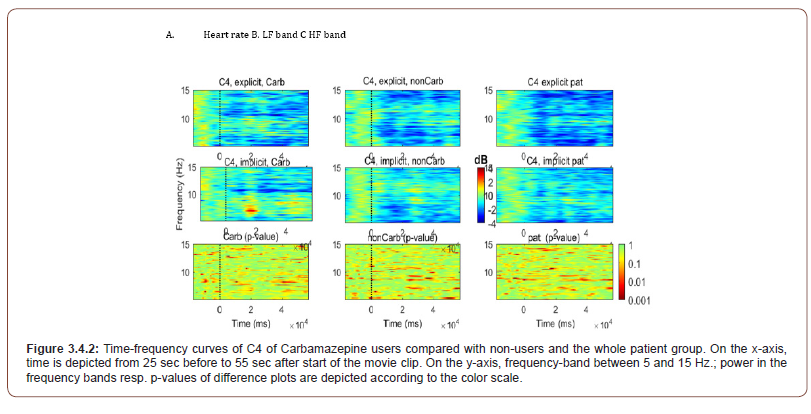
The same comparison was made between the (non) Carbamazepine users and the whole patient group for the EEG (See Appendix, Figure 3.5.2.) More rhythmic activity was found in the Carbamazepine group, but the general trend of differences between explicit and implicit emotions in the whole patient group remains the same in the Carbamazepine group (Figure 3.5.2.).
Discussion
The subjective SAM-scores point to a higher arousal in patients compared to controls. Hennion et al.[18] also found higher arousal scores on IAPS-pictures in patients with TLE, but only in response to neutral pictures. In line with this finding is the increased rise in heart rate in patients compared to controls in anticipation of the movie clips, also pointing to a higher arousal level. The lower dominance score in patients can be interpreted as indicating a lower self-confidence due to the epilepsy.
The initial increase in heart rate came as a surprise. It was not mentioned by the TUE-authors. They considered the period when the relaxing movie clip was being shown as a baseline condition and took the heart frequency during this period as the resting value. This is a procedure that is often used by investigators [3,19,20]. They do not depict the heart rate during this period, but suppose from Lacey’s theory of intake and rejection, that deceleration of heart rate occurs during the clip occurs from a base level due to the diversion of attention to an external task; hence they neglect the many examples that Lacey et al. give of an initial acceleration during preparation for the task [21]. The deceleration of the heart rate during the movie clips must, therefore, partly be seen as an effect of relaxation from the initial increase during preparation.
The stronger rise in heart rate of the patients is probably due to a smaller rise in activity in the HF band (parasympathetic activity) and must be seen as an effect of a less reactive parasympathetic activity. It is remarkable that the average HF activity in patients is higher than in controls, caused by a diminished relaxation of parasympathetic activity. According to Porges [22] this can be interpreted as a reduced capacity for focused attention and emotion regulation. Such disturbed patterns of parasympathetic activity are claimed to be associated with a greater tendency to depressive illnesses [23].
Investigations into epilepsy and HRV often concentrate on the risk of Sudden Unexpected Death in Epilepsy (SUDEP). A decrease in parasympathetic activity in resting conditions is usually found in epilepsy patients, but this finding is not consistent [5,6]. Dericioglu et al. [8] compared the HRV parameters in resting conditions of controls and patients with TLE, before and after surgery; he also found a decreased SDNN, RMSSD and HF activity in patients as a sign of decreased parasympathetic activity (see Table 3.1.2.appendix).
Table 15:Comparison of HRV parameters in our study with the study by Dericioglu [8]..

We compared our values with his and found an opposite effect: our patients show an increased SDNN, RMSSD and a decreased LF/ HF as signs of an increased average HF activity.
It is surprising that there is a difference between curves on explicit and implicit emotions already before the movie clips start; this is confirmed by the curves for the different explicit emotions. We also found differences in the EEG -activities during this time for implicit and explicit emotions and for the different types of explicit emotion. These differences before the start of the specific clip can be interpreted as Predictive Anticipatory Activity (PAA), as described by Mossbridge et al. [24]. There is a close resemblance of our HRV-curves to the curves of the orientation reflex, as described by Radin [25]. The overall effects for patients are somewhat smaller than for controls.
The EEG shows a modulated increase in activity in the alpha and theta bands. The initial increase and the increase at 50 sec are more pronounced in patients than in controls. The increases during the clips are stronger during implicit than explicit emotions. Using fMRI, Batut et al. [26] found more activation during emotions in patients with left-sided temporal epilepsy than in controls. Most of our patients also have a left-sided epilepsy; we also found an asymmetry with a stronger reaction to positive emotions on the right as described by them. The increased rhythmicity during unconscious emotions compared to explicit emotions concords with the idea that conscious action usually leads to more desynchronization of the EEG. The timing of the increases shows a correlation with increases in HF activity in the ECG as if the modulation takes place on the waves of parasympathetic activity. This may be in line with the work of Valenza et al. [27] who investigated how HRV and cortical activity are coupled. They found changes in heart brain coupling during the stimuli with a dependence of LF/HF parameters.
The small number of post-surgery recordings does not allow strong conclusions to be drawn. In the post-surgery state, there is a slight increase in subjective craft scores, probably due to a reduction of seizures. The heart rate shows a tendency to change in the direction of a further increase in differences with the controls: there is a tendency to a further increase of heart rate and a decrease in dynamics of LF as well as HF activity. The average LF/HF ratio shows an significant increase to values even higher than in controls, as was found by Dericioglu et al. [8]. The time-frequency analyses of the EEGs show a tendency to more rhythmic activity in the postsurgery state, decreasing the differences with the controls.
As all patients used 1- 3 AEDs, one must wonder to what extent the differences between patients and controls are based on a medication effect. Carbamazepine in particular is considered to have a strong effect on the ANS, but the research is not consistent: Persson [7] found an effect of Carbamazepine on autonomic cardiac control while Harnod [9] found no effect. We compared Carbamazepine users with non-users and found no clear effect on heart rate and LF curve, but the modulation of the HF curve was smaller for Carbamazepine users. One can state that certain effects can be attributed to Carbamazepine.
The answer to the question, can the differences between patients and controls be found more easily using movie clips with implicit emotions, is balanced. Comparing results overall, differences in LF activity and rhythmic activity in EEG are greater for implicit than for explicit emotions. However, considering the results of the various types of emotion, the differences between the explicit emotions are somewhat greater. The greatest differences are found on the axes, positive/negative and arousal/calm emotions. Probably the best strategy would be to test using different types of explicit emotion and compare them using the different axes of the dimensional model.
Conclusion
Emotional responses in patients with epilepsy are characterized by a subjective and physiological higher arousal than controls, which can be attributed to lower parasympathetic activation. These changes start already in the period before the start of the specific stimuli. Addition of the EEG showed a modulated increase in activity in the alpha / theta band, that was more pronounced in patients than in controls, and more pronounced in implicit than in explicit emotions. After epilepsy surgery, there appears to be a further increase in the sympathetic/ parasympathetic ratio.
Acknowledgements
We thank Marc Hendriks for psychological advices a Roy Krijn for his strong technical support.
Disclosure of Interest
None.
References
- Luoni C, Bisulli F, Canevini MP, De Sarro G, Fattore C, et al. (2011) Determinants of health-related quality of life in pharmacoresistant epilepsy: Results from a large multicenter study of consecutively enrolled patients using validated quantitative assessments: Quality of Life in Pharmacoresistant Epilepsy. Epilepsia 52: 2181- 2191.
- Schacher M, Winkler R, Grunwald T, Kraemer G, Kurthlen M, et al. (2006) Mesial temporal lobe epilepsy impairs social cognition. Epilepsia 47: 2141-2146.
- Kotwas I, Micoulaud-Franchi J-A, Khalfa S, Mcgonigal A, Bastien-Toniazzo M, Bartolomei F (2019) Subjective and physiological response to emotions in temporal lobe epilepsy and psychogenic non-epileptic seizures. J Affect Disord 244: 46-53.
- Amlerova, J, Cavanna AE, Bradac O, Javurkova, A, Raudenska J, et al. (2014) Emotion recognition and social cognition in temporal lobe epilepsy and the effect of epilepsy surgery. Epilepsy Behav 36: 86-89.
- Persson H, Ericson M, Tomson T (2007) Heart rate variability in patients with untreated epilepsy. Seizure16: 504-508.
- Lotufo PA, Valiengo L, Bensenor IM, Brunoni AM (2012) A systematic review and meta-analysis of heart rate variability in epilepsy and antiepileptic drugs. Epilepsia 53:272-282.
- Persson H, Kumlien E, Ericson M, Tomson T (2006) No apparenty effect of surgery for temporal lobe epilepsy on heart rate variability. Epilepsy Res 70: 127-132.
- Dericioglu N, Demirci M, Cataltepe O, Akalan N, Saygi S (2013) Heart rate variability remains reduced and sympathetic tone elevated after temporal lobe epilepsy surgery. Seizure 22: 713-718.
- Harnod T, Yang CCH, Hsin Y-L, Wang P-J, Shieh K-R, et al. (2009) Heart rate variability in patients with frontal lobe epilespy. Seizure 18: 21-25.
- Persson H, Ericson M, Tomson T (2003) Carbamazepine affects autonomic cardiac control in patients with newly diagnosed epilepsy. Epilepsy Res 57: 69-75.
- Ivonin L, Chang H-M, Diaz M, Catala A, Chen W, et al. (2015) Traces of Unconscious Mental Processes in Introspective Reports and Physiological Responses. PLOSONE 10(4): e0124519.
- Russell JA (1980) A circumplex model of affect. J Pers Soc Psychol 39(6): 1161-1178.
- Bradley MM, Lang PJ (1994) Measuring emotion: The self-assessment manikin and the semantic differential. J Behav Ther Exp Psychiatry 25(1): 49-59.
- Ramshur JT (2010) Design, evaluation and application of heart rate variability software (HRVAS).
Master Thesis. The University of Memphis. (http://iweb.dl.sourceforge.net/project/hrvas/Documents/ramshur_thesis.pdf)
- Task force of the European Society of Cardiology, the North American Society of Electrophysiology (1996) Heart rate variability –standards of measurement, physiological interpretation and clinical use. Eur Heart J 17: 354-381.
- Delorme A, Makeig S (2004) EEGlab: an open source toolbox for analysis of single trial-trial EEG dynamics including independent component analysis. J Neurosci Methods 134: 9-21.
- Roosenblueth A, Simeone FA (1934) The interrelations of vagal and accelerator effects on the cardiac rate. Am J Physiol 110: 42-55.
- Hennion S, Sequeira H, D'Hondt F, Duhamel A, Lopes R, et al. (2015) Arousal in response to neutral pictures is modified in temporal lobe epilepsy. Epilepsy behav 45: 15-20.
- Reynaud E, El-Khoury-Malhame M, Blin O, Khalfa S (2012) Voluntary Emotion Suppression Modifies Psychophysiological Responses to Movies. J Psychophysiol 26(3): 116-123.
- Kreibig SD, Wilhelm FH, Roth WT, Gross JJ (2007) Cardiovascular, electrodermal, and respiratory response patterns to fear- and sadness-inducing films. Psychophysiology 44: 787-806.
- Lacey J, Lacey B (1970) Some autonomic-central nervous system interrelationships. In P. Black, ed, Physiological correlates of emotion, Academic Press, New York, USA, pp. 205-227.
- Porges, SW (2011) Polyvagal Theory. Neurophysiological Foundations of Emotions, Attachment, Communication, and Self-regulation. Ww Norton & Co.
- Yaroslavsky I, Rottenberg J, Bylsma LM, Jennings JR, George G, et al. (2016) Parasympathetic nervous system activity predicts mood repair use and its effectiveness among adolescents with and without histories of major depression. J Abnorm Psychol 125(3): 323-336.
- Mossbridge JA, Tressoldi P, Utts J, Ives JA, Radin D, et al. (2014) Predicting the unpredictable: critical analysis and practical implications of predictive anticipatory activity. Front hum neurosci 8: art 146.
- Radin DL (1997) Unconcscious perception of future emotions: an experiment in presentiment. Journal of Scientific Exploration 11(2): 163-180.
- Batut A, Gounot D, Namer IJ, Hirsch E, Kehrli P, et al. (2006) Neural responses associated with positive and negative emotion processing in patients with left versus tight temporal lobe epilepsy. Epilepsy behav 9: 415-423.
- Valenza G, Greco A, Gentili C, Lantan A, Sebastiani L, et al. (2016) Combining EEG activity and instantaneous heart rate for assessing brain-heart dynamics during visual emotional elicitation in healthy subjects. Philosophical transactions A. Soc. A374:20150176.
-
Gerard van Erp, Johan Arends, Matthias Rauterberg. Physiological Changes During Conscious and Unconscious Emotional Reactions in Persons with Temporal Lobe Epilepsy: A Pilot Study. 9(3): 2020. ANN.MS.ID.000711.
-
Temporal lobe epilepsy; Epilepsy surgery; Emotion; Autonomic nervous system; Heart rate variability; Predictive anticipatory activity, Anti Epileptic Drug; Autonomic Nervous System; Fast Fourier Transform; Heart Rate (Variability); High Frequency band; Low Frequency band; Mixed Model; Predictive Anticipatory Activity; Psychogenic Non-Epileptic Seizure; Self-Assessment Manikin; Sudden Unexpected Death in Epilepsy; Temporal Lobe Epilepsy
-

This work is licensed under a Creative Commons Attribution-NonCommercial 4.0 International License.


