


 Research Article
Plant Density and Soil Water Use in a Semi-Arid Region of Loess Plateau of China
Received Date: December 18, 2024; Published Date: February 25, 2025
Abstract
Soil drying under perennial grassland and woodland is a nature phenomenon because of overload or waste of soil water resources because of lowload, which influences development, stabilization and economic and ecological benefit of the ecosystem in artificial vegetation. To solve this problem, take the Caragana as an example to study the relationship between Plant Density and Soil Water. The result showed that when plant density is more than soil water vegetation carrying capacity, we must regulate the plant density on soil water vegetation carrying capacity to carry out the sustainable use and caragana high-quality development.
Keywords: Caragana; growth; biomass; soil water; soil water vegetation carrying capacity; density regulation
Introduction
Water plays a dominant role in limiting and regulating the activity of life in arid and semi-arid regions. One of the most important problems is soil water storage, especially in the root zone soil layers from which plant roots use water in the process of vegetation rehabilitation. Interactions between changing precipitation regimes and other aspects of global change are likely to affect natural and managed terrestrial ecosystems. In the loess plateau of China, precipitation is limited and shows a high temporal and spatial variability within a year and among years. Forest cover rate is low and soil and water losses are very serious and the ecological environment has become worse and worse since 1950. Because vegetation effectively controls soil and water losses, largescale afforestation has been carried out and great progress has been made since 1950 on the China Loess Plateau [1]. Due to improper plant species selection and lack of density regulation in the process of rehabilitated vegetation, along with growth and development of forestry, soil deterioration has appeared on the Loess Plateau in the form of excessive soil drying under perennial grasses and forests, which are widespread in the Loess Plateau since 1960 [2-4]. The essential of soil drying is a maladjusted relationship between soil water and plant growth, an overload in substance under rain-fed condition, which influences development, stabilization, economic and ecological benefits of plant communities.
Density- dependence has been a key focus of population ecology since its inception, and has been shown to play an important role in the population dynamics of forest trees. The topic has gained even greater importance with the growth of conservation biology [5]. Density of a population or community not only influences single plant weight, leaf area, closed degree and productivity, but also effects soil water supply and soil water consumption in forests under rain-fed conditions. Because water resources are limited and the increment of irrigation water for agriculture must be kept zero in the future of China, so the best measure to control soil desiccation is to reduce density and control productivity and evapotranspiration of plant population or community, this is related to the density of soil water balance in root zone soil layers, which is the foundation for regulating the relationship between soil water and plant growth. It is necessary to study the interaction between plant growth and weight, between density and biomass, between density and soil water supply or consumption in perennial forests to calculate the soil water carrying capacity for caragana when the soil water supply is equal to soil water consumption in root soil zone.
The research scales are relevant to forest management [6]. This study take perennial Caragana shrub as an example to investigate height and diameter growth, single weight, depths to which Caragana roots penetrate the soil, monitoring canopy interception losses, surface runoff from shrub land, depths of rain penetration and determines growth and soil water dynamics of the artificial Caragana shrub land at population level. Up to now there are a lot of reports on growth and biomass relationship [7-11] and single weight and density [7,12], but little research has focused on the relationship among Caragana’s growth, biomass and soil water. The purpose of the present study is to analyze the relationships between height and diameter growth and single branch weight, between plant biomass and density, between density and soil water supply and between density and soil water consumption. Finally, the amount of density regulation is discussed.
Materials and methods
Study site
The study located in Shanghuang Eco-experimental Station with latitude 35°59´-36°03´N and longitude 106°26´-106°30´E in the semi-arid regions of the Loess Plateau, Guyuan county, Ningxia Hui Autonomic Region in western China. The geomorphology is a hilly loess region, with slopes of 10° to 25°. The rainfall is unevenly distributed in a year with an annual precipitation of 416 mm with a large coefficient of variation between years. Rainfall seasonal distribution is uneven, and the rainfall from June to September accounts for 73 % of the total precipitation. Elevation varies from 1534 to 1824 m. Mean level of solar radiation is 5340 MJ/m2, with an annual average temperature of 7.0°C. The plant growing period is 152 days. The experimental plot was located at the middle of the east slope of the Phoenix mountain on the eastern exposure slope of 10° to 15° at about an elevation of 1650 m. Caragana (Caragana korshinskii Kom) is about 2 or 3 meters tall brush with the ability to fix nitrogen from the atmosphere, endures drought and adapts itself to different situations. Artificial Caragana stands are mainly distributed across the Europe-Asian mainland, and in boreal arid region and Qing-Tibet upland of China. A typical deciduous bush tree, A 16-year Caragana stand was studied which is comprised of 8700 clumps/hm2 with a mean canopy area of 103 cm×87.2 cm, a mean height of 103 cm, a mean weight of 1040 g, a mean diameter of 11.6 mm, and 34 branches per clump. Herbaceous plants under the bush are Stipa bungeana, Heteropappus attaicus, Artemisia giraldii, Lespedeza davurica and Thymus mongolicus.
Measurements
Climate data were obtained from the Shanghuang Ecoexperiment station, which is 50 m from the study site. Height and basal diameter, depth of root distribution, canopy interception, soil evaporation, runoff and soil water were measured. First all, after every clump in a 200 m2 plot was investigated, a sample clump of mean height and diameter was selected near the edge of a steep slope and cut at the base of the branch. A hole around the sample clump was dug of 1×1m×5m, so that root diameters, root biomass could be investigated in soil layers of 0 to 10 cm, 10 to –50 cm, 50 to –100 cm, 100 to –200 cm, 200 to –300 cm, 300 to –400 cm, and 400 to 500 cm. The density of the dense bush forest (no treatment, the density is 8700 clumps/hm2, the same below) on the same site at the same age was selected as experimental site, and the sample brushland was thinned to establish field experiment plots with five densities of 8700 clumps/ hm2, 7100 clumps/ hm2, 5100 clumps/ hm2, 3200 clumps/ hm2 and 1600clumps/ hm2. Twigs that grew from the base of the cut clump were cut when they grew to a height of 5 to 10 cm in order to keep the planned experimental density constant in the duration of experiment. The dry biomass of herb plant under the shrub was investigated with sample method.
The traditional method to determine biomass is to sample destructively, which is time-consuming and expensive and not good for continuous investigation of the biomass. The most common method for estimating tree biomass relates easily measured variables to other structural and functional characteristics. The diameter and height of a tree is often be selected as the characteristic indicator of tree bole [8,9,11]. Ten clumps and 4 sample branches in every clump, 40 twigs were selected to measure height and diameter. Another sample clump with the number of more than 20 twigs near the plot was selected and cut to measure the base diameter, height and single branch weight. Branch and leaf water contents also were measured using the oven-drying method and then establish the Allometry Equation and density relation of biomass. The twig numbers of every field experiment plot were investigated.
Three standard rain gauges, 2 to 4 small gauges of 20 cm height with the same caliber as the standard rain gauges and a 5m×20m standard runoff plot was established at every treatment plot. Precipitation both inside and outside the forest and runoff were measured while. Soil water and plant growth measurements were carried out from April to November. The measuring interval was 15 days. A neutron probe, CNC503A (DR) made in China, was used for field-monitoring of soil water. Two 4 m long aluminium access tubes were placed in the middle of each experimental plot, with 2-m spacing between them. For measuring volumetric soil water content (VSWC), the calibration equation was A = 55.76 B+1.89, with R2 =0.9353, where B was the ratio of neutron count in soil to the standard count, and the measuring depth was from 0 to 400 cm. Neutron counting time was 16 seconds. Measurements were made at 20 cm intervals except 5 cm in which the reading at every measuring point depth indicates the VSWC in the range from the depth of measuring point minus 10 cm to measuring point depth plus 10 cm. The reading at 5cm depth indicates the soil water status in the range from measuring point depth – 5 cm to measuring point depth+5 cm).
The main calculation equations
Canopy interception
I = P2- P1
Where: P2 is the precipitation outside of shrub in mm; P2 is the precipitation inside of shrub in mm.
The same is as the following.
Canopy interception rate
CIR = I / P2×100%
Where, CIR is Canopy interception rate in %
Soil water supply
SWS = ΣP2 -ΣI -ΣRF-ΣL
Where, SWS is Soil water supply in mm. RF is run off in mm. L is the leakage in mm.
Soil water consumption
SWC = Σ SWS1 -ΣSWS2 +ΣSWS
Where, SWC is Soil water consumption in mm. SWS1 is initial soil water storage in a period in mm. SWS2 is initial soil water storage in a period in mm.
Results and Discussion
Relationship between Caragana growth and biomass
Caragana starts to bud in April and has leaves by early May, with the most of the flowering in mid-May. Most of leaves develop quickly in early June. Leaves start to drop in September. Pods expand fast in June and mature in July. The height varied linearly with time from April through June, with slow growth after July. The growth of basal diameter was slow before May because the air temperature is low. When the diurnal maximum air temperature surpassed 20°C in late May and the mean air temperature surpassed 20ºC in June, the growth in basal diameter was very fast. The growth in basal diameter was very slow in late June until growth stopped. At the same time, the biomass of Caragana reaches to biggest in the community. The whole growing process of basal diameter or height fits Logistics Equation [13]. Investigation of biomass of a plant population or community is needed to support sustainable forest resource management [6]. Traditional biomass determining method is cutting or destructive sampling method, which is time-consuming and expensive and not good for continuously investigating of the biomass. It has been reported that Allometry Equation is related to plant growth Allometry [14], the most common method for estimating tree biomass, relates easily measured variables to other structural and functional characteristics, the diameter and height of tree often are selected as the characteristic indicators of tree bole [8,9,11]. To select the best characteristic indicator of tree bole to estimate the biomass, the data of height, diameter and single weight of branch measured on 15th April, 2002 was analysed with the same model, Sample number is 20 branches.
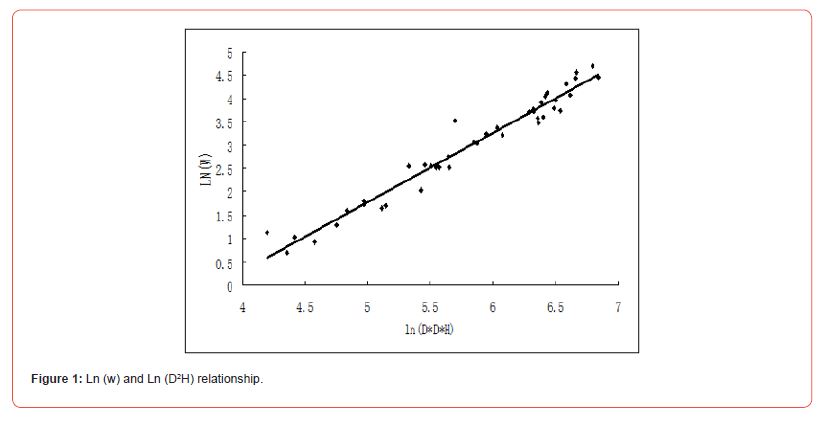
Simulating effect is indicated by determining coefficient, R2, see Table 1. We found significant relationships between Ln (w) and Ln (D),between Ln (w) and Ln(H) and between Ln (w) and Ln (D2H). All of them are linear, but the R2 of the equation Ln(w) = A Ln(D2H)+B is largest and is equal to 0.984, Figure1. This showed that the relationship between growth and Single weight can be expressed well by Allometry Equation with two-factors, Ln (w) =A Ln(D2H)+B, which is the same as the results by Feng and Wang [10]. The relations between growth and Single weight and Foliar weight at different stage Table 2. The R2 is equal to or more than 0.9503 for branch and 0.8231 for leaf, and the parameters A and B varied with time.
Table 1: Comparison of simulating effects using different characteristic indicator of tree bole.

Table 2: Growth and biomass relation in different period of growing season in 2002.

Relationship between Caragana density and biomass
tree in the brush land increases, the power of intraspecific competition to limited water resource reduce, which is beneficial for the growth of residual tree. The single twig weight may increase with surviving density decrease within the experimental density, and the productivity of the brush increases with surviving density decrease within the experimental density. Density influence plant height [15] and plant diameter growth and biomass. Some possible models were used to describe the relationship between single plant weight and density or productivity and density [7,12,16]. By the statistical analyses of Ws (single twig fresh weight) and x (surviving density) data, see Table 3, it is better to express the relationship between mean single branch fresh weight and density with the reciprocal equation in comparison with the 3/2 power law of selfthinning and linear equation. The Ws and x relation on 13th April and 15th Aug. 2002 can be written respectively as following:
Table 3: Plant density, individual weight and productivity relationship in Caragana shrubbery.



That is to say that the relationship between single branch weight and density fits the reciprocal equation, which is similar with the results by Zutter [12]. There is a linear relationship between productivity (Wp) and density (x), R2=0.948

suggests that the largest experimental density does not reach the density at which the self -thinning occurs in dense Caragana shrub system. According to the root investigation at different layers, 3-4 roots can be found at the bottom of the digging hole. This showed that the depth of root penetration for a 16-year Caragana forest was more than 500 cm, but the fine roots (diameter ≤2.0mm) were mainly distributed in the upper soil layer from 0 to 150 cm. The root biomass decreases exponentially with depth as follows:

Plant density and soil water supply
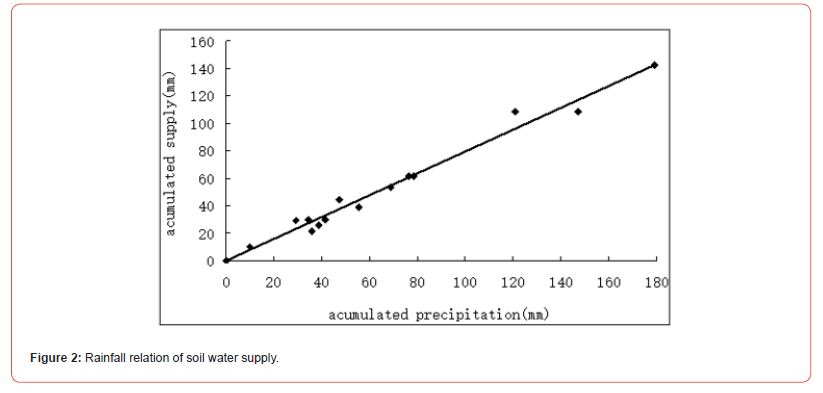
Water, especially soil water is one of most important growth factors. The only source of soil water supply in the Caragana brush land at the middle of the slope is precipitation. Under the rainfed condition, precipitation is one of the most important factors influencing soil water supply in the semi-arid region. Analysis of the measured data indicating that the soil water supply increased linearly with the rainfall outside the forest with an R2 of 0.982, see Figure 2. A second factor influencing soil water supply is canopy interception. Before infiltrating the soil, part of the rainfall is intercepted by canopy in a dense forest. The surfaces of forest leaves and twigs contact rain drops providing an interception capacity in the canopy of a given vegetation type. Along with density reduction, the amounts of leaves and twigs on the canopy reduces gradually and the canopy interception decreases. Precipitation intercepted by canopies ranged from 0.2 to 6.47 mm. Surface runoff ranged from 0.24 to 1.5 mm. The interception has been decreased in exponential way along with density reduction. Because of canopy interception, forests reduce the throughfall and the kinetic energy of rain reaching the soil surface and increase the surface roughness and improve the soil structure, which is good for increasing the resistance of surface runoff. Runoff reduced linearly with density increase. Because of the influence of density on canopy interception and surface runoff, the density influences the soil water supply. The soil water supply (SWS) in 2002 reduced linearly with density (D), R2=0.9355.

The relationship between density and soil water consumption
The impact of precipitation on soil water reduced with the depth in the measuring soil layer. In the dense brush land, the coefficient of variation of soil water decreased with depth. According to the extent of soil water change, a soil profile (0 cm to 400 cm) can be divided into three layers: a fast change layer (0 to 30 cm), an active layer (30 to170 cm) and a relatively inactive layer (170 to 400 cm). The VSWC varied dramatically with rainfall, water absorbed by roots and soil water redistribution in the fast change layer. There was a small peak of VSWC occurring in the active soil layer due to soil water infiltration after rain events. The soil water in the relatively inactive layer is difficult to use because the soil water is near the wilting point. The soil water almost keeps constant in a relatively inactive layer. The largest depth of wetting by precipitation was the lower limit, 170 cm in 2002 [13], 210 cm in 2003 and 290cm in 2004 [17].
Caragana growth and development change with time in a year, and the precipitation regimes seriously influenced soil water and finally the activities of Canagana life. In spring, the temperature is low and precipitation is very sparse, and the rainfall almost accounts to 1.0 to 3.0 % of the annual precipitation), and the soil water in the root zone soil layers depends on the previous year soil water.
The Caragana is in dormancy in the period from Jan. to Mar. In mid-April, with the increase of air temperature, the Caragana started to bud, developed leaves and then went into fast growing period in June, but the VSWC was near to the wilting point except in the upper soil from 20 cm to 40 cm where the VSWC surpassed 10% by the end of June. Although the precipitation is greater in July than in the other months in 2002, because of high temperature and fast plant growth, the soil water stress coefficient increased, and the average VSWC in the whole profile was 8.0% and soil water reserves went from 298 mm on 15 June to 309 mm on 31 July in the layer from 0 to 390 cm. The plant water uptake from the soil could not meet the evapotranspiration demand on the brush. By the second ten-days of July, leaves dehydrated and the leaf water contents went from 68.4% on 1 June to 42.1% on 23 July. To adapt itself to the serious condition, Caragana leaves changed color, most of the leaves dropped earlier, and the Caragana forest grew less and less. The pods of Caragana developed poorly and seeds did not fatten. Because of adaptation and tolerance to drought environment, there are some dead branch tips, but it was not observed that Caragana’s clumps or branches died in the Spring of 2003. In the thinner brush land (7100 clumps per hectare), the impact of drought on Caragana forest is not serious. The VSWC in the profile from 0 to 390 cm on 13th April 2003 at the start growth of Caragana is near to the wilting point (7.58±0.37%) with the storage water of 295 mm which is 65 mm lower than on 13th April 2002, see Figure3, Caragana also finishes its seasonal change, but the productivity is quite lower.
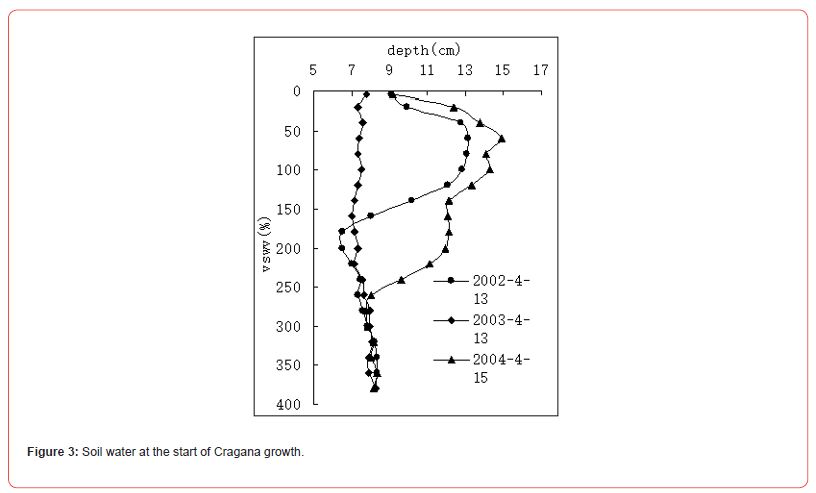
Although the depth of root penetration in the Caragana forest system was more than 500 cm, the fine roots (diameter≤2.0 mm) were mainly distributed in the upper soil, The precipitation of 385 mm in 2002 was 301 mm smaller than the average of 416 mm from 1983 to 2001, Caragana mainly uptakes soil water from the layer 0 to 170 cm in 2002 and from the layer 0 to 210 cm in 2003, and from the layer 0 to 270cm in 2004. So, change of soil water supply and soil water consumption mainly occurred in the soil layer from 0 to 170 or 290 cm in dense Caragana brush land [17]. With growth of the Caragana forest and entry to a fast growing period, the Caragana’s needs for water increased, with a negative balance of soil water storage occurring during April to June. Once most of the leaves had developed, soil water consumption increased. Soil water supply (304 mm) was 83 mm smaller than soil water consumption (371 mm) for the whole measurement period. This showed that the density surpassed the ability of soil water mainly from natural precipitation to support vegetation, so the soil water environment in 16-year Caragana bush land worsened. Because reducing density is good for reducing leaf area and canopies interception and increasing the throughfall and soil water supply, potentially resulting in improving the status of soil water balance. For such conditions, the density of Caragana forest needs to be regulated.
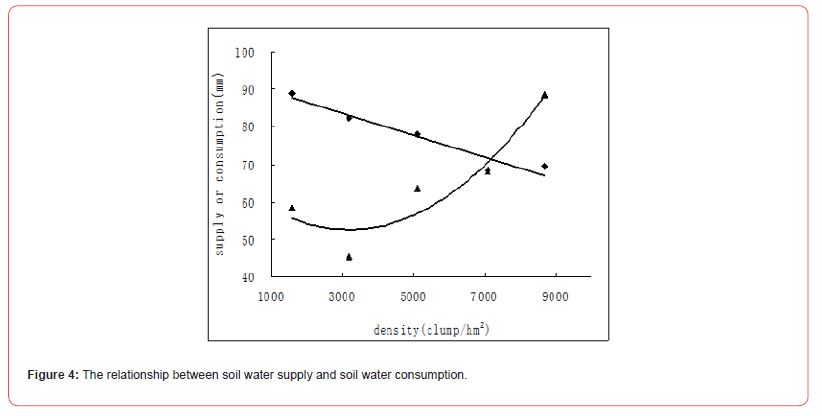
The soil water consumption (SWS) increased with density(x) when the other factors were kept constant. According to the analyses of data in 2002, the relation between soil water consumption (SWS) and plant density (PD) is parabolic:
SWC=0.0118PD 2– 0.7575PD+ 64.759……………..…(8)
Soil water vegetation Carry capacity
Plant growth and development influences the soil water supply and soil water consumption in a shrubland system. On the one hand, plants influence canopy interception when it is raining and soil water evaporation when it is sunny, reducing the net radiation and wind velocity, humidifying the air and increasing the aerodynamic resistance to the transfer of water vapor away from the soil surface; On the other hand, the plants reduce the soil water storage root water uptake [18-20]. If soil water supply is equal to or more than soil water consumption in annual bases, the soil water storage increases and the soil water environment improves. The vegetation carrying capacity is the ability of land resources to support vegetation. The vegetation carrying capacity in waterlimited regions is soil water vegetation carrying capacity, which is the amount of a population or plant density of indicator plant in a plant community when soil water supply is equal to or more than soil water consumption in the root zone soil layers on an annual basis. The indicator plant is cultivated plant or goal tree of nonnative vegetation, such as caragana in this experiment [21-23]. The density is the density of soil water balance. Reducing density is the measure to control soil drying, so vegetation carrying capacity of soil water is the foundation for density and the productivity regulation and the foundation for the rational use of forest resource.
By analyzing the measured data, a quantitative relationship between density and soil water supply and between density and soil water consumption. Equation 7 intersects Equation 8 at 72 (clumps/ 100 m2). This value is soil water vegetation carrying capacity in which soil water supply is equal to soil water consumption, see Figure 4 [24]. In 2003, the rainfall of 623 mm is similar with the largest recorded rainfall amount of (635 mm in 1984). In the dense brush land, soil water supply is more than soil water consumption in 2003 and in 2004, so the vegetation carrying capacity of soil water is equal to or more than 8700 clumps / hm2 in 2003 and 2004. Caragana grew poorly in 2003 because soil water content was low in April. May and June, and seasonal drought occurred because the rainfall mainly distributed in June (7.2%), July (11%), Aug. (40.6%) and Sept. (9%) [25-27]. The soil water content is high in the months from April to July the soil water content is near to the wilting point in August. Comprehensive considering the result of 3 years, the vegetation carrying capacity of soil water is 72 clumps/ 100 m2 at which the productivity is 18.80km per 100 m2 in which foliar is 4.5 kg.in order to control soil drying, 9 clumps/ 100 m2 need to be cut.
Conclusion
Climate and soil influence plant growth and development, and determine vegetation carrying capacity, short for land vegetation carrying capacity. Soil water, mainly coming from precipitation is the most important factor limiting plant growth and development under rain-fed conditions, this kind of vegetation carrying capacity is driven or limited by soil water resource, this type of land vegetation carrying capacity is SWVCC, short for Soil Water Vegetation Carrying Capacity in the arid and semi-arid region. Soil deterioration will appear in a forest system [28,29]. VWVCC is the theoretical foundation for Sustainable use of soil water resources and high-quality development of vegetation [21-23]. These results supply a base for not only soil deterioration control but also rational use of Caragana brush.
The relationship between Caragana growth and mean single mass relation can be expressed by the Allometry Equation with two-factors, and the parameters varied with time. The relationship between mean single branch mass and density and the productivity and density relation is linear on the same site at same age is reciprocal. The relationship between precipitation and soil water supply and between precipitation and canopies interception is linear. The soil depths that rain permeates to change with precipitation and is 170 cm in 2002, 210 cm in 2003 and 290 cm in 2004, which is lower than the depth that Caragana roots penetrate the soil. Deep drainage did not occur at the measurement site. Caragana density change can influence interception, surface runoff, soil evapotransipiration, so plant density and canopy’s interception relation was power function, density (x) relation was linear. Soil water Vegetation carrying capacity was the water-limited or waterdriven vegetation carrying capacity. The preliminary result of Vegetation carrying capacity of soil water is 72 clumps per hectare at with the productivity of 18.8 kg per 100 m2 in which foliar is 4.5 kg per 100 m2.
Acknowledgements
This study was supported by National Science Fund of China (Project No: 41071193, 41271539) and the front line of knowledge innovation’s domain of Institute of Soil and Water Conservation, CAS (SW05111).
References
- Wu QX, Yang WZH (1998) Vegetation construction and Sustainable development on the Loess Plateau. Beijing: Science Press 2(1): 1-15.
- Yang WX (1996) The preliminary discussion on soil desiccation of artificial vegetation in the northern regions of China. SCIENTIA SILVAE SINICAE 32(1): 78-84.
- Li YS (2001) Effects of forest on water circle on the Loess Planteau. J natural resources 16(5): 427-432.
- Yang WZ (2001) Soil water resources and afforestation in Loess Plateau China. J of Natural Resources 16(1): 433-438.
- Metcalfe DB, Kunin WE (2006) The effects of plant density upon pollination success, reproductive effort and fruit parasitism in Cistus ladanifer L (Cistaceae). plant ecology 185(1): 41-47.
- Fournier RA, JE Luther, L Guindon (2003) Mapping aboveground tree biomass at the stand level from inventory information: test cases in Newfoundland and Quebec. Canadian Journal of Forest research 33(10): 1846-1863.
- Zeide B (1987) Analysis of the 3/2 power law of self-thinning. For Sci 33(2): 517-
- Burton AJ, KS Pregitzer, DD Reed (1991) Leaf area and foliar biomass relationships in Northern hardwood forests located along an 800 km acid deposition gradient. For Sci 37(4): 1041-1059.
- Broad LR (1998) Allometry and growth. For Sci 44(3): 458-464.
- Feng ZW, Wang XK (1999) Biomass and productivity of forest ecological system in China (in Chinese). Scientific Press of China 1(2): 214-289.
- Wang C, Gower ST (2002) Aboveground and belowground biomass and sapwood area allometric equations for six boreal tree species of northern Manitoba. Canadian Journal of forest research 32(8): 1441-1450.
- Zutter BR, Glover GR, Mitchell RJ (1998) Influence of plant density and soil organic matter on the first-year growth of Loblolly Pine and Sweetgum. For Sic 44(3): 397-404.
- Guo ZS, Shao MA (2003) Vegetation carrying capacity of soil water in the Loess Plateau, In: Water-saving agriculture and sustainable use of water and land resource. Shaanxi Science and Technology Press 2(1): 704-701.
- Huxley JS (1936) Terminology of relative growth. Nature 137(2): 780-781.
- Sa X, Shu YC, Lu QZ, Gang W (2006) Density effects on plant growth and inequality in Sunflower population. J of integrative plant biology 48(5): 513-519.
- Donald CM (1951) Competition among pasture plants. I. Intra-specific competition among annual pasture plants. Agric Res 2(4): 355-376.
- Guo ZS, Shao MA (2009) Soil water infiltrating process in afforested land on slopes of the semiarid region of Loess Plateau. Acta Pedologica Sinica 46(5): 953-958.
- Gómez J A, Giràldez J V, Fereres E (2001) Rainfall interception by olive trees in relation to leaf area. Agricultural Water Management 49(1): 65-76.
- Wallace JS, Jackson NA, Ong CK (1999) Modeling soil evaporation in agroforestry system in Kenya. Agricultural and Forest Meteorology 94(3-4): 189-202.
- Jackson NA, Wallace JS (1999) Modeling soil evaporation in agroforestry system in Kenya. Agricultural and Forest Meteorology 94(3-4): 189-202.
- Guo ZS (2021) Soil Water Carrying Capacity for Vegetation. Land Degrad Dev 32(14): 3801–3811.
- Guo Z (2021) Soil hydrology process and Rational Use of Soil Water Resources in Desert Regions. Water 13(17): 2377-2852.
- Guo Z (2023) Forest restoration, resources sustainable use and high-quality sustainable management. Glob J Ecol 8(1): 007-010.
- Guo ZS, Shao MA (2004) Mathematical model for determining vegetation carrying capacity of soil water. Shuili Xuebao/Journal of Hydraulic Engineering 10(1): 95-99.
- Fangliang H, Richard P Duncan (2000) Density-dependent effects on tree survival in an old-growth Douglas fir forest. Journal of Ecology 88(4): 676-688.
- Guo Z (2020) Estimating Method of Maximum Infiltration Depth and Soil Water Supply. Sci Rep 10(1): 9726-9854.
- Hillel D (1998) Environmental soil physics. Academic Press 2(1): 771-826.
- Stefan K Arndt (2006) Integrated research of plant functional traits is important for the understanding of ecosystem processes. Plant and Soil 285(1-2): 1-3.
- (1990) The Team of Integrate Investigation on the Loess Plateau,1990. The natural Environment and Its Evolvement on the Loess Plateau, Chinese Scientific Press (in Chinese) pp. 146-152.
-

This work is licensed under a Creative Commons Attribution-NonCommercial 4.0 International License.