 Research Article
The Correlation of Repeat Sprint Measures to Pvo2 in Recreationally Active College Age Males
Miltenberger M1*, Zipp G2, Lombardi V2, Parasher R3 and Davis S1
1Department of Exercise Science, East Stroudsburg University, USA
2Department of Health Sciences, Seton Hall University, USA
3Director, Amar Jyoti Institute of Physiotherapy, USA
Miltenberger M, Department of Exercise Science, East Stroudsburg University, USA
Received Date:March 21, 2024; Published Date:March 26, 2024
Objective: This study was designed to investigate the relationship between repeat sprint measures (peak sprint time, mean sprint time, fatigue index) and predicted VO2 (PVO2) calculated from the Queens College Step Test (QCT). Methods: Eighteen recreationally active male college students (Age 20.9 years ±1.5, Height 178.5cm ± 6.1, Mass 77.5 kg ± 9.8) volunteered to participate in this study. Each subject completed a repeat sprint protocol on an indoor track consisting of 12 x 30-meter sprints separated by 35 seconds of passive recovery. After a minimum of 48 hours subjects returned to complete a submaximal 3-minute step test consisting of 24 steps per minute. A recovery heart rate was recorded to calculate PVO2. Relationships between sprint data (peak sprint time, mean sprint time, fatigue index) and PVO2 were established using Pearson Product Moment Correlations (SPSS version 23.0). Results: Statistical analysis revealed a significant negative relationship between mean sprint time and PVO2 (p=0.011, R= -0.586) suggesting that those subjects with higher aerobic ability or PVO2 would also have low mean sprint times. Correlations between peak sprint time and PVO2 as well as fatigue index and PVO2 failed to show statistical significance, p= 0.052 and p= 0.120 respectively. Conclusion: The findings of this study suggest that the QCT is a valid measure in the prediction of mean sprint ability. These results also provide further evidence to suggest that the aerobic energy system plays a key role in maintenance of performance across multiple sprint trials.
Keywords:Performance; Peak Sprint; Mean Sprint; Fatigue
Introduction
Repeat sprints are the main mode of locomotion in the field and court-based sports such as rugby, field hockey, basketball, and soccer. They can be defined as repeated bouts of near maximal activity interspersed with short recovery periods [1]. Repeat sprints are physiologically complex due to the requirement of high-power output paired with rest times that do not sufficiently allow the anaer obic phosphocreatine (PCR) energy system to recover fully before the subsequent sprint occurs. Previous research suggests that due to incomplete recovery of the PCr system other metabolic resources are upregulated to aid in ATP provision. Bogdanis et al. 1996 [2] found after repeated 30 second Wingate sprints with 4 minutes of recovery the anaerobic pathways did not recover completely, and the aerobic system contributed a significant amount of energy. Sander et al., 2017 [3] found a significant negative correlation between repeat sprint ability (RSA) and aerobic capacity suggesting that aerobic fitness is associated with faster sprint times. The reliance on the aerobic system seems to be imperative for success during repeated bouts of sprinting.
Assessing the ability of an athlete to perform is not a new concept and in fact, is something that is often employed by coaches to better understand the potential of a player. Player assessment should be relatively quick, have a low risk of injury, and provide data that can be easily interpreted. Assessing RSA can be time consuming and there is a potential for musculoskeletal injury especially in the early pre-season or with athletes that are untrained / detrained due to the testing requirement of maximum effort. As the previous research stated, the link between aerobic capacity and RSA is quite strong, an assessment of aerobic capacity may be a good indicator of RSA. Predictive aerobic tests are submaximal in nature, can be done in a short period of time with little to no learning curve. One such test is the Queens College Step Test (QCT) which is a validated field test for predicting VO2max [4]. The principle behind the submaximal step test is individual differences in the ability to recover after exercise, specifically differences in heart rate, where more fit, higher VO2 subjects would recover faster with lower heart rates post activity [4]. The QCT is an attractive choice for coaches due to its simplicity, short duration, and adaptability for larger groups.
Objective
Therefore, the purpose of this study was to investigate the relationship between RSA, defined as peak sprint time, mean sprint time, and fatigue with predicted VO2max as measured by the QCT.
Methods
Eighteen recreationally active male college students (age 20.3 years ±1.4, Height 177.9 cm ± 7.33, mass 71.5 kg ± 7.3) volunteered to participate in this study. All subjects had a previous history of playing or competing in repeat sprint-based sports and were currently free from injury that would inhibit physical performance of the testing protocols. Prior to participation all subjects completed a health history form, PAR-Q, and informed consent. The experimental protocol was approved by the University Institutional Review Board for the protection of Human Subjects.
Subjects participated on 3 different testing days including familiarization, repeat sprint trials, and predictive VO2max testing.
Each condition was separated by a minimum of 48 hours of recovery to eliminate protocol induced fatigue. The familiarization trial consisted of subjects performing a standardized dynamic warm-up followed by 3 max efforts 30-meter sprints. The subject’s best time was recorded as a reference to prevent the use of pacing strategies during the repeat sprint protocol. The repeat sprint protocol consisted of 12 x 30-meter sprints interspersed with 35 seconds of passive recovery. Subjects were instructed to run as fast as possible for each sprint, with sprint 1 and 2 having to be within 90% of the fastest sprint recorded during familiarization. Each sprint was recorded via electronic timing device (Brower® Infrared Timing Device). Mean sprint time was calculated using the average of all 12 sprints while the percent decrement formula was used as an indication of fatigue. The percent decrement formula calculates fatigue as follows: fatigue = (total sprint time / ideal sprint time) x 100) - 100, ideal sprint time is peak sprint time x number of sprints and total sprint time is the sum of all sprint trials [5]. The final testing day required each subject to perform the QCT. The QCT is a 3-minute step test performed with a metronome to the cadence of 24 steps per minute. After a brief warm-up period, the subject approached the 41.3cm step and began stepping in rhythm for 3 minutes. Upon completion of stepping the subject was instructed to be seated so heart rate could be assessed. Predicted VO2max (PVO2) was calculated 111.33 - (0.42 x pulse rate in bpm). All statistical analyses of the data were carried out using SPSS 23® (IBM, Armonk, NY, USA). Relationships between sprint data (peak sprint time, mean sprint time, fatigue index) and PVO2 were established using Pearson Product Moment Correlations. Significance was set at p≤ 0.05.
Results
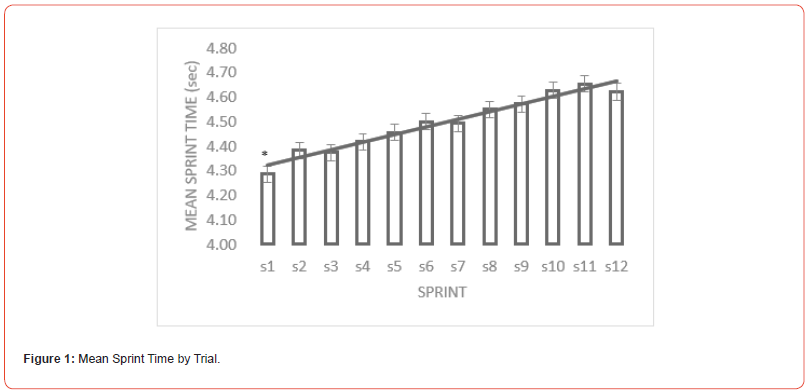
Figure 1 depicts a trend for increasing mean sprint time across trials; this is indicative of repeat sprints and demonstrates a normal fatigue pattern across the 12 trials. The fastest mean sprint time of 4.28 seconds +/-.19 seconds took place in sprint 1 and the slowest average sprint of 4.65 seconds +/- .28 seconds took place in 11. Also of note, the third sprint (4.37 seconds +/- .28 seconds) was faster than the second sprint (4.38 seconds +/-.24 seconds) and the twelfth sprint (4.62 seconds +/- .24 seconds) was faster than the eleventh sprint (4.65 seconds +/- .28 seconds). Additional statistical strength was demonstrated using Repeated Measures ANOVA for each level of the sprint trials. The result of this analysis indicated that sprint 1, which was the fastest, was significantly different than all other sprint trials. Establishing this data ensures subjects did not employ pacing strategies throughout the trials.
Figure 1:Mean Sprint Time by Trial.
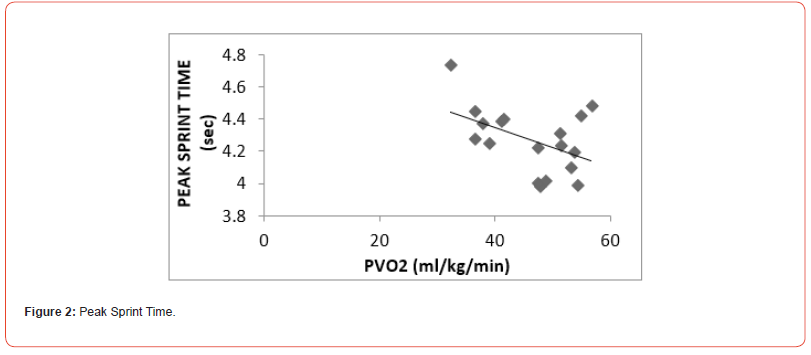
RSA was evaluated by 3 factors, peak or fastest sprint time, mean sprint time, and total fatigue across trials. When evaluating the relationship between peak sprint time and PVO2, the findings of this study show an insignificant negative (R= -0.466, p= .052) correlation between PVO2 and peak sprint time. Meaning that subjects with higher PVO2 values tended to generate lower peak sprint times.
Figure 2:Peak Sprint Time.
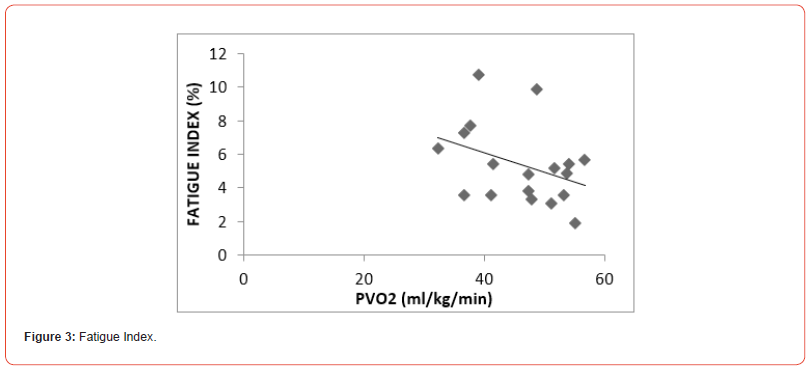
Similarly, statistical analysis of fatigue index and PVO2 revealed no statistically significant correlation (R= -.380, p= .120). However, Figure 3 does show a negative trend, meaning subjects with higher PVO2’s demonstrates lower fatigue indices. Of interest, is the range of fatigue scores and PVO2 from 1.89% to 10.73%, with corresponding PVO2’s of 55.05 ml/kg/min and 39.09 ml/kg/min respectively. These scores show relatively small, induced fatigue over the course of 12 sprints when compared to previous literature.
Figure 3:Fatigue Index.
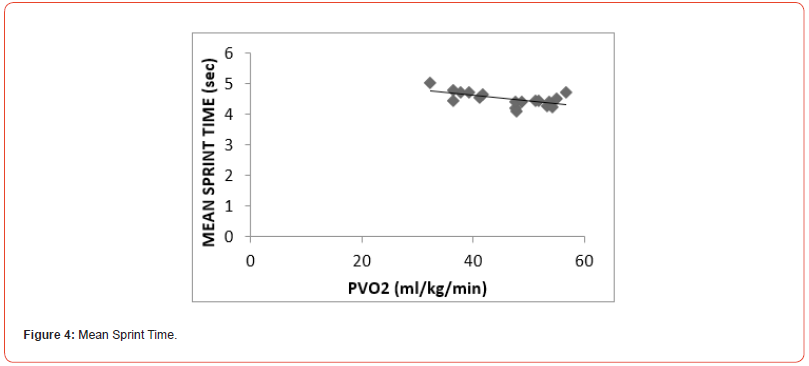
Mean sprint time defined as the average time (Sum of 12 sprint times / 12 sprints) for completion of 1 sprint, would be suggestive of the ability of a subject to maintain sprint times over the course of the repeat sprint protocol. Statistical analysis for mean sprint time and PVO2 revealed a significant negative correlation (R= -0.586, p = 0.011). This suggests that a higher PVO2 or aerobic capacity is significantly related to maintenance of performance over time.
Figure 4:Mean Sprint Time.
Discussion
The results of the present study indicate a negative correlation between peak sprint time and PVO2; even though the data was not significantly correlated the negative trend should not be ignored. Current data demonstrates similarities with previous research by [3] which found a significant correlation between aerobic capacity, peak sprint performance, and mean sprint time. Similarly, [6], found that endurance training positively influenced repeat sprint performance after 6 weeks in recreationally active males. The implication of peak sprint time in sport is the ability to generate high velocities over a short period of time, in essence a single bout of high velocity movement, although important, the concept of repeat sprint sports is the ability to reproduce that same high velocity movement on a consistent basis. This consistency overtime is termed mean sprint time, in the present study sprint time did have a significant negative relationship with PVO2, agreeing with [3,6]. Additionally, results of the present study are in agreement with research conducted by [7], where the researchers investigated the relationship between VO2 and repeat sprint measures in amateur and elite soccer players. In this study subjects completed a VO2max test on a treadmill using gas analysis, a 40-meter repeat sprint test as well as a VO2 uptake kinetics test on the treadmill. Multiple correlations were done between VO2 and repeat sprint measures, the authors found a statistically significant negative correlation, R-value of -.45, between mean sprint time and VO2max. Interestingly, similar results were found by [8], who studied the correlation of VO2 kinetics and VO2max to RSA. The researchers found that VO2 kinetics, which is the transitional dynamic nature of VO2 from rest to exercise as well as VO2max are both correlated to lower mean sprint times and lower accumulated decreases in speed. Overall, the results shown in previous studies are very similar to those found in the present study. This allows us to infer that VO2max, whether predicted or laboratory tested, influences mean sprint time during repeat sprint activity.
Fatigue measures are essentially looking at overall maintenance of performance much like mean sprint time, with that being said the expectations of training status would hold true where aerobically trained subjects would have smaller fatigue indices and the ability to maintain output over time, however the research is inconclusive regarding this relationship. Data from the current study suggests that there is no significant relationship between measurements of fatigue during repeated sprint activities and PVO2 despite a data trend to suggest a negative relationship [7], investigated the relationship between VO2 and fatigue index using the percent decrement formula, along with other variables related to repeat sprints in amateur and professional soccer players. The researchers found a significant negative correlation, R-value = -.65, for measured VO2 and fatigue index, thus indicating a moderate relationship between the two variables which suggests that subjects with higher VO2 values would exhibit less fatigue during repeat sprints. In contrast, the findings of [9] found no statistically significant correlation between VO2 peak and RSA in basketball players. Their results indicated an average fatigue index value of 3.4% and correlation R-value of -.32 (p=.54). It was concluded that VO2 peak is not related to fatigue index or the ability to repeat sprints. The lack of statistical correlation between fatigue index and VO2 is also demonstrated by [10,11], who studied female collegiate hockey players. The researchers assessed VO2max as well as RSA on the ice and found no significant correlation (r=-.422, p >.05). Upon, additional analysis they determined that only 17.8% of the variance in VO2max was explained by fatigue index values thus the authors concluded that aerobic capacity has a very small relationship with fatigue index in female hockey players. In general, the consensus between authors involving inconsistent results between studies is related to varying rest intervals between sprints and varying durations of sprints, this may affect fatigue measures during repeat sprint research and provide inconsistent data for comparison.
Conclusion
The present study investigated the relationship between predicted measures of oxygen utilization (VO2) and multiple indices of repeat sprints such as peak sprint time, mean sprint time, and fatigue. The research demonstrated that subjects with higher predicted measures of VO2 also had lower mean sprint times. This result can be interpreted in that greater efficiency to utilize the aerobic energy system (higher VO2) allowed the subjects to maintain sprint times throughout the entire protocol. This suggests that mean sprint time has a significant relationship to PVO2, meaning that players demonstrating higher PVO2’s may in fact be able to maintain sprint speed over multiple repetitions, essentially making them more effective players during competition.
Additionally, the current research also supports the utilization of predictive VO2 tests to assess the abilities of repeat sprint athletes. The use of predictive field tests is inviting to coaches due to the low cost, minimal equipment, and marginal time for completion of the tests. The step test in particular was chosen because of its submaximal nature and length of test being only 3 minutes in duration. When discussing the importance of field tests, we established a relationship between PVO2 and mean sprint time; suggesting that the results from the QCT may be a good indicator of athletic performance in repeat sprint-based sports.
Acknowledgement
The authors have no conflicts of interest to declare. This research followed all protocols associated with the Institutional Review Board for the protection of human subjects.
Author Biography
1. Matthew Miltenberger, Exercise Science faculty, East Stroudsburg
University, Coordinator of Sports Performance. PhD
2. Genevieve Zipp, Program Director, Ph. D. in Health Sciences
Department of Interprofessional Health Sciences and Health
Administration, Seton Hall University. P.T., Ed.D., FNAP
3. Vicci Lombardi, Department Chair and Associate Professor Department
of Athletic Training, Seton Hall University. Ed.D., ATC
4. Raju Parasher, Director, Amar Jyoti Institute of Physiotherapy.
P.T., Ed.D.
5. Shala Davis, Professor of Exercise Science, Department Chair,
ACSM ETT, ES, PD, Chair of IRB, Coordinator for the Doctor of
Health Sciences, East Stroudsburg University. PhD
Conflict of Interest
No Conflict of Interest.
References
- Glaister M (2005) Multiple sprint work. Sports Medicine 35(9): 757-777.
- Bogdanis G, Nevill M, Boobis L, Lakomy H (1996) Contribution of phosphocreatine and aerobic metabolism to energy supply during repeat sprint exercise. Journal of Applied Physiology 80(3): 876-884.
- Sander G, Turner Z, Boos B, Peacock C, Peveler W, et al. (2017) Aerobic capacity is related to repeated sprint ability with sprint distances less than 40 meters. International Journal of Exercise Science 10(2): 197-204.
- Chatterjee S, Chatterjee P, Mukherjee P, Bandyopadhyay A (2004) Validity of Queen’s College step test for use with young Indian men. British Journal of Sports Medicine 38(3): 289-291.
- Glaister M, Stone M, Stewart A, Hughes M, Moir G, et al. (2004) The reliability and validity of fatigue measures during short-duration maximal-intensity intermittent cycling. Journal of Strength and Conditioning Research 18(3): 459-462.
- Glaister M, Stone M, Stewart A, Hughes M, Moir G, et al. (2007) The influence of endurance training on multiple sprint cycling performance. Journal of Strength and Conditioning Research 21(2): 606-612.
- Rampinini E, Sassi A, Morelli A, Mazzoni S, Fanchini M, et al. (2009) Repeated-sprint ability in professional and amateur soccer players. Applied Physiology, Nutrition, and Metabolism 34(6): 1048-1054.
- Dupont G, Millet G, Guinhouya C, Berthoin S (2005) Relationship between oxygen uptake kinetics and performance in repeated running sprints. European Journal of Applied Physiology 95(1): 27-34.
- Castango C, Manzi V, D'Ottavio S, Giuseppe A, Padua E, et al. (2007) Relation between maximal aerobic power and the ability to repeat sprints in young basketball players. Journal of Strength and Conditioning Research 21(4): 1172-1176.
- Carey D, Drake M, Pliego G, Raymond R (2007) Do hockey players need aerobic fitness? Relation between VO2max and fatigue during high-intensity intermittent ice skating. Journal of Strength and Conditioning Research 21(3): 963-966.
- Glaister M, Stone M, Stewart A, Hughes M, Moir G, et al. (2004) The reliability and validity of fatigue measures during short-duration maximal-intensity intermittent cycling. Journal of Strength and Conditioning Research 18(3): 459-462.
-
Miltenberger M*, Zipp G, Lombardi V, Parasher R and Davis S. The Correlation of Repeat Sprint Measures to Pvo2 in Recreationally Active College Age Males. Aca J Spo Sci & Med. 1(5): 2024. AJSSM.MS.ID.000523.
-
Sprint Measures, Mean Sprint, Anaerobic Phosphocreatine, Repeat Sprint Ability (RSA), Peak Sprint, Fatigue
-

This work is licensed under a Creative Commons Attribution-NonCommercial 4.0 International License.
- Abstract
- Introduction
- Materials and Methods
- The Basic Tools of Scientific Inquiry
- Literature Review
- Theoretical Framework
- Research Design
- Findings and Discussion
- Conclusion and Recommendations
- Based on the findings, the following recommendations are considered:
- Declaration Statements
- Funding
- Data Availability Statement (DAS)
- Compliance with Ethical Standards
- Acknowledgement
- Conflict of Interest
- References


