 Research Article
Occupational Fatality Surveillance Data: Communication Issues, Misunderstandings, and Misuses
Roger C Jensen*
Department of Safety, Health and Industrial Hygiene, Montana Technological University, Montana, USA
Roger Jensen, Department of Safety, Health and Industrial Hygiene, Montana Technological University, Montana, USA
Received Date:April 19, 2024; Published Date:May 21, 2024
Abstract
Every occupational fatality is a tragedy for the person, family, fellow employees, and the employer. Efforts for preventing these deaths involve a multi-faceted approach, one of which is tracking the cases in order to increase understanding of the circumstances involved in the fatal incident. In the United States, the Bureau of Labor Statistics maintains an extensive collection of data on occupational fatalities and publishes the information in multi-page spreadsheets. When properly used, fatality data can be useful for setting research priorities and documenting the importance of particular fatality-related subject matter. For justifying research on prevention, the most useful data involves cause-relevant information proximal to the fatal incident, often referred to as upstream information. In the Bureau of Labor Statistics record systems, upstream information is in the Event and Exposure category. Occupational fatality records on 5,486 workers who died in 2022 provided the corpus for analysis. This article illustrates how visual formats can complement spreadsheet formats to support understanding, reduce errors, and discourage misuses.
Keywords:Occupational fatalities; Surveillance data; Misleading uses; Errors; Bureau of Labor Statistics; Data communication; Graphics
Introduction
For many reasons, surveillance systems for tracking occupational injuries, illnesses, and fatalities provide essential data. For governmental organizations responsible for awarding research grants, surveillance data systems provide information for setting project priorities. For universities and other research organization, surveillance data can help in setting areas of emphasis and specific targets for grant proposals. For employee and employer representatives, surveillance data may help focus risk-reduction efforts toward the highest risk industries and jobs. These benefits of maintaining occupational injury, fatality, and illness surveillance systems provide an objective foundation for supporting the occupational safety and health community. There remains, however, some potential for improving the format of data presentation.
Background
Having worked in the field of occupational safety and health for over 50 years, I have come to appreciate the value and limitations of surveillance data. Among limitations, data found in surveillance system have the potential for being misused by a researcher trying to use the data to support a grant proposal or a journal article submission. In my experience as a peer reviewer, the common location of misuses are in the Introduction section of papers and proposals where peer reviewers scrutinize less carefully than other sections.
Errors in extracting data from large tables can easily be made due to misunderstanding the record systems. In the United States, the Bureau of Labor Statistics (BLS) maintains national, coded records of occupational injuries, illnesses, and fatalities [1,2]. Although this article focuses on the United States, Lortie and Rizzo [3] provide an international perspective on how other countries, with their unique national system, are challenged by the same issues, such as differing vocabulary on first reports, capturing information from first reports, and reducing the information inputs into the discrete categories defined in their surveillance system. More recently, Tedone [4] describes findings from his investigations into national surveillance systems in Canada, Japan, Australia, New Zealand, the Netherlands, Germany, and the United Kingdom.
BLS develops data tables using information obtained from state, federal, and independent sources throughout the U.S. BLS verifies the information, codes it, and shares the information with the public. Information about each fatality is assigned numeric codes in a four-level hierarchical structure. The broadest level is assigned the left position in a four-digit code. Three additional digit holders provide places for numeric codes to indicate Level II, Level III, and Level IV categories; each providing more detailed information relevant to the level above.
The tables of data published by the BLS contain valuable information with potential for greater use. However, searching the multi-page tables for applicable information is not as user-friendly as it might be. One reason is the indentured format for listing categories in large spreadsheets. BLS spreadsheets list attributes of injuries, illnesses, and fatalities in an organized hierarchical order with categories identified in the left column (Column A) by using a left justified major category, a single indent for the next level, a double indent for the third level, and a third indenture for the lowest level. According to this author’s measurements, each indent is 3/32 inch (2.38 mm). The full indent for the fourth level is less than one centimeter. This format is logical, but at the same time, difficult for people who might benefit from having more easily located data. In this paper, the focus is on the Event and Exposure (E&E) codes which occupy the left-most digit holder. Any one of seven digits may be entered in the left digit place holder to indicate the Level I category. The second level, subcategories, occupy the second digit holder. The third and a fourth level of the hierarchy occupy the third and the fourth digit holders
In addition to misreading indenture level, a person seeking specific information from published data could make other errors. An error classification system developed by Shappell and Wiegmann provides a backdrop for understanding the sort of errors possible [5]. Called Human Factors and Accident Classification System (HFACS) it has been adapted from original aviation accident studies to fit other domains by adding a domain indicator to the name, for example, an adaptation for using HFACS in mining has been referred to as HFACS-M [6]. Some other examples of similar domain-specific adaptations have been reported in recent years [7-13].
The HFACS consists of two major categories: errors and violations. The major category of errors has three mid-major types of errors: decision errors, skill-based errors, and perceptual errors.
In the major category of violations, the taxonomy has two mid-major categories: routine violations and exceptional violations. Errors that may apply to using the BLS data tables include perceptual errors and misjudgment. These may come from searching pages full of numbers mistaking the appropriate row and/or column where a number is found. Misjudgment may come from a user who does not fully understanding the 4-digit numbering hierarchy of the rows in a data table. In the major category of violations, a normally ethical researcher might willfully select from a data table numbers that exaggerate the importance of a particular subject matter. In the HFACS, this would be classified as an exceptional violation or intentionally using data to mislead.
Using Surveillance Data to Mislead
Five ways to use surveillance data to elevate the importance of
a topic are noted below.
1. Exaggerate importance of subject matter by presenting
higher-level injury, illness, or fatality data because numbers
are much larger than the lower level number most directly
applicable to the subject matter of the grant application or
paper. For example, a high level in the BLS hierarchy is falls,
slips, and trips. A research applicant might quote the whole
category of data (e.g., all falls) instead of quoting data directly
applicable to the proposal, such as falls from elevation, falls
from ladders, falls on same level from tripping, or falls on same
level from slipping. Other E&E categories are open to similar
misuses.
2. Mislead by using percentages based on a narrow whole.
For example, if the subject matter proposed is occupational
skin disease, the percentage of all worker’s compensation
claims could be reported in two very different ways: (1)
percent of all workers’ compensation claims, or (2) percent
of all occupational illness claims. Because occupational illness
claims constitute about six percent of all claims, using that as
the whole will greatly inflate the importance. Skin disorders
make up about 3%, of all claims but about 50% of illness claims.
3. Mislead by using different denominators for rates. In the
U.S, where denominators generally use Full-Time Equivalent
(FTE) employee years (2000 hours worked per employee).
There is a large difference in reporting rates for injuries
(typically cases per 100 FTE), for occupational illnesses (cases
per 10,000 FTE), and occupational fatalities (deaths per
100,000 FTE) [14].
4. Mislead by citing rank order alone. This can be misleading
if multiple items having numerical scores are put in order, and
a researcher references only the rank of the item the researcher
wants to emphasize in order to make it appear more important,
without clarifying the small difference between an item just
above or below the selected item. The proper way to present
rank order is to include the numeric used to sort. An example
is found in a risk assessment table of the U. S. Department of
Defense which has five categories for probability [15]. When
the terms for identifying these categories were scored in a
psychometric 100-point survey of terms [16], the means scores
from highest to lowest were: 72, 68, 40, 20, 18. Clearly, the
two terms with highest ratings (72 and 68) were marginally
different from each other and distinctly different from the
middle rating (40), and the two lowest rated terms (20 and
18) were marginally different from each other and distinctly
different from the middle rating (40). This illustrates how
citing ordered categories established by quantitative inputs can
mislead readers who may assume the ranked items are equally
spaced. An ethical researcher should present ranked categories
in a manner to fully inform readers.
5. Misleading by citing fatality rates on a subject when the
paper or proposal applies to prevention of injuries unrelated
to fatalities. An example, a proposal to study musculoskeletal
disorders among police officers might cite, in the introduction,
fatality data on police officers to inflate the impression that
police officers have a highly hazardous job and that, in some
mysterious way, justifies a study of musculoskeletal disorders.
Other formats for presenting injury and illness surveillance data might be an improvement over the large, multipage format found in the BLS fatality tables. One clearer format is the format of tables used for research journal papers to force logical data presentations with well-defined variables. The BLS journal Monthly Labor Review (MLR) often publishes articles that illustrate injury, fatality, and illness data in well-formatted tables. Another format for presenting data objectively is to make better use of graphics. The creation of this article was undertaken with the aim of extracting the most important data from the BLS tables and illustrating alternative forms of presentation to reduce misunderstandings and misuses.
Methods
Data for this article came from the United States Department of Labor, BLS, Census of Fatal Occupational Injuries (CFOI) [2,17]. The focus of the article is on the manner of presenting, not on the substance of the underlying data. Readers interested in learning more about the BLS data are referred to a paper by Drudi [18] or BLS reports [1,2]. Fatality data released by the BLS for the 5-year period 2018–2022 was published in December of 2023 and used as the starting point for this analysis [2]. Useful tables with these data report occupational fatality numbers in a table format with five columns for the five years crossed with seven rows with the seven major categories for E&E. Similar data on injuries and illnesses data are released separately [1]. Both data sets use a hierarchical category system headed by one of seven broad categories, called in this article Level I. Within each Level I category are two or more lower levels referred to in this article as Level II, Level III, and Level IV.
Fatality cases are assigned codes for defined attributes. The first digit of the code uses one of seven numbers to identify one of the seven Level I categories, for example, the number 1 is for violence and number 2 is for transportation. The second digit is for Level II subcategories within the Level I major category. The third and fourth digits are for Level III and Level IV categories. The E&E code is intended to describe the circumstances directly leading to the incident [18]. As such, the E&E codes are the most relevant code to describe the proximal cause of the fatality. Information contained in Level III and Level IV may also have “source” codes identifying objects or materials relevant to the source of the fatality.
The E&E digit 7 indicates musculoskeletal injuries—an important category for the BLS injury and illness datasets—but not for the fatality datasets. The analyses reported in this article on fatalities do not include musculoskeletal incidents. For that reason, the most recent 5-year dataset (see Table 1) was used to examine the year-to-year trends in the variable “E&E specific percentage of the total fatalities in the year”. Compared to total fatalities, this variable remains relatively stable from year to year.
Analyses
The initial analysis considered five years of total occupational fatalities, 2018, 2019, 2020, 2021, and 2022. The total annual fatalities were 5250, 5333, 4764, 5190, 5486, respectively. The variable used was category-specific percent of each Pij, where the subscripts i indicates row category and j indicates column year. The data layout is in a matrix format in Table 1. For years 2018 through 2021, the Wilkinson test was used to compare each 2022 row Pi5 with the row median for the prior four years. None of the resulting hypothesis test probabilities (0.58, 1.00, 0.36, 0.465, and 0.20) provide evidence that the year 2022 Pi5 values differ from those for the previous four years. Therefore, the Pi5 data from the 2022 column were judged to be representative for purposes of subsequent analyses. The advantage of using a single year becomes evident when drilling down to lower levels of the hierarchy The mean number of fatalities in each of six E&E categories are listed in Table 2.
Table 1:Annual Percentage of fatalities by E&E categories

Table 2:Level I E&E Categories.

After selecting all fatalities in the database coded 1–6 for E&E category, the drilling down process continued to Level II. A graphical image was prepared to display the relationships among each toplevel category and the applicable second level subcategories. The graphics include only those Level II groups with at least 2% of the parent, Level I. Findings for third and fourth levels were included in narrative form or, in some cases, embedded into the graphics.
Results and Discussion
Level I Findings—5-year data
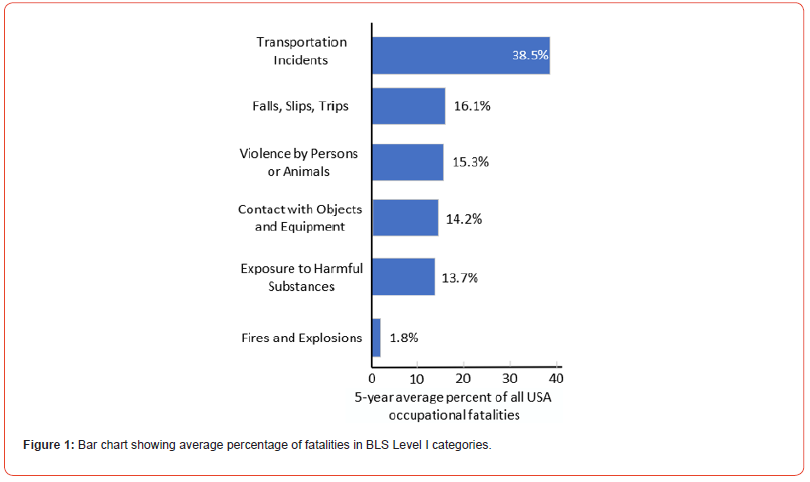
For the Level I categories, the 5-year mean percentage values Pij were averaged and displayed in the colored horizontal chart in Figure 1. Transportation events accounted for over one-third of all fatalities. The four categories below transportation had similar percentages within a range of 16.1% to 13.7%. The E&E category for fires and explosions constituted a much smaller percentage (1.8%) than the other Level I E&E categories.
Level II Findings—Year 2022 Data
Following a conclusion that year-to-year changes in percent of the annual whole changes minimally, additional analyses used the data from the most recent year, 2022. All of the six event codes depicted in Figure 1 had two or more Level II subcategories. Transportation had the most Level II categories. The category with the fewest Level II categories was fires and explosions with two. The following material follows the order in Figure 1.
Transportation Incidents
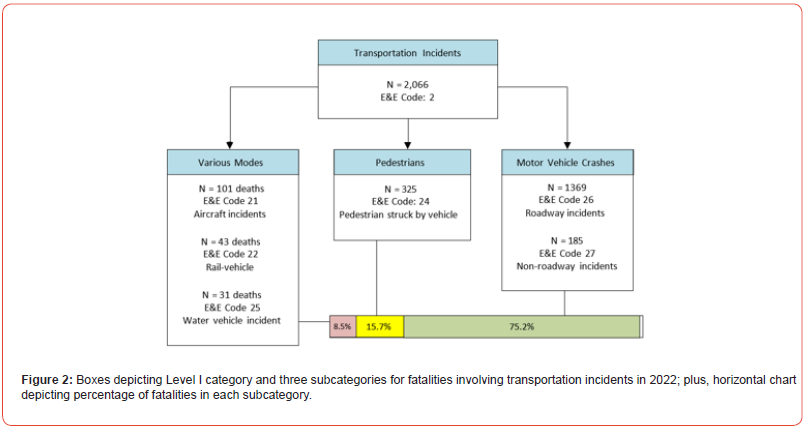
Two-thirds of the transportation occupational fatalities in 2022 fit within the category of “Roadway incidents involving motorized land vehicles”. Figure 2 provides a graphical view of the transportation incidents. In the graphic, the left-side box contains three of the Level II subcategories based on mode of transportation: aircraft, water travel incidents and rail–vehicle collisions. The middle box contains cases involving pedestrians being struck by a vehicle. The third box contains motor vehicle crashes and other incidents. The fatalities in this category are divided into categories for the location of the event (roadway or non-roadway). For collisions with other vehicles, Level IV information on the collision includes vehicles moving in same direction, moving in opposite direction, and moving perpendicularly, accounting for 207, 252, and 164 fatalities, respectively. There were also collisions with objects other than vehicles, specifically striking an object or animal on the road side (314 fatalities). BLS lists the 258 fatalities resulting from a vehicle being jack-knifed or overturned in two categories, those that occurred on the roadway (181 cases) plus those that occurred off roadway (77) Additional information on fatalities resulting from transportation are mentioned in the footnotes of Table 3. Note that the number of Level III deaths do not sum to match the number of Level II deaths because some cases lack verifiable information for assigning a code for the Level III category.
Of particular interest to the road construction industry is a report on fatalities in road construction projects during 2003 and 2007 [19], The most common fatal incident was worker being struck by a vehicle, or mobile equipment. Ten death resulted from being run over by a backing up vehicle or equipment. The horizontal bar chart in Figure 2 indicates the percentage of fatalities in the applicable Level II box.
Falls, Slips, and Trips
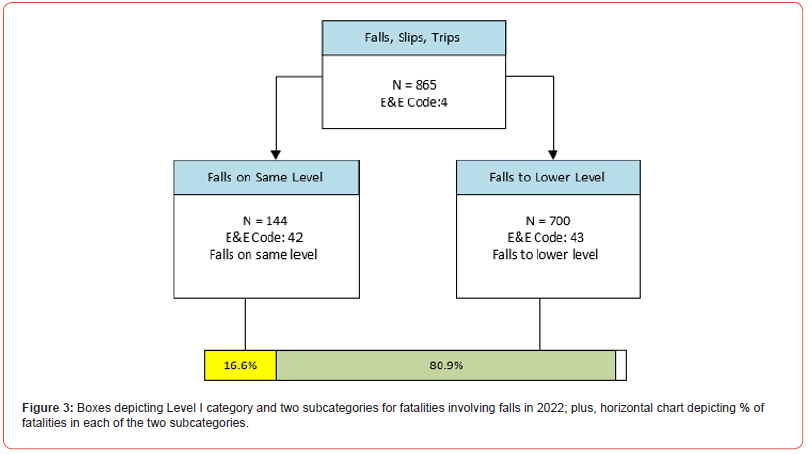
BLS uses Level I, category 4, for falls, slips, and trips that
resulted in a fatality. The second level categories, as depicted in
Figure 3, are falls from same level and falls to lower level. Other
Level II categories not shown in Figure 2 because of small numbers
are jumps to lower level and fall or jump curtailed by personal
fall arrest system. Out of the 865 fatal falls, the Level II E&E codes
indicated the following percentages.
• Code 42, falls on same level, 16.6%
• Code 43, falls to lower level, 80.9%
• Code 44, jumps to lower level, 0.8%
• Code 45, fall or jump curtailed by personal fall arrest
system, 0.4%.
For the fall on same level fatalities, Level III allows code options for tripping or slipping as the preceding event. This may mislead some people to believe that slipping and tripping are the only events that can cause a fall to same level. Actually, there are many events that cause loss of balance resulting in falls to same level. Lortie and Rizzo [20] list many initiating events that can cause loss of balance leading to a fall. Code 5 records indicate three individuals died even though their fall was curtailed by a personal fall arrest system. This could occur from being suspended for longer than the individual’s tolerance time or having an ill-fitted fall-protection harness, or a combination [21-23]. Unfortunately, the fatality record system does not collect reports of workers who were saved by use of a fall protection harness.
Stairway falls can occur while descending of ascending. Because ascending falls typically involve falling forward, the fall distance is shorter than typical falls while descending. The fall of a person who fell forward while ascending a stairway has essentially fallen to the same or higher level (Code 4211). In contrast, a person who fell forward while descending a stairway has essentially fallen to a lower level (Code 4331). This distinction may not be appreciated by the people who report and code stairway falls. Hence, this distinction could lead to misunderstanding injury and fatality records on stairway falls.
A particular, but common, type of stairway fall occurs when a descending person misjudges the last step down. This kind of fall involves misjudging when the descending person, thinking they have reached the last step, expects their next step will be the floor, but all the foot encounters is air. This fall is similar to what forensic engineers call a “single step down” hazard [24]. This event should be coded as a fall to lower level (Code 4331). A researcher proposing a study of stairway falls might error by not quoting the most appropriate fall data from the BLS data because of this distinction.
Violence by Persons or Animals
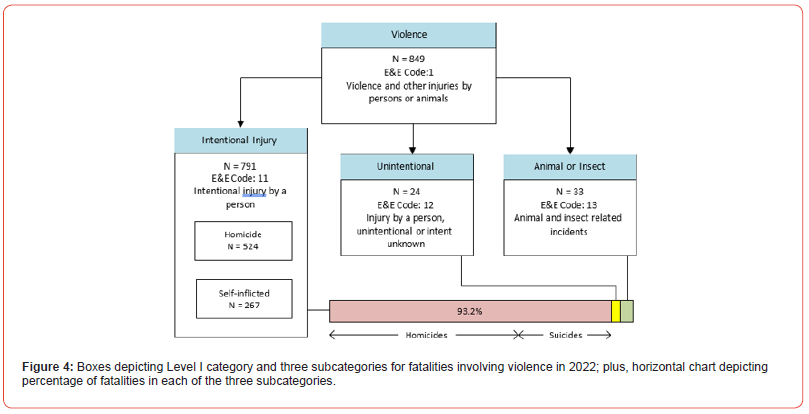
The violence category (E&E code 1) has three Level II categories—the largest being for intentional injuries and two much smaller categories for unintentional injury and animal or insect related incidents. As depicted in Figure 4, the intentional injury category is split at Level III into homicides and suicides. Of the 849 violence-related occupational fatalities in the year 2022, BLS data reported 93% were intentional. The intentional fatality category is divided into two subcategories consisting of two-thirds homicides and one-third suicides.
For homicides, the means of harming another included shooting (435), stabbing, cutting, slashing, piercing (27), hitting, kicking, beating, shoving (27), and multiple violent acts (5). BLS commentary indicated that most homicides (83%; 435 of 524) were carried out by shooting [2].
Contact with Objects and Equipment
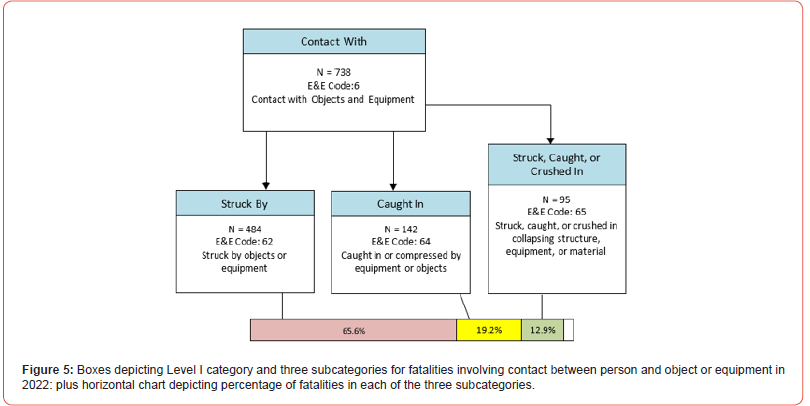
According to BLS data, 738 cases (13.5%) of occupational fatalities were classified in the category “contacts with objects and equipment”. The next level of breakdown has four Level II subcategories listed in Table 4. Figure 5 depicts three of the four subcategories; the omitted one (struck against objects or equipment) had less than 2% of the total in this category. Of the three subcategories depicted in Figure 5, the largest (struck by objects and equipment) contributed 65.6% of the fatalities in this category. The second largest category, “caught in or compressed by equipment or machinery”, has one subcategory in Table 4. The category relationships are depicted in Figure 5.
Exposures to Harmful Substances
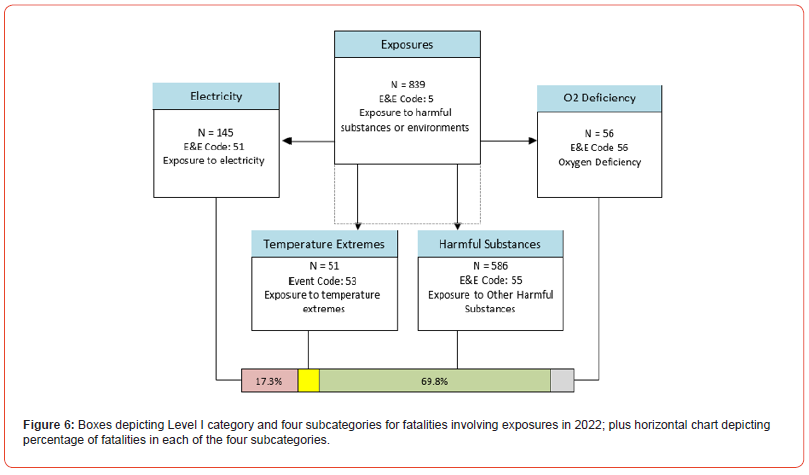
The Level I category of Exposure to Harmful Substances includes exposure to electricity, to harmful substances, to oxygen deficiency, and to exposure to temperature extremes as depicted in Figure 6. For the fatalities involving exposures, the construction industries accounted for the most deaths from electricity, temperature extremes, oxygen deficiency, and exposure to other harmful substances. Among deaths due to exposures to temperature extremes, 51 were from heat exposure. As Figure 6 indicates, the largest portion of fatalities in this exposure category was harmful substances with almost 70% of the fatalities. The exposure to harmful substances category trended upward during the five years, rising from 11.8% to 15.3% of annual fatalities. A comment from the BLS about the increase in this category from 2021 to 2022 said “This increase was largely due the increase in unintentional overdoses which accounted for over 60 percent of fatalities in this category” [2].
Fires and Explosions
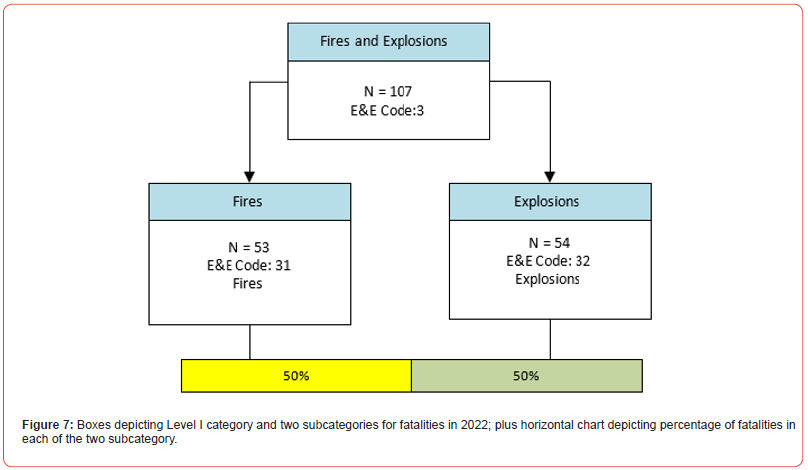
In the Injury and Illness Classification System, fires and explosions are considered a Level I category due to being quite different from the other means of injury and death. In 2022, fires and explosions killed 107 workers. The deaths were equally shared by fires (53) and explosions (54). Deaths from explosions occurred primarily in the manufacturing sector (13) and secondarily in construction (7). Deaths from fires occurred in the construction (6), manufacturing (6), and the natural resources and mining sector (5).
Discussion and Conclusions
The creation of this article was undertaken with the aim of extracting the most important data from the BLS tables and illustrating complementary forms of presentation to reduce misunderstandings and misuses. From the author’s perspective, the most important information is the E&E code because it has potential for use in fatality prevention. Much of the other coded information applies to non-changeable attributes like victim demographics and industry of employment. What is needed for prevention must be the modifiable attributes that occur before a fatal incident. This is so widely acknowledged by occupational safety and health professionals that the terms upstream and downstream need no explanation.
The extensive amount of information in the BLS fatality data is released for the public in the form of very large spreadsheets spanning several pages. The content is the result of meticulous work by BLS professionals. This author’s premise is that information could be more effectively communicated to the public using alternative means of communication. Among the many means of communicating data are smaller tables and more use of graphics. Tables 3 and 4 illustrate the former and Figures 2-7 illustrate the latter. The simple linear, color coded bar charts in Figures 2-7 concisely shows portions as well as other common formats like pie and donut charts, Relying on data collected by a governmental agency may be considered either a strength or a limitation. A strength is the very large collection of fatality data, with considerable information organized in an ordered hierarchical manner. This information contributes to the multi-faceted national efforts to prevent occupational illnesses, injuries and fatalities by providing objective data for prioritizing resources. A limitation is the data only contains fatalities without any means of comparing cases to controls. The example of the three workers who had their fall arrested by a fall- protection harness but died anyway illustrates the inherent limitations of case only data.
Table 3:Breakdown of 2,066 occupational transportation fatalities according to transportation Level II categories.

Table 4:E&E category 6 Level II and selected Level III categories.

Recommendations for further research is to conduct human trials to learn more about graphic formats for these sorts of data presentations. The formats presented in this article appeal to the author, but may not appeal to others. In conclusion, the paper represents the author’s attempt to extract the most important data from the BLS data tables and illustrate some options for improving communication with the public.
Acknowledgement
Support for this project was provided in part by the Montana Technological University’s Training Project Grant (T03 OH008630) from the National Institute for Occupational Safety and Health. The contents of this publication are solely the responsibility of the author and do not represent the official views of the Centers for Disease Control and Prevention, the National Institute for Occupational Safety and Health, or the Department of Health and Human Services.
Conflict of Interest
None.
References
- US Bureau of Labor Statistics (2023) Injuries, Illnesses, and Fatalities, Table A-9. Fatal occupational injuries by event or exposure for all fatal injuries and major private industry sector, all United States the Economic Daily.
- S. Bureau of Labor Statistics (2023). National census of Fatal occupational injuries in 2022. US Department of Labor, Bureau of Labor Statistics, Washington DC, USA.
- Lortie M, Rizzo P (1998) The classification of accident data. Safety Science 31(1): 31-57.
- Tedone T (2017) Counting injuries and illnesses in the workplace: An international review. MLR, September 2017: 1-22.
- Shappell SA, Wiegmann DA (2000) The human factors analysis and classification system-HFACS: Final Report. Washington, D.C. U.S. Department of Transportation Federal Aviation Administration.
- Patterson JM, Shappell SA (2010) Operator error and system deficiencies: Analysis of 508 mining incidents and accidents from Queensland, Australia using HFACS. Accid Anal Prev 42(4): 1379-1385.
- Waskito DH, Bowo LP, Kurnia SHM, Kurniawan I, Nugroho S, et al. (2024) Analysing the impact of human error on the severity of truck accidents through HFACS and Bayesian network models.
- Liou JJH, Liu PCY, Luo SS, Lo HW, Wu YZ (2022) A hybrid model integrating FMEA and HFACS to assess the risk of inter-city bus accidents. Complex Intell Syst 8: 2451-2470.
- Zhang Y, Jing L, Sun C, Fang J, Feng Y (2019) Human factors related to major road traffic accidents in China. Traffic Inj Prev 20(8): 796-800.
- Rad MA, LeFsrud LM, Hendry MT (2023) Application of system thinking accident analysis methods: A review for railways. Safety Science 160: 106066.
- Wu Y, Zhang S, Zhang X, Lu Y, Xiong Z (2023) Analysis on coupling dynamic effect of human errors in aviation safety. Accid Anal Prev 192: 107277.
- Zhang M, Zhang D, Goerlandt F, Yan X, Kujala P (2019) Use of HFACS and fault tree model for collision risk factors analysis of icebreaker assistance in ice-covered waters. Safety Science 111: 128-143.
- Yildiz S, Uğurlu Ö, Wang J, Loughney S (2021) Application of the HFACS-PV approach for identification of human and organizational factors (HOFs) influencing marine accidents. Reliability Engineering & System Safety 107395.
- Galantucci E, Monaco K (2022) Challenges in calculating occupational fatalities. MLR p. 1-7.
- S. Department of Defense (2012) MIL-STD-882E, Department of Defense Standard Practice: System Safety.
- Jensen RC, Hansen H (2020) Selecting appropriate words and phrases for naming the rows and
- Dong X, Largay JA, Wang X, Windau (2014) Fatalities in the construction industry: Findings from a revision of the BLS Occupational Injury and Illness Classification System.
- Drudi D (2015) The quest for meaningful and accurate occupational health and safety statistics. MLR.
- Pegula S (2004) Fatal occupational injuries at road construction sites. MLR Nov 127(12): 43-47.
- Lortie M, Rizzo P (1998) Reporting and classification of loss of balance accidents. Safety Science 33: 69-85.
- Hsiao H, Turner N, Whisler R, Zwiener J (2012) Impact of harness fit on suspension tolerance. Hum Factors 54: 346-357.
- Dong XS, Largay JA, Choi SD, Wang X (2017) Fatal falls and PFAS use in the construction industry: Findings from the NIOSH FACE reports. Accid Anal Prev 102: 136-143.
- Bunney Z, Jensen R, Autenrieth D (2021) Fall-protection harness training: Donning skill improves with up to four repetitions. Safety 7(1) 16: 7010016.
- Jensen RC (2020) Risk-reduction methods for occupational safety and health, 2ND Ed. New Jersey, USA, Wiley pp. 406-407.
columns of risk assessment matrices. Int J Envir Res Public Health 17(15): 5521.
-
Roger C Jensen*. Occupational Fatality Surveillance Data: Communication Issues, Misunderstandings, and Misuses. Acad J Health Sci & Res. 1(2): 2024. AJHSR.MS.ID.000510.
Occupational Fatalities; Surveillance Data; Misleading Uses; Errors; Bureau of Labor Statistics; Data Communication; Graphics
-

This work is licensed under a Creative Commons Attribution-NonCommercial 4.0 International License.


