 Opinion
Correlation of Serum Adiponectin with Hepatic Fibrosis in Patients with Non-Alcoholic Fatty Liver Disease
Golam Mustafa*1, Harun Or Rashid1, Shahinul Alam1, Mahbubul Alam1, Rashed Mustafa2 and Nooruddin Ahmad1
1Bangabandhu Sheikh Mujib Medical University, Dhaka, Bangladesh
2Khwaja Yunus Ali Medical College, Sirajgonj, Bangladesh
Golam Mustafa, Department of Hepatology, Bangabandhu Sheikh Mujib Medical University, Dhaka, Bangladesh.
Received Date: July 16, 2019; Published Date: July 18, 2019
Abstract
Objective: Nonalcoholic fatty liver disease (NAFLD) is a metabolic disorder characterized by excessive triglyceride accumulation in the hepatocytes. NAFLD describes a spectrum of clinicopathological changes extending from simple steatosis through non-alcoholic steatohepatitis (NASH) to fibrosis. Aim of the study was to assess the correlation of serum adiponectin with severity of NAFLD.
Methods: It was an observational, cross sectional study. Fifty patients who fulfilled the inclusion criteria of NAFLD were included in the study; they were studied with liver histology and serum adiponectin level. Correlation of serum adiponectin with non- NASH, NASH and stages of liver fibrosis was analyzed.
Result: Mean age was 38.0±9.4 years with range from 20 to 59 years with female predominance (62%). Serum adiponectin level was 9.09±3.68 microgram/mL in patients with non-NASH(n=17), and it was 4.90±2.34 microgram/mL in those with NASH(n=33). Serum adiponectin was 6.57±3.84 microgram/mL in 38 patients with fibrosis score 1; it was 5.51±1.84 microgram/mL in 10 patients with fibrosis score 2; and it was 5.59±1.08 microgram/mL in 2 patients with fibrosis score 3.
Conclusion: Serum adiponectin level decreased in patients with NASH than in patients not having NASH, and it is also reduced in patients with advanced hepatic fibrosis.
Keywords: NAFLD; NAS; Adiponectin; NASH
Introduction
Nonalcoholic fatty liver disease (NAFLD) is a metabolic disorder characterized by excessive triglyceride accumulation in the hepatocytes. It is a hepatic manifestation of metabolic syndrome [1]. The prevalence of NAFLD in India above 20 years age was 18.9% [2]. The prevalence of NAFLD increased with increased age. Obesity, diabetes mellitus (DM), insulin resistance (IR) are predisposing factors for NAFLD. Although NAFLD is more common in subject with obesity and diabetes mellitus (DM), it also occurs in lean and non-diabetic subject [3,4,5]. Non obese was 25.6% among NAFLD patient in Bangladesh. About 53.1 % of non-obese NAFLD cases were NASH [6].
NAFLD consists of a wide spectrum of conditions, ranging from simple steatosis to nonalcoholic steatohepatitis (NASH) which can progress to cirrhosis and hepatocellular carcinoma (HCC). The prevalence of NASH is 42.4% among NAFLD patients in Bangladesh [7]. The contrasting clinical course of NASH vs non-NASH fatty liver (NNFL) indicates that these two conditions diverge early in the course of NAFLD. A progression to cirrhosis is usually preceded by longstanding histological NASH and is infrequent during NNFL. Overall, 37.5% of normal serum Alanine Aminotransferase (ALT) group had NASH or advanced fibrosis, whereas 53% of elevated ALT had NASH or advanced fibrosis [8].
NASH is a common cause of “cryptogenic” cirrhosis, which accounts for 10%-20% of all cirrhosis cases [9]. The pathogenesis of NAFLD is the “multi-hit hypothesis” with metabolic syndrome playing a major role, due to insulin resistance and the proinflammatory process mediated by different proteins and immune components [10]. Adiponectin also known as adipocyte complement related protein of 30kDa (ACRP30), is a protein that is a product of the adipose tissue-specific transcript-1 (apM1) gene [11]. Adiponectin is induced during adipocyte differentiation, and its secretion is stimulated by insulin and binds to two different receptors termed AdipoR1 and AdipoR2. AdipoR1 is found primarily in skeletal muscle whereas AdipoR2 is primarily found in hepatic tissue [12].
Adiponectin is a fat-derived hormone that circulates at relatively high concentrations in the serum [13] also derived from the placenta in pregnancy. This adipocytokine is believed to mediate insulin action in insulin-sensitive tissues, such as the liver and the muscles, in both humans and animals [14]. Especially in the liver, adiponectin stimulates glucose utilization and fatty acid oxidation by activating the adenosine monophosphate-activated protein kinase, thus mediating hepatic insulin action [15,16]. There are increasing data in the literature indicating that the serum adiponectin correlated with Homeostatic model assessment (HOMA) (Pearson correlation coefficient r = -0.544, P=0.001).
Adiponectin concentration was negatively associated with higher stages of fibrosis (one-way analysis of variance, P=0.007), and was not associated with NAFLD activity score. Low serum adiponectin levels in NAFLD patients are suggestive of advanced fibrosis. Therefore, assessment of serum adiponectin levels may be useful in clinical follow-up [17]. The pathological committee of the NASH clinical research network designed and validated a histological feature scoring system that address the spectrum of lesions of NAFLD and proposed Nonalcoholic fatty liver disease Activity Score (NAS) for use of clinical trial.
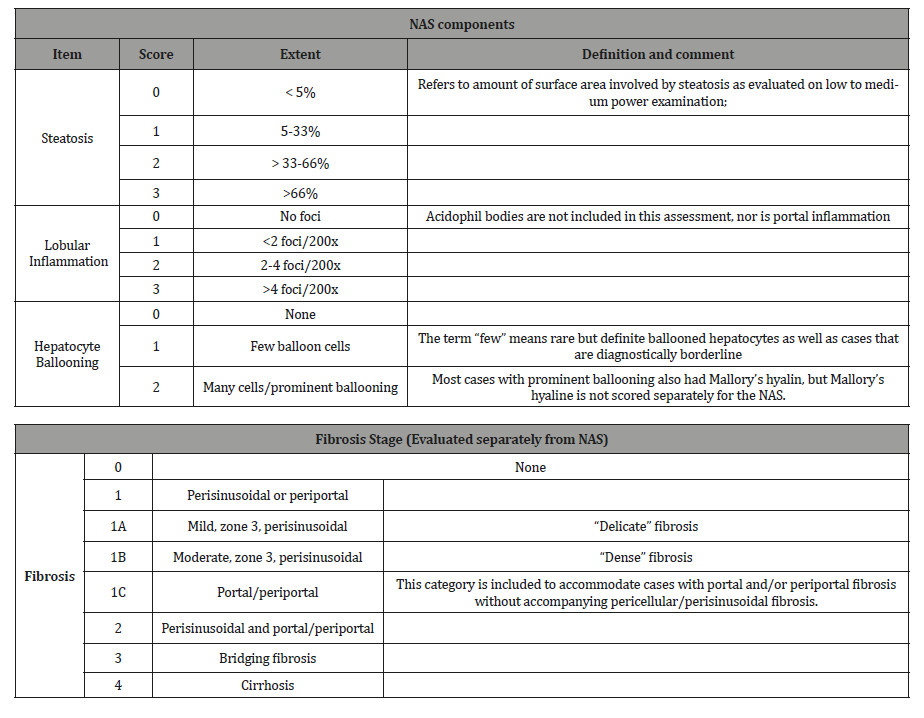
The scoring system comprises steatosis (0-3), lobular inflammation (0-3), hepatocellular ballooning (0-2) and a separate fibrosis staging (0-4). The proposed NAS is the sum of steatosis, lobular inflammation and hepatocellular ballooning score. NAS of ≥5 correlated with diagnosis of NASH and biopsy with scoring of 3-4 suggestive of NASH and less than 3 were diagnosed as non- NASH fatty liver [18]. Other pathological findings such as Mallory denk bodies or perisinusoidal fibrosis can make the diagnosis even stronger. Fibrosis Stage evaluated separately from NAS; Stages F0, F1, F2 were considered early fibrosis and Stage F3, F4 were considered to be advanced fibrosis [19]. As NASH, fibrosis and cirrhosis is a histological diagnosis, liver biopsy is needed to establish or rule it out definitively. However, it is not practical to do biopsy in every patient with suspected NAFLD. Therefore, a noninvasive marker that can signify the presence or absence of NASH and/or fibrosis is highly demanding.
NAFLD and Adiponectin
NAFLD has a multifactorial disorder associated with obesity, insulin resistance, type 2 diabetes and dyslipidemia. Moreover, genetic mutations also play a role in predisposition to the development and progression of NAFLD [20]. Especially in the liver, adiponectin stimulates glucose utilization and fatty acid oxidation by activating the adenosine monophosphate-activated protein kinase, thus mediating hepatic insulin action 15,16. Adiponectin also manifests anti-inflammatory action by neutralizing tumor necrosis factor-alpha13 and antifibrotic action by inhibiting hepatic stellate cell proliferation and migration [21]. It was found that serum adiponectin levels in patients with NAFLD ranged between 0.4 and 13.2 μg/mL, which is lower compared with normal values (5 to 30 μg/mL) and is consistent with the findings of other investigators in patients with NAFLD [22]. Objective of the study was to correlate serum adiponectin level with severity of nonalcoholic fatty liver disease (NAFLD).
NAFLD
It is reported that almost 10% to 20% of individuals with NAFLD have NASH and 10%-15% of individual with NASH progress to cirrhosis [23]. The prevalence of NASH is 42.4% among NAFLD patients in Bangladesh [7]. Longitudinal studies with serial biopsies have shown that approximately one-third of NASH patients develop advanced fibrosis (stage 3 or 4 fibrosis) over the course of 5-10 years from the time of the initial diagnosis [24,25]. Although it is usually relatively slow, the progression to cirrhosis can occur in as little as 2-3 years.
NASH
Is a common cause of “cryptogenic” cirrhosis, which accounts for 10%-20% of all cirrhosis cases [9]. Among patients diagnosed with NASH related cirrhosis, the risk of developing portal hypertension (a major complication) is 17%, 23% and 52% at 1, 3 and 10 years, respectively. Among the patients with early-stage of NASH, the overall mortality over 10-15 years is approximately 10%-12%, being significantly higher in the NASH vs the NNFL patients, compared to the general population. The risk of developing decompensated cirrhosis is 5%-10%, and that of hepatocellular cancer is 1%-2%. There is a ten-fold increased risk of cirrhosis relative to the general population [26].
Methods
It was an observational cross-sectional study carried out in the department of Hepatology, Bangabandhu Sheikh Mujib Medical University (BSMMU), Dhaka, Bangladesh, during the period from July’2016 to August’2017. Ethical Clearance was approved by the Institutional Review Board (IRB). Sixty-five patients with ultrasonographic evidence of fatty infiltration of the liver attending the outpatient and inpatient department of Hepatology, BSMMU were initially selected. Those with significant alcohol intake (consumption of more than 14 units /week in women and more than 21 units /week in men), history of taking drugs that may cause fatty liver (e.g., tamoxifen, sodium valproate, amiodarone, MTX, corticosteroid), known or overt case of any other liver diseases (e.g., Chronic hepatitis B, chronic hepatitis C, Autoimmune liver disease, Haemochromatosis, Wilson’s disease, Primary biliary cirrhosis), pregnancy, and other co-morbid conditions (e.g., chronic obstructive pulmonary disease, chronic kidney disease, cardiac failure) were excluded from the study. Of the initially included patients, fifty patients (those who have given informed written consent, and those who fulfilled the inclusion criteria) of age 20 to 50 years, with Nonalcoholic fatty liver disease (NAFLD) were finally included.
Study procedure
Included patients were advised to do serum sampling for complete blood count (CBC), fasting blood sugar (FBS), blood sugar 2 hours after breakfast (BS 2hrs ABF), Bilirubin, Alanine Aminotransferase (ALT), Aspartate Aminotransferase (AST), Prothrombin Time (PT), Thyroid Stimulating Hormone (TSH), Fasting lipid profile, HBsAg (ELISA), Anti HBc (Total) & Anti-HCV (ELISA), Serum ferritin, Serum ceruloplasmin, and antinuclear antibody (ANA). The degree of insulin resistance (IR) was determined by the homeostatic model assessment (HOMA) using the formula, HOMA-IR = (FPI × FPG)/22.5. Patients with HOMA >1.78 were considered insulin resistant [28].
They were hospitalized for liver biopsy after adequate counseling. Percutaneous liver biopsy was done for each patient following standard procedure. Following biopsy, liver tissue, preserved in 10% formol saline, was sent to a Pathologist for NAS & fibrosis score. On the morning of liver biopsy, 3 ml of venous blood sample was drawn to determine serum adiponectin level. Serum adiponectin levels were determined by an enzyme-linked immunosorbent assay (ELISA) kit (Quintikine) obtained from R&D Systems (Wiesbaden-Nordenstadt, Germany).
The histological diagnosis of NAFLD (NNFL & NASH) was based on NAFLD Activity Score (NAS), and stages of fibrosis were evaluated by fibrosis score. All other biochemical tests were performed using conventional automated analyzers within the Biochemistry Laboratory at BSMMU. All biochemical analyses were performed in a “blinded” manner.
Data processing and data analysis
Data were collected using structured questionnaire. The statistical analysis was carried out using the Statistical Package for Social Sciences (SPSS) version 23.0 for Windows (SPSS Inc., Chicago, Illinois, USA). The mean values were calculated for continuous variables. The quantitative observations were indicated by frequencies and percentages. Chi-Square test was used to analyze the categorical variables, shown with cross tabulation. Student t-test was used for continuous variables. ANOVA test was used to analyze the continuous variables, shown with mean and standard deviation. Pearson’s and spearman’s correlation coefficients were used to test the relationship between the groups. Sensitivity and specificity were calculated by using the area under the receiver operating characteristic (ROC) curves. P value of <0.05 was taken as significant.
Results
Baseline characteristics of the study population Table 1.
Table 1:Baseline characteristics of the study population (n=50).
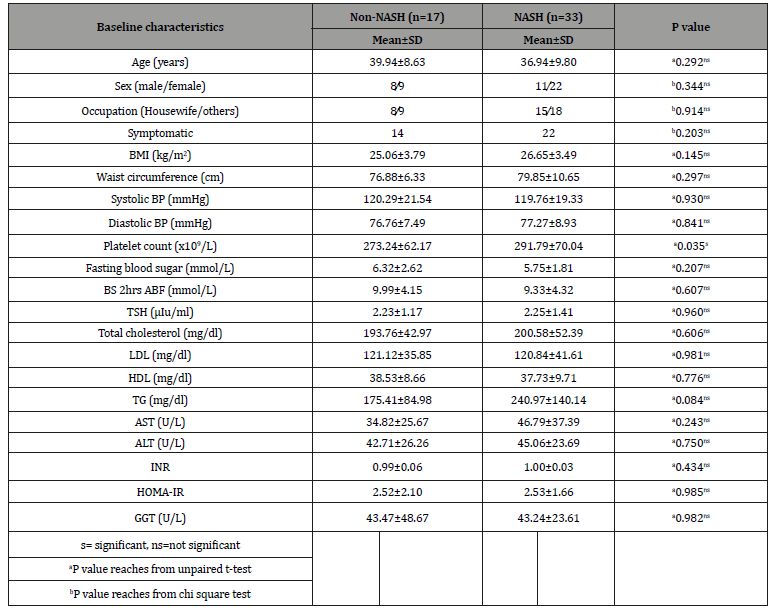
The mean age was found 38.0±9.4 years with range from 20 to 59 years. Regarding sex distribution of the study patients, it was observed that 31(62.0%) patients were female and 19(38.0%) patients were male. Complaints of the study patients, it was observed that 36(72.0%) patients had symptomatic, 29(58.0%) had pain in right upper abdomen (RUA), 27(54.0%) had nausea, 5(10.0%) had mass in RUA and 5(10.0%) had weight gain. Body Mass Index (BMI) was 26.1±3.6 kg/m2, systolic blood pressure (BP) was 119.9±19.9 mmHg and diastolic BP was 77.1±8.4 mmHg. The hematological and biochemical parameters were as follows: platelet count was 285.5±67.4 x10⁹/L, FBS was 5.9±2.1 mmol/L, BS 2hrs ABF was 9.6±4.2 mmol/L, total cholesterol was 198.3±49.1 mg/dl, high density lipoprotein (HDL) was 38.0±9.3 mg/dl, triglyceride (TG) was 218.7±127.2 mg/dl, AST/ALT ratio was 1.0±0.8, ALP was 112.1±60.9 U/L, gamma glutamyl transpeptidase (GGT) was 43.3±33.7U/L, INR was 1.0±0.45, HOMA-IR was 2.52±1.79, serum albumin was 4.6±0.3 g/dl, and serum bilirubin was 0.6±0.3 mg/ dl. It was observed that the mean platelet count was statistically significant between non-NASH and NASH group but other baseline characteristics were not statistically significant in non-NASH and NASH group and stages of fibrosis.
Association between serum adiponectin with NAFLD: Table-2
Table 2:Association between serum adiponectin with NAFLD (n=50).
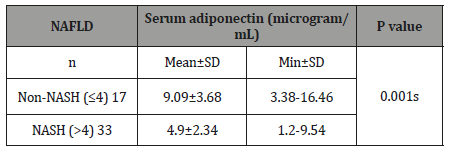
Seventeen patients were found to have non-NASH and their serum adiponectin was 9.09±3.68 microgram/mL. Thirty three patients were found to have NASH and their serum adiponectin was 4.90±2.34 microgram/mL. The mean difference was statistically significant (p<0.05) between two groups. About two thirds of patients were in NASH group.
Association between serum adiponectin with fibrosis score: Table-3
Table 3:Association between serum adiponectin with fibrosis score (n=50).

Thirty-eight patients were found fibrosis score 1 and their serum adiponectin was 6.57±3.84 microgram/mL. Ten patients were found to have fibrosis score 2 and their serum adiponectin was 5.51±1.84 microgram/mL. Two patients were found to have fibrosis score 3 and their serum adiponectin was 5.59±1.08 microgram/ mL. The mean difference was not statistically significant (p>0.05) between two groups. Very negligible number of patient were in significant fibrosis group (F2,3) and majority of patients in F1 group.
Association between serum adiponectin with BMI
Eighteen patients were found to have BMI ≤25.0 kg/m2 and their serum adiponectin was 6.94±4.30 microgram/mL. Thirty-two patients were found BMI >25.0 kg/m2 and their serum adiponectin were 5.97±2.92 microgram/mL. The mean difference was not statistically significant (p>0.05) between two groups.
Correlation between NAFLD Activity Score and serum adiponectin level Figure 1.
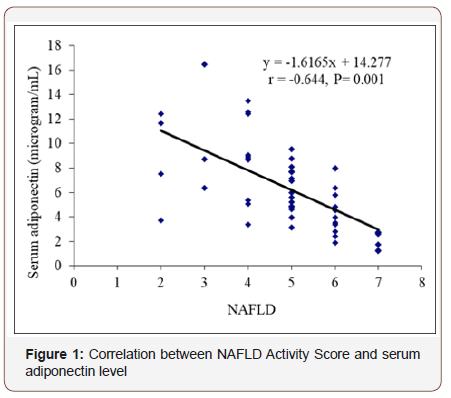
In this figure it was observed that negative correlation between serum adiponectin levels with NAFLD Activity Score. Correlation coefficient was (r= -0.644) that signify moderate negative correlation and that was statistically significant(p=0.001).
Correlation between liver fibrosis Score and serum adiponectin level
In this series we also observed that, there is negative correlation between hepatic fibrosis score and serum adiponectin level. Correlation coefficient was (r=-0.086) that signify negligible negative correlation between early fibrosis and significant fibrosis that was statically significant (p=0.533).
Receiver-operator characteristic (ROC) curve of serum adiponectin for prediction of NASH Figure 2
Based on the receiver-operator characteristic (ROC) curves serum adiponectin level had area under curve 0.167. Receiveroperator characteristic (ROC) was constructed by using serum adiponectin, which gave a cut off value <4.8 microgram/mL, with 51.5% sensitivity and 11.8% specificity for prediction of NASH.
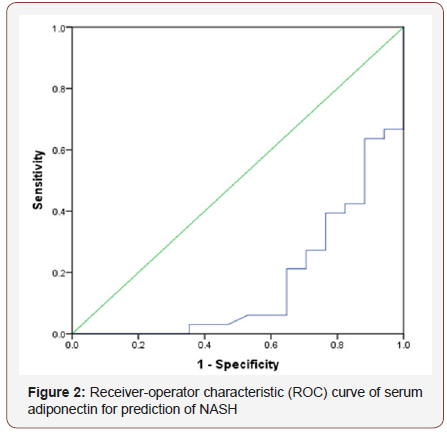
Receiver-operator characteristic (ROC) curve of serum adiponectin for prediction of NASH
It was observed in univariate analysis that obesity and serum adiponectin level were significantly associated with NASH but other variables were not associated with development of NASH.
Risk factors analysis for NASH (Multivariate logistic regression analysis)
A subject with serum adiponectin (<5 microgram/mL) vs serum adiponectin (≥5 microgram/mL) had 4.68 (95% CI 0.54 to 40.0) times increase in odds having NASH. Also, a subject with obese vs non-obese had 11.0 (95% CI 0.01 to 46.18) times increase in odds having NASH. Serum adiponectin level and obesity were significantly associated with NASH.
Discussion
This cross-sectional study was carried out including 50 NFALD patients to assess the correlation of serum adiponectin level with severity of nonalcoholic fatty liver disease (non-NASH fatty liver, NASH, and stages of fibrosis).
In the present study, it was observed that, two third of patients were below 40 years of age. It is probably due to altered food, and inadequate physical work habit. In 2016 a study by Jamali et al [27] showed the mean age was 37.02±9.82. Another study by Pandey et al. in 2015 [29] also showed alike observation; they showed the mean age in year’s ± SD of the study subjects was 46.00±10.12 years in diabetic fatty liver disease group, 41.28±8.12 years in non diabetic fatty liver disease group and 41.24±7.23 in the control group. Wang Z et al. 2015 [30] observed prevalence of NAFLD 27.8% in women aged more than 55 years, the age prevalence is not consistent with our study.
Regarding sex distribution of the study patients, it was observed female were predominant. Female predominant observation probably due to sedentary life style. A study by Balmer et al. 2010 [31] showed 136 (58.62%) men and 96(41.37%) women, which is inconsistent with our observation. In a study in 2013, Alam et al [7] found that NAFLD is more prevalent in female among Bangladeshi population; our observation is similar with this finding.
The mean difference of HOMA-IR was not statistically significant (p>0.05) between non NASH and NASH groups. There are increasing data in the literature indicating that the serum adiponectin correlated with HOMA-IR (Pearson correlation coefficient r= -0.544, P=0.001). But, finding in a study by Esteghamati et al. in 2010 [28] is inconsistent with the finding in the current study.
In this study it was observed that two third of the patient were NASH group. As most of the patient were high BMI group they were more prone to develop NASH. Study by Savvidou et al. in 2009 [17] had similar observation that, 20 (60.6%) patients had ‘‘definite’’ NASH (NAS≥5), 10 patients had features suggestive of NASH (NAS=3 to 4), and 3 patients had simple steatosis (NAS<3).
The mean difference of serum adiponectin between non-NASH and NASH group was statistically significant (p=0.001).As about half of the patient had high ALT and more than half of the patient had high AST and ALT ratio, also two third patient had high BMI they may present with significant inflammatory change in liver. Savvidou et al. 2009 [17] observed comparison of means after logarithmic transformation of adiponectin concentration revealed lower serum levels of this cytokine as NAS increased. However, the difference did not reach statistical significance (one-way ANOVA, P=0.316). Similar study by Arvaniti et al. 2008 [32] observed patients with confirmed NASH had lower serum adiponectin levels in comparison to non-NASH; it was 6.6±4.7 microgram/mL vs 9.2±4.8 microgram/mL, p = 0.01 that are consistent with this study. Another study Shimada et al. 2007 [33] reported that the serum adiponectin level was found to be significantly lower with NASH group (3.6 μg/mL) than in the simple steatosis (non-NASH) group (6.0 μg/mL) (P < 0.001).
In this study we observed that the mean difference of serum adiponectin and stages of fibrosis was not statistically significant (p>0.05); this may be because very negligible number of patient were in significant fibrosis group (F2, 3) and majority of patients in F1 groups. Bugianesi et al. in 2005 [34] found in a study that, adiponectin is related to hepatic fat content and not to necroinflammatory activity and fibrosis stage that were similar to current study. A study by Savvidou et al. in 2009 [17] observed that adiponectin was normally distributed after logarithmic transformation; this is not consistent with our observation. Comparison of means with one-way ANOVA revealed that serum adiponectin levels differed significantly among different stages of hepatic fibrosis (F=4.18 with P=0.007). Musso et al. in 2005 [22] in a study found that adiponectin could predict patients with higher necroinflammatory grade and fibrosis stage from those with milder histological findings that were not identical to this study.
Negative correlation between serum adiponectin levels with NAFLD Activity Score (NAS) (r= -0.644; p=0.001) was observed that was statistically significant. In 2006, Targher et al. [35] in a study showed that after logistic regression analysis, low adiponectin levels independently predicted hepatic steatosis and necroinflammation but not fibrosis after adjustment for age, sex, BMI, HOMA-IR and Metabolic syndrome (MetS) components those were consistent with the present study.
In this series also negative correlation (r= -0.086; p=0.533, negligible) between hepatic fibrosis score and serum adiponectin level was observed but not statistically significant. In a study by Savvidou et al. in 2009 [17] explored that the correlation between adiponectin levels and fibrosis stage revealed a negative correlation (r=-0.551 P=0.00048); the finding is consistent with the present study. Based on the receiver-operator characteristic (ROC) curves serum adiponectin level had area under curve 0.167. ROC was constructed by using serum adiponectin, which gave a cut off value <4.8 microgram/mL, with 51.5% sensitivity and 11.8% specificity for prediction of NASH. In the study by Shimada et al. in 2007, the AUC was high (0.765) in the early-stage NASH group, and it was also the highest among all other markers. The sensitivity of the serum adiponectin level in the diagnosis of early-stage NASH was 68%, which was higher than for any other factors, while its specificity was 79% that were inconsistent with the current study.
After multivariable logistic regression analysis, serum adiponectin (<5 microgram/mL) vs serum adiponectin (≥5 microgram/mL level were not associated with early fibrosis (F1) and significant fibrosis (≥F2) but a subject with serum adiponectin (<5 microgram/mL) vs serum adiponectin (≥5 microgram/mL) also had 4.68 (95% CI 0.54 to 40.0) times increase in odds having NASH. Targher et al. in 2006 [35] in a study showed that logistic regression analysis, low adiponectin levels independently predicted hepatic steatosis and necroinflammation but not fibrosis which was approximately similar with this study.
Conclusion
Serum adiponectin level decreased in patients with NASH than in patients not having NASH, and it is also reduced in patients with advanced hepatic fibrosis. Serum adeponectin could be a marker to differentiate between non-NASH & NASH.
Acknowledgment
None.
Conflict of Interest
No Conflict of Interest.
References
- Eckel RH, Grundy SM, Zimmet PZ (2005) The metabolic syndrome. Lancet 365: 1415-1428.
- Amarapurkar D, Kamani P, Patel N, Gupte P, Kumar P, et al. (2007) Prevalence of nonalcoholic fatty liver disease: Population based study. Ann Hepatol 6(3): 161-163.
- Das K, Mukherjee PS, Ghosh A, Ghosh S, Mridha AR, et al. (2010) Non-obese population in a developing country has a high prevalence of nonalcoholic fatty liver and significant liver disease. Hepatology 51: 1593-1602.
- Bellentani S, Scaglioni F, Marino M, Bedogni G (2010) Epidemiology of non-alcoholic fatty liver disease. Dig Dis 28: 155-161.
- Madan K, Batra Y, Gupta SD, Chander B, Rajan KD, et al. (2006) Nonalcoholic fatty liver disease may not be a severe disease at presentation among Asian Indians. World J Gastroenterol 12(21): 3400-3405.
- Alam S, Gupta UD, Alam M, Kabir J, Chowdhury ZR, et al. (2014) Clinical, anthropometric, biochemical, and histological characteristics of nonobese nonalcoholic fatty liver disease patients of Bangladesh. Indian journal of gastroenterology: official journal of the Indian Society of Gastroenterology 10: 10-17.
- Alam S, Noor-E-Alam SM, Chowdhury ZR, Alam M, Kabir J, et al. (2013) Nonalcoholic steatohepatitis in nonalcoholic fatty liver disease patients of Bangladesh. World J Hepato 5(5): 281-287.
- Verma S, Jensen D, Hart J, Mohanty SR (2013) Predictive value of ALT levels for non-alcoholic steatohepatitis (NASH) and advanced fibrosis in non-alcoholic fatty liver disease (NAFLD). Liver Int 33(9): 1398-1405.
- Powell EE, Cooksley WG, Hanson R, Searle J, Halliday JW, et al. (1990) The natural history of nonalcoholic steatohepatitis: a follow up study of forty-two patients for upto 21 years. Hepatology 11(1): 74-80.
- WHO Global Guidelines (2012) Nonalcoholic Fatty Liver Disease and Nonalcoholic Steatohepatitis.
- Maeda K, Okubo K, Shimomura I, Funahashi T, Matsuzawa, et al. (1996) cDNA cloning and expression of a novel adipose specific collagen-like factor, apM1. Biochem Biophys Res Commun 221: 286-289.
- Meier U, Gressner AM (2004) Endocrine regulation of energy metabolism: review of pathobiochemical and clinical chemical aspects of leptin, ghrelin, adiponectin, and resistin. Clin Chem 50: 1511-1525.
- Tilg H, Hotamisligil GS (2006) Nonalcoholic fatty liver disease: Cytokine-adipokine interplay and regulation of insulin resistance. Gastroenterology 31: 934-945.
- Chandran M, Phillips SA, Ciaraldi T, Henry RR (2003) Adiponectin: more than just another fat cell hormone. Diabetes Care 26: 2442-2450.
- Berg AH, Combs TP, Scherer PE (2002) ACRP30/adiponectin: an adipokine regulating glucose and lipid metabolism. Trends Endocrinol Metab 13: 84-89.
- Vettor R, Milan G, Rossato M (2005) Review article: adipocytokines and insulin resistance. Aliment Pharmacol Ther 22(2): 3-10.
- Savvidou S, Hytiroglou P, Orfanou-Koumerkeridou H, Panderis A, Frantzoulis P, et al. (2009) Low serum adiponectin levels are predictive of advanced hepatic fibrosis in patients with NAFLD. J Clin Gastroenterol 43(8): 765-772.
- Kleiner DE, Brunt EM, Van Natta M, Behling C, Contos MJ, et al. (2005) Design and validation of a histological scoring system for nonalcoholic fatty liver desease. Hepatology 41(6): 1313-1321.
- Brunt EM, Janney CG, Di Bisceglie AM, Neuschwander-Tetri BA, Bacon BR, et al. (1999) Nonalcoholic steatohepatitis: a proposal for grading and staging the histological lesions. Am J Gastroenterol 94(9): 2467-2474.
- Erickson SK (2009) Nonalcoholic fatty liver disease. J Lipid Res 50: 412-416.
- Ding X, Saxena NK, Lin S, Xu A, Srinivasan S, et al. (2005) The roles of leptin and adiponectin: A novel paradigm in adipocytokine regulation of liver fibrosis and stellate cell biology. Am J Pathol 166(6): 1655-1669.
- Musso G, Gambino R, Biroli G, Carello M, Faga E, et al. (2005) Hypoadiponectinemia predicts the severity of hepatic fibrosis and pancreatic beta-cell dysfunction in nondiabetic nonobese patients with non-alcoholic steatohepatitis. Am J Gastroenterol 100: 2438-2346.
- Pasumarthy L, Srour J (2010) Nonalcoholic Steatohepatitis: a review of the literature and updates in management. South Med J 103(6): 547-550.
- Matteoni CA, Younossi ZM, Gramlich T, Boparai N, Liu YC, et al. (1999) Nonalcoholic fatty liver disease: a spectrum of clinical and pathological severity. Gastroenterology 116: 1413-1419.
- Argo CK, Northup PG, Al-Osaimi AM, Caldwell SH (2009) Systematic review of risk factors for fibrosis progression in nonalcoholic steatohepatitis. J Hepatol 51: 371-379.
- Hui JM, Kench JG, Chitturi S, Sud A, Farrell GC, et al. (2003) Long-term outcomes of cirrhosis in nonalcoholic steatohepatitis compared with hepatitis C. Hepatology 38: 420-427.
- Jamali R, Razavizade M, Arj A, Mohammad Hossein Aarabi (2016) Mohammad Hossein Aarabi. Serum adipokines might predict liver histology findings in non-alcoholic fatty liver disease. World J Gastroenterol 22: 5096-5103.
- Esteghamati A, Ashraf H, Khalilzadeh O, Zandieh A, Nakhjavani M, et al. (2010) Optimal cut-off of homeostasis model assessment of insulin resistance (HOMA-IR) for the diagnosis of metabolic syndrome: third national surveillance of risk factors of non-communicable diseases in Iran. Nutrition & Metabolism 7: 26.
- Pandey AK, Jalihal U, Kalra P, Gowda VMN, Prabhu VMD, et al. (2015) Estimation of adiponectin levels in diabetic, non-diabetic fatty liver diseases and healthy controls. Int J Res Med Sci 3(1): 140-146.
- Wang Z, Xu M, Hu Z, Shrestha UK (2015) Prevalence of NAFLD and its metabolic risk factor in women of different ages and BMI. Menopause 22(6): 667-673.
- Balmer ML, Joneli J, Schoepfer A, Stickel F, Thormann W, et al. (2010) Significance of serum adiponectin levels in patients with chronic liver disease. Clinical Science 119: 431-436.
- Arvaniti VA, Thomopoulos KC, Tsamandas A, Makri M, Psyrogiannis A, et al. (2008) Serum adiponectin levels in different types of non-alcoholic liver disease. Correlation with steatosis, necroinflammation and fibrosis. Acta Gastroenterol Belg 71(4): 355-360.
- Shimada M, Kawahara H, Ozaki K, Fukura M, Yano H, et al. (2007) Usefulness of a Combined Evaluation of the Serum Adiponectin Level, HOMA-IR, and Serum Type IV Collagen 7S Level to Predict the Early Stage of Nonalcoholic Steatohepatitis. Am J Gastroenterol 102: 1931-1938.
- Bugianesi E, Pagotto U, Manini R, Vanni E, Gastaldelli A, et al. (2005) Plasma adiponectin in nonalcoholic fatty liver is related to hepatic insulin resistance and hepatic fat content, not to liver disease severity. J Clin Endocrinol Metab 90: 3498-3504.
- Targher G, Bertolini L, Rodella S, Zoppini G, Scala L, et al. (2006) Associations between plasma adiponectin concentrations and liver histology in patients with nonalcoholic fatty liver disease. Clinical Endocrinology 64: 679-683.
-
Golam Mustafa, Harun Or Rashid, Shahinul Alam, Mahbubul Alam, Rashed Mustafa, et al. Correlation of Serum Adiponectin with Hepatic Fibrosis in Patients with Non-Alcoholic Fatty Liver Disease. Acad J Gastroenterol & Hepatol. 1(2): 2019. AJGH.MS.ID.000509
-
NAFLD, NAS, Adeponectin, NASH, Hepatocytes, Fatty liver, Cryptogenic, Liver disease, Haemochromatosis, Wilsons disease, Pulmonary disease, kidney disease
-

This work is licensed under a Creative Commons Attribution-NonCommercial 4.0 International License.


