

 Research Article
Seasonal and Hydrological Variability of Surface Water Quality Downstream of Zio River, South Togo
Received Date: October 02, 2024; Published Date: November 08, 2024
Abstract
This study aims at assessing the variability of water quality according to seasons and hydrological regimes at downstream of Zio River Basin. Nine sampling sites were investigated during four periods corresponding to the dry and rainy seasons and three hydrological regimes: low flow, high flow, and transition. We apply three water quality indices (WQIs): salinity index (SI), organic pollution index (OPI), and global pollution index (GPI). Statistical tests and boxplots were used to evaluate the trends of variation of raw parameters and indices within seasons and hydrological regimes while Piper diagram was used for the assessment of hydro geochemistry variability. The trends of values and statistical test on raw parameters as the indices indicated a significant difference of water quality within seasons and hydrological regimes. Furthermore, we found that the higher values of salinity index, organic pollution index, total dissolved solids and salinity parameters were obtained during the dry season or the low flow regime. These high values were recorded in three sites closest to the mouth of the river, revealing the seawater intrusion. Ca-Mg- HCO3 and Na-K- HCO3 water types dominated among the hydro chemical facies, with accessorily Na-K-Cl water types. The sequence of major ions’ abundance was in the following order of Na+ > Ca2+ > Mg2+ > K+ for cations and of HCO3-> Cl− > SO42− > NO3- for anions during the high flow regime, transition and rainy season. This sequence was changed to the following order of Na+ > K+ > Ca2+ > Mg2+ for cations and Cl− > HCO3-> SO42− > NO3- for anions from the low flow regime and dry season altogether, indicating the seawater intrusion during the low flow regime or the dry season at the three sites closest to the mouth of the river. This study could help inform water-management decision-making regarding the planning and sustainable use of coastal water resources and ecosystem services in the context of climate change.
Keywords: Seasonal; Hydrological regime; Seawater Intrusion; Zio River; Pollution
Introduction
Among all natural resources, water is the most essential and precious. There are organisms, such as anaerobes, which can survive without oxygen but no organism can survive without water [1, 2]. Therefore, the maintenance of optimal quality and quantity of water is a major concern in the context of increasing water needs [3]. Although we turn to groundwater for drinking, surface water remains an important resource for sustainable uses such as agriculture and domestic purpose [4, 5]. Rivers are important tributaries of surface water resources with many uses and services like food, hydropower energy, socio-economic activities such as agriculture, breeding, mining (sand and gravel), tourism, aquaculture, fisheries, construction of dams, locks and weirs, reservoirs, flood walls, barriers and dikes [6-9]. They therefore contribute to the countries’ development by providing these benefits and services. Although, they provide many goods and services to humans, rivers are affected by strong negative impacts that limit their availability for some uses [10-13]. Among aquatic ecosystems, rivers are the most threatened and modified by many pressures including chemical pollution, flow/hydrological regimes alteration induced by climate change and habitat degradation [14, 11, 15, 9]. As ocean water content in terms of dissolved elements, chemicals and other pollution sources coming from rivers, their quality affected ocean water quality and consequently the water quality worldwide [16, 10, 17]. Therefore, the investigation on the variation of hydrological and seasonal conditions within the rivers system is important for monitoring water quality variation. Indeed, monitoring water quality variation due to seasonal, hydrological, spatial, and temporal conditions can allow the planning of water resources and sustainable use face climate change [10, 11].
Furthermore, assessing spatial-temporal variations has become an essential aspect of managing river water quality and its availability in Togo [18]. In Togo, surface water is divided in three basins such as Mono Basin, Oti Basin and Lake Togo Basin which are threatened by many sources of contamination and pollution [18, 19]. Therefore, water users need information about water quality and its variability for the planning of water uses during the year in the most threatened areas and period of drought. Indeed, useful information about water quality and its variability will allow population to plan and rationalize water uses such as irrigated agriculture and domestic purposes. However, there is a scarcity of information about water quality and its variability in some specific area such as downstream of Zio River basin. Even if some studies were undertaken in the whole basin of Zio River basin [19, 8, 9], no specific study focused on the spatio-temporal variability of water quality due to hydrological and seasonal conditions of Zio River downstream, threatened by many pressures such as anthropogenic pressure and seawater intrusion. This study aims to generate information about seasonal and hydrological conditions influencing water quality during the year.
Material and methods
Study area and sampling
Zio River catchment, located between 6° 08’ 00’’ and 7° 18’ 00” N Latitude and 0° 36’ 00” and 1° 15’ 00” Longitude, drains an area of about 3400 km². In surface area, its downstream represents the most important part of Lake Togo basin, after Alokoegbe dams. The river receives water from many tributaries from Togo mountains. The downstream crossed the capital Lome and is impacted by many ecological pressures and sources of pollution such as wastewater/ wastes discharge, agriculture inputs (fertilizers, pesticides) and sand extraction while its water is used for many purposes. Nine sampling sites (from F1 to F9) were investigated from the mouth towards the upstream (Figure 1) during one year from December to October corresponding to four seasons (two dry seasons and two rainy seasons) and three hydrological regimes (transition flow regime, low flow regime and high flow regimes) as reported in [9]. Therefore, at each site, water was sampled four times according to the hydrological regime and seasonal conditions.

Physicochemical analysis
The parameters such as, pH, electrical conductivity (EC), temperature, and dissolved oxygen (DO) were measured in situ using a multiparameter with accuracy of ± 0.1 for pH, ± 0.5 mg/L for dissolved oxygen, and ± 1% for EC. For the other parameters, 1.5 L of water was sampled in a plastic bottle and stored in an icebox for the chemical parameters’ measurement in the laboratory within 48 hours following the sampling. The chemical oxygen demand (COD) was determined by permanganate method. The bicarbonate (HCO3), magnesium (Mg2+), calcium (Ca2+) and chloride (Cl−) constituents were determined by titration method. The nitrate (NO3-), sulphate (SO42−), phosphate (PO43-), manganese (Mn2+), ammonium (NH4+), nitrite (NO2-) and total iron (Fe) constituents were measured by UV-VIS spectrophotometer while potassium (K+) and sodium (Na+) were determined by Flame Emission Spectrophotometer. The total suspended solid (TSS) were determined by gravimetric method. All these parameters were measured in the Laboratory of Applied Hydrology and Environment of Université de Lomé, with an accuracy ranking from 1 to 2% according to the standard methods as prescribed in [20].
Data analysis
Descriptive statistics were performed to describe trends in the evolution and distribution of data. Whisker boxplot and the Mann-Whitney test (U-test) were used to test seasonal variability while Kruskal-Wallis test (KW-test) and whisker boxplots were used to assess hydrological variability. The boxplots and statistical tests were performed using statistical for Windows 7.0 and were judged significant at 5%. The hydrochemistry trends and the variability of hydrochemical facies were assessed by Piper diagrams using the hydrochemistry software called Diagrammes. For the assessment and the comparison of the overall water quality, three water quality indices (WQIs), the Salinity index (SI), the organic pollution index (OPI), and the global pollution index (GPI), were applied according to [21] as indicated in Equations 1, 2 and 3.
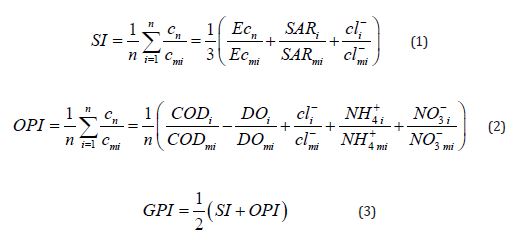
Where Ci is the measured value of the ith parameter, Cmi the maximum tolerable value of the ith parameter, n the number of parameters and SAR is the sodium absorption ratio. For all these indices the value under 1 indicates not significant contamination and good quality, while value greater than 1 indicates contamination and pollution status.
Result and Discussion
Water quality status using raw parameters
Table 1: Descriptive statistics of raw parameters.

Table 1 summarizes the variation trends of raw water quality parameters during the four periods of sampling. The pH, temperature, nitrates, nitrites, ammonium, manganese and phosphates showed the standards deviation (SD) below one and the variance (CV) between 0 and 1, expressing a trend of homogeneous distribution of these parameters during the four periods of sampling. The other parameters showed relatively high values of SD and CV, indicating that they were distributed heterogeneously during the sampling periods.
Electrical conductivity (EC), total dissolved solids (TDS), total suspended solids (TSS), chloride and sodium indicated exceptional high values of SD and CV. These results can be linked to a seasonal effect in some sampling sites during at least one of the four sapling periods. Furthermore, when the 75th percentiles values and the maximum values were compared, it showed that the maximum values of these parameters were recorded within a few samples/ observations and less than 25%. This indicated that EC, TDS, chlorides and sodium were influenced by the same factors such as seasonal or hydrological regimes that could induce the increament of salinity as reported in [4]. The values of SD, CV, 75th percentiles and maximum values recorded for DO, TSS, COD, NH4+, PO43-, NO3- could indicate the point organic pollution related to domestic sewage and agricultural inputs as indicated in [18]. However, the mean values of all parameters are within the WHO limits, guidelines and standards for surface water uses excepted for drinking use. These results indicated that the surface water from Zio River downstream was globally of good quality on the average but affected adversely sometimes by salinity and organic contaminations at some sampling sites. This state of water quality in the whole basin of lake Togo were reported by [18].
Water quality status using WQIs
The status of water quality was also evaluated using water quality indices (Table 2). The water quality indices used in this study are water pollution indices/indicators especially salinity and organic pollution indices. The higher the index value (greater than one), the greater the indicated pollution, and the lower the index value (less than one), the less the indicated pollution. The water quality indices indicated the same trends as raw parameters and then, confirmed the water quality status revealed by raw parameters. Indeed, the SI showed a mean value of 1,32±3,52 with the 75th percentiles and maximum values of 0,60 and 17,06 respectively. This result indicated that more than 75% of samples were not contaminated by salinity and less than 25% can be affected by the salinity from seawater during one of the four sampling periods. The OPI showed a mean value of 0,11±0,41 with the 75th percentiles and maximum values of 0,16 and 1,31 respectively. These values around one or less than one could indicate that the water from Zio River downstream was very slightly affected by organic pollution in a few sampling sites. The GPI indicated that the physicochemical quality of the water in this study was averagely good except in some sites affected by organic pollution and salinity during one period of sampling. Thus, the similar trends of WQIs and raw water quality parameters revealed the character of WQIs indices such as indicators of overall water quality [22, 23], as comprehensive tools for water quality monitoring minimizes the data volume to a great extent and simplifies the expression of water quality status [24, 25].
Table 2: Descriptive statistics of water quality indices and their integrated parameters.

Seasonal and hydrological variability using raw parameters
The test of seasonal variability using U-test is reported in Table 3 where U, Z and p values are indicated. The values of the test such as U, Z and p showed the level of difference between dry season data and rainy season data, and then, the significance of the variability at the threshold value of 5%. According to the recorded values of U, Z and p from TDS, EC, DO, TSS, Fe, SO4 2−, Cl-, there was a significant variability within the dry and rainy season for these parameters. This significant variability may be explained by the significant difference of the inputs by runoff waters, human activities and seawater intrusion between the rainy season and the dry season. The variability within the hydrological regimes was performed using KW test as indicated in Table 3. The result of the test represented by H and p values at the significance threshold of 5% showed that the EC, TDS, SO4 2−, Cl-, Na+ varied significantly between hydrological regimes. This variation can be chargeable by two factors such as input of runoff waters and seawater intrusion [26, 27]. The flow rate and the charge in TDS from the runoff may be different during the three hydrological regimes with the peak of flow rate during the high flow regime. This high-rate flow can decrease TDS concentration with dilution effect induced by rainwater from the whole basin of Zio River [16]. During the low flow regime, the lowrate flow could increase the TDS concentration significantly with intrusion of seawater from Atlantic Ocean via Lake Togo (Figure 1) and evaporation phenomenon which is very high during this period [8]. This effect of seawater intrusion at some sites of downstream can be remarked by the strength and the direction of the relationship between TDS, EC, Ca2+, K+, Cl-, Na+ (Table 4) as reported in [26].
Table 3: Tests of variability of raw parameters.

Table 4: Relationship between parameters related to the salinity.

Seasonal ad hydrological variability using WQIs
The seasonal and hydrological variability of indices are indicated in Figures 2 and 3 respectively. The Figure 2 showed that the salinity index during the rainy season is lower than one while during the dry season, there are samples indicating their SI higher than one. The U-test showed that there is a significant difference between salinity index of the rainy season and the dry season (Z = 2.373; p = 0.017). Furthermore, the mean and median values of SI from the dry season (2.27±4.25 and 0.54) are higher than the mean and median values of the rainy season (0.37±0.20 and 0.34). This indicated that the processes inducing the salinity occurred during the dry season. For the OPI, the U-test showed like the value of SI, a significant difference between OPI values from the dry season and those from the rainy season (Z= 2.341; p = 0.019). The mean and median values of dry season (0.28±0.50 and 0.09) are higher than the mean and median values from the rainy season (-0.06±0.15 and -0.05). The global pollution index showed the same trends such as SI and OPI. The U-test indicated that there was a significant difference between the GPI of rainy season and the GPI of dry season (Z=2.246; p = 0.024). The mean and median values of GPI for the dry season (1.27±2.61 and 0.30) are higher than the mean and median values from the rainy season (0.15±0.14 and 0.14). These results showed that the surface water of Zio River at downstream was affected by salinity and organic pollution indicating a negligible pollution globally during the rainy season and moderate to significant pollution during the dry season. From the dry season to the rainy season in a year, three hydrological regimes were identified in the whole basin of Zio River, especially at the downstream of the basin [19].
Figure 3 shows the trends of variation of the pollution indices across the three regimes. The KW-test indicated the difference of SI between the three hydrological regimes (H=7.888; p = 0.02) with some extreme values during the low flow regime. The mean and median values of SI for samples from the transition regime (0.36±0.17 and 0.38), from the low flow regime (4.13±6.50 and 0.85), and high hydrological regime (0.41±0.21 and 0.48) confirmed this variability of SI between hydrological regimes. Furthermore, the results indicated that the SI from the low hydrological regime was higher than one. The KW-test for OPI showed a significant difference between the three hydrological regimes (H = 6.887; p = 0.032) with values within the typical range. The mean and median values of OPI from the transition regime (0.21±0.2 and 0.04), from the high flow regime (-0.10±0.17 and -0.16), and low flow regime (0.49±0.62 and 0.40) showed that the highest OPI was recorded during the low flow regime. The GPI showed the same variation trends, such as SI and OPI, with extreme and atypical range values during the low flow regime. The KW-test indicated that there was a significant difference of GPI between the three hydrological regimes (H=6.1186; p = 0.047). Moreover, the median and mean values of GPI recorded during the high flow regime (0.18 and 0.16±0.16), from the transition regime (0.17 and 0.19±0.16) and low flow regime (0.66 and 2.31±3.48) indicated that water from the low flow regime was globally the most polluted. The three WQIs showed that the water from Zio River downstream was affected by salinity and organic pollution, which were more significant during the low flow regime. The application of the WQIs revealed that the salts which induce high salinity were mostly Na+ and Cl- as could be seen by the strength and the direction of the relationship between SI and these salts (Table 4).


Spatial and temporal variability of water quality indices
The results from the application of the SI showed that values higher than one were recorded in three sites such as 17.06, 13.76 and 3.02 in sites F1, F2 and F3 respectively (Figures 4A and 4B). Figure 4C shows that the OPI values higher than one were obtained only during the low flow regime and were recorded in the sites F1, F2, and F6 with values of 1.31, 1.16, and 1.30, respectively. The highest values were obtained in the same sites during the dry season. Still, they were , on average, lower than one (Fig.4D). The global pollution index confirmed the spatial variation of the two indices and the global water quality. The GPI indicated that the values higher than one were obtained from the three sites F1, F2, and F6, which recorded 9.18, 7.45, and 1.71 respectively, during the low flow regime (Fig.4E). The application of this index on seasonal data showed that values higher than one were obtained only in two sites F1 and F2 which recorded the values of 4.67 and 3.88 respectively during the dry season (Fig.4F).

These results indicated that the water quality at Zio River downstream was globally good but was affected by the high salinity and organic pollution mostly during the dry season or during the low flow regime. The high salinity and organic pollution occurred only in the sites closest to the mouth of the river, especially in sites F1 and F2.
Hydrochemical variability
The figures 5A and 5B are the Piper diagram showing the hydrochemical facies of surface water downstream of Zio River. The analysis of these facies mapping show that there were three water types namely Ca-Mg-HCO3 type (55%), Na-K- HCO3 type (38%), and Na-K-Cl type (7%). The samples from the dry season and low flow regime fell in the field of the three types, while samples from the rainy season, high flow, and transition regimes fell only in the field of two types such as Ca-Mg- HCO3 and Na-K- HCO3. Samples from low flow regimes or dry seasons were characterized by two samples felling in the field of Na-K-Cl type or hyper Na-Cl type. From the Piper diagram, the geochemistry of dissolved constituents indicated that ions such as Ca2+, Mg2+, Na+, and K+ were dominant cations while ions such as HCO3 -, SO4 2−, and Cl− were dominant anions. Therefore, based on their mean values, the sequence of majorions’ abundance was in the following order of Na+ > Ca2+ > Mg2+ > K+ for cations and of HCO3 -> Cl− > SO4 2−> NO3 - for anions. The same sequence was observed during the high flow regime, the transition and during the rainy season. However, the sequence changed to the following order of Na+ > K+ > Ca2+ > Mg2+ for cations and of Cl− > HCO3 -> SO4 2− > NO3 - for anions for the samples from the low flow regime and dry season. This dominance of Na+ and Cl− is a signature of seawater intrusion, as indicated in [4, 28] Prusty and Farooq (2020).

Conclusion
The application of statistical tests and whisker boxplots on raw parameters and indices from the data collected during one hydrological year gave the variability trends of water quality, while the projection of the same data on the field of Piper diagram gave the hydrochemistry variability trends of the water. The study findings revealed that the water quality of Zio River downstream was threatened by salinity and organic pollution at some sites. It indicated a significant difference in water quality and hydrochemistry facies between seasons and hydrological regimes. The degree of variability is significant mainly between hydrological regimes, especially for salinity, and can significantly affect activities such as irrigated agriculture. The hydrochemistry facies of type Na-K-Cl recorded in sites close to Lake Togo during the low flow regime and the dry season with the dominance of Na+ and Cl− indicate the intrusion of Atlantic Ocean seawater via Lake Togo. Therefore, the findings of this study can allow for the planning of water uses, especially for irrigated agriculture use, as a guide for the schedule of irrigation downstream of the Zio River. However, further studies need to be undertaken to get more insight into the hydrological processes inducing this intrusion and the specific area influenced by seawater intrusion, including groundwater from downstream.
Acknowledgement
None.
Conflict of Interest
No conflict of interest.
References
- Abbasi T, Abbasi SA (2012) Why Water-Quality Indices, in: Water Quality Indices. Elsevier pp. 3-7.
- Olatunji EO, Elakhame LA, Osimen EC, Tampo L, Edegbene AO (2024) Responses of macrobenthos invertebrates’ diversity to environmental factors in a tropical freshwater river in Edo State, Nigeria. Biologia 12: 1-12.
- Zhang B, Song X, Zhang Y, Han D, Tang C, et al. (2012) Hydrochemical characteristics and water quality assessment of surface water and groundwater in Songnen plain, Northeast China. Water Research 46(8): 2737-2748.
- Tampo L, Alfa-Sika Mande SL, Adekanmbi AO, Boguido G, Akpataku KV, et al. (2022) Treated wastewater suitability for reuse in comparison to groundwater and surface water in a peri-urban area: Implications for water quality management. Science of The Total Environment 815: 152780.
- Olatunji EO, Anani OA, Osimen EC, Omojoyegbe RT (2022) Public health concerns and water quality integrity of selected water sources in a Peri-Urban Community of South-South Nigeria: A comparative investigation. Sustainable Water Resources Management 8: 1-10.
- Damseth S, Thakur K, Kumar R, Kumar S, Mahajan D, et al. (2024) Assessing the impacts of river bed mining on aquatic ecosystems: A critical review of effects on water quality and biodiversity. HydroResearch 7: 122-130.
- Mereta ST, Boets P, De Meester L, Goethals PLM (2013) Development of a multimetric index based on benthic macroinvertebrates for the assessment of natural wetlands in Southwest Ethiopia. Ecological Indicators 29: 510-521.
- Tampo L, Kaboré I, Alhassan EH, Ouéda A, Bawa LM, et al. (2021) Benthic Macroinvertebrates as Ecological Indicators: Their Sensitivity to the Water Quality and Human Disturbances in a Tropical River. Front Water 3: 662765.
- Tampo L, Lazar IM, Kaboré I, Oueda A, Akpataku KV, et al. (2020) A multimetric index for assessment of aquatic ecosystem health based on macroinvertebrates for the Zio river basin in Togo. Limnologica 83: 125783.
- Bănăduc D, Curtean-Bănăduc A, Barinova S, Lozano V, Afanasyev S, et al. (2024) Multi-Interacting Natural and Anthropogenic Stressors on Freshwater Ecosystems: Their Current Status and Future Prospects for 21st Century. Water 16(11): 1483.
- Grizzetti B, Pistocchi A, Liquete C, Udias A, Bouraoui F, et al. (2017) Human pressures and ecological status of European rivers. Sci Rep 7: 205.
- Kaboré I, Moog O, Ouéda A, Sendzimir J, Ouédraogo R, et al. (2018) Developing reference criteria for the ecological status of West African rivers. Environ Monit Assess 190: 2.
- Olatunji EO, Elakhame LA, Osimen EC, Edegbene AO (2023) Assessing the effect of environmental stressors on the community structure of macroinvertebrate and water quality of River Ugbalo, Nigeria. Pollution 9(4): 1-16.
- Aura CM, Kimani E, Musa S, Kundu R, Njiru JM (2017) Spatio-temporal macroinvertebrate multi-index of biotic integrity (MMiBI) for a coastal river basin: a case study of River Tana, Kenya. Ecohydrology & Hydrobiology 17(2): 113-124.
- Lemm JU, Feld CK, Birk S (2019) Diagnosing the causes of river deterioration using stressor-specific metrics. Science of The Total Environment 651(1): 1105-1113.
- Alizadeh MJ, Kavianpour MR, Danesh M, Adolf J, Shamshirband S, et al. (2018) Effect of river flow on the quality of estuarine and coastal waters using machine learning models. Engineering Applications of Computational Fluid Mechanics 12(1): 810-823.
- Zoppini A, Ademollo N, Bensi M, Berto D, Bongiorni L, et al. (2019) Impact of a river flood on marine water quality and planktonic microbial communities. Estuarine, Coastal and Shelf Science 224: 62-72.
- Bawa LM, Akakpo W, Tampo L, Kodom T, Tchakala I, et al. (2018). Assessment of seasonal and spatial variation of water quality in a coastal Basin: case of Lake Togo Basin. Journal of Scientific and Engineering Research 5(6): 117-132.
- Tampo L (2018) Hydrochemistry and Hydrobiology of the Zio basin (Togo). European University Editions.
- Rodier J, Legube B, Merlet N (2009) Water Analysis, 9th Edition Fully Updated 1579p.
- Boluda R, Quintanilla JF, Bonilla JA, Sáez E, Gamón M (2002) Application of the Microtox® test and pollution indices to the study of water toxicity in the Albufera Natural Park (Valencia, Spain). Chemosphere 46(2): 355-369.
- Kumar D, Kumar R, Sharma M, Awasthi A, Kumar M (2024) Global water quality indices: Development, implications, and limitations. Total Environment Advances 9: 200095.
- Poonam T, Tanushree B, Sukalyan C (2013) Water quality indices- important tools for water quality assessment: a review.
- Banda TD, Kumarasamy MV (2020) Development of Water Quality Indices (WQIs):A Review. Pol J Environ Stud 29(3): 2011-2021.
- Chidiac S, El Najjar P, Ouaini N, El Rayess Y, El Azzi D (2023) A comprehensive review of water quality indices (WQIs): history, models, attempts and perspectives. Rev Environ Sci Biotechnol 22: 349-395.
- Chithra S, Joseph S, Kannan N (2022) A study of saltwater intrusion in the Kallada River, southwest coast of Kerala, India. Water Supply 22 (2): 2194–2211.
- Ma J, Zhou Z, Guo Q, Zhu S, Dai Y, Shen Q (2019) Spatial Characterization of Seawater Intrusion in a Coastal Aquifer of Northeast Liaodong Bay, China. Sustainability 11(24): 7013.
- Akpataku KV, Gnazou MDT, Nomesi TYA, Nambo P, Doni K, et al. (2020) Physicochemical and Microbiological Quality of Shallow Groundwater in Lomé, Togo. Journal of Geoscience and Environment Protection 8(12): 162-179.
-

This work is licensed under a Creative Commons Attribution-NonCommercial 4.0 International License.


