 Research Article
Remote Sensing Analysis of Water Quality in Reservoirs at Water Fund Locations
Fernando Miralles-Wilhelm1,2*, Ivan Lalovic3, Sara de Moitié3, Philipp Grötsch3, Adam Belmonte3, Nathan Karres1, Kari Vigerstøl1, Shi-Teng Kang1, Jihoon Lee4, Raúl Muñoz Castillo4
1The Nature Conservancy, Arlington VA, USA
2George Mason University, Fairfax VA, USA
3Gybe, Portland OR, USA
4Inter-American Development Bank, Washington DC, USA
Fernando Miralles-Wilhelm, The Nature Conservancy and George Mason University, USA.
Received Date: August 12, 2022; Published Date: September 15, 2022
Abstract
This investigation introduces remote sensing (RS) methods for monitoring of water quality in support of measuring, understanding, and managing impacts in sensitive water bodies that are part of the Water Funds portfolio. The water bodies focus of this work are as follows: the Jaguari-Jacarei Reservoir in the Cantareira reservoir system (Sao Paulo Water Fund); the Ribeirao das Lajes Reservoir in the Guandu River systems (Río de Janeiro Water Fund); the Rio Grande Reservoir in the Medellin reservoir system (Cuenca Verde Water Fund); and the Thika Reservoir in the Nairobi reservoir system (Upper Tana-Nairobi Water Fund). This study focuses on the development and application of a RS data processing pipeline that detects phytoplankton abundance as a proxy for pollution by nutrients, as well as sediments, which are the major water quality issues identified across the Water Funds portfolio. This pipeline is tailored to specific reservoir systems of interest to Water Funds stakeholders and thus provides a comprehensive dataset for a suite of water quality parameters. Additionally, this pilot leverages remote sensing data archives to provide a baseline assessment of how these metrics behave over time and in space. Remote Sensing applied to monitoring of water quality in lakes, rivers and reservoirs is a valuable emerging technology that can provide geospatial information about water clarity, nutrient, bacterial and industrial pollution from urban and rural sources. The methodology presented in this paper using cloud computing allows rapid monitoring deployment and scalable coverage across numerous watersheds and geographies. Although this paper presents a comprehensive analysis of this entirely new source of water quality data across the sites and locations of interest, a more detailed analysis can be performed by looking at different timeframes (e.g., entire data set or monthly aggregates) within these watersheds. Additional insights may be unraveled by further combining the water quality data sets of this work with other sources of information including local sensors, information from water and sanitation utilities and a more detailed analysis of the timing of location conditions and their local impacts.
Introduction
This investigation introduces remote sensing (RS) methods for monitoring of water quality in support of measuring, understanding, and managing impacts in sensitive water bodies that are part of the Water Funds portfolio [1]. More specifically, this study pilots the use of a satellite-imagery-based data processing pipeline that operationalizes the creation of location-specific water quality data products. Such products provide conservation scientists, organizational decision-makers, and other stakeholders in the Water Funds community with a comprehensive measurement basis to complement future monitoring efforts and inform investment planning to improve water quality in the Water Fund. This study provides detailed, site-specific RS products for water quality that are relevant for management and planning, as well as examples of how these products can support management planning and restoration implementation. Moreover, this study provides a methodological baseline for the use of RS across the Water Funds portfolio. Importantly, this approach allows for asynchronous and systematic monitoring that can aid Water Funds with impact monitoring of conservation and restoration actions and increasing efficiency in tactical and strategic decision making.
The methods used allow for easy-to-scale and systematic monitoring, analytics, and reporting for water quality stakeholders, increasing efficiency in tactical and strategic decision making. The specific focus of this study is to develop an automated RS data processing chain enabling detection of phytoplankton abundance (chlorophyll-a) as a proxy for pollution by organic and inorganic nutrients, as well as sediments (and turbidity or water ‘clarity’). These water quality parameters are typically driven by land-erosion and runoff processes and also often contain other pollutants from urban environments such as untreated or partially treated sewage or effluent. Excess nutrient loading, and urban runoff and wastewater pollution due to inadequate sanitation are representative of major water quality issues worldwide.
The water bodies focus of this work are as follows: the Jaguari- Jacarei Reservoir in the Cantareira reservoir system (Sao Paulo Water Fund); the Ribeirao das Lajes Reservoir in the Guandu River systems (Río de Janeiro Water Fund); the Rio Grande Reservoir in the Medellin reservoir system (Cuenca Verde Water Fund); and the Thika Reservoir in the Nairobi reservoir system (Upper Tana- Nairobi Water Fund). This study focuses on the development and application of a RS data processing pipeline that detects phytoplankton abundance as a proxy for pollution by nutrients, as well as sediments, which are the major water quality issues identified across the Water Funds portfolio. This pipeline is tailored to specific reservoir systems of interest to Water Funds stakeholders and thus provides a comprehensive dataset for a suite of water quality parameters. Additionally, this pilot leverages remote sensing data archives to provide a baseline assessment of how these metrics behave over time and in space. It is the hope that data pipeline, water quality products, and analyses will assist in more targeted monitoring, risk mitigation and eventual prevention of sediment and nutrient pollution and subsequent eutrophication.
Methodology
Remote sensing datasets
At the core of this pilot study is a dense satellite time series dataset continuously collected over each of the four sites since early 2016. The two Sentinel 2 satellites orbit asynchronously to provide a new image of a location on the earth’s surface every 5 days at the equator (2-3 days at the mid-latitudes). Each image has 13 unique spectral bands available in a resolution of 10-60m, depending on the band.
These multi-spectral images provide a snapshot of the earth’s surface beyond the visible red, green, and blue spectral bands available from a typical consumer-grade digital camera image. For example, the amount of water present in vegetation canopies can be calculated using spectra invisible to the human eye, the near infrared, and shortwave infrared bands on Sentinel 2A (8A, 11, and 12).
Satellite imagery datasets are acquired from the European Space Agency’s Sentinel 2 A & B platforms, which can produce a high-resolution (10-20 m) multispectral (490-865 nm) image at the same location on Earth every 5 days. These imagery data are distributed free for public use and are used as the starting point for the satellite data processing methodology. This methodology ingests the raw top-of-atmosphere imagery, corrects for atmospheric effects, calculates a suite of WQ metrics, and creates a data repository for use across different display and analysis platforms. For this study, three different WQ metrics are calculated and used for the assessment of each water body.
Chlorophyll-a measures the concentration of phytoplankton growing in the water and is expressed in milligrams per cubic meter (mg/m³). Water quality problems associated with changes in this water quality parameter are typically caused by nutrient pollution.
Turbidity measures the optical clarity of the water and is supplied in Formazin Nephelometric Units (FNU).
Suspended Matter measures the concentration of fine particles, both inorganic and organic, that are suspended in the water and is supplied in units of grams per cubic meter (g/m³). Water quality problems associated with changes in this water quality parameter are typically caused by sediment pollution.
All resulting WQ product datasets are georeferenced, cloudscreened, and adjusted to account for localized water extent changes over time.
Adaptation of NASA’s Ocean color radiometry
Figure 1 illustrates the basis of the methodology used for processing of remote sensing observations into water quality estimates. NASA and other space agencies have established protocols for how this is done and following NASA nomenclature these top-of-atmosphere corrected images are referred to as processing level “L0”.
To make these images useful for calculating water quality parameters, the images must undergo a process that removes the effects of the atmosphere present between the satellite sensor and the earth or water surface. This process, termed atmospheric correction, implements a series of algorithms to reduce or eliminate the effects of atmospheric absorption and backscatter on the image, yielding a more accurate representation of the earth’s surface. The resulting images contain values for the remote sensing reflectance (abbreviated as Rrs) of the water body, which are referred to as “L1” in the commonly adopted NASA nomenclature. These processed images can then be used to derive a variety of data products.
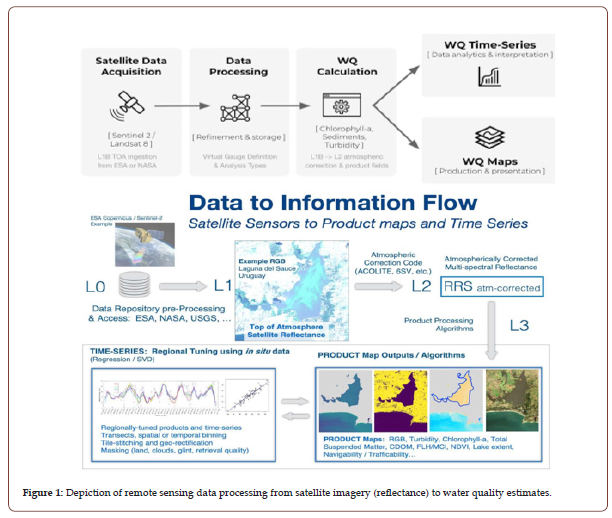
Reflectance data processing approaches commonly rely on atmospheric correction processes based on open-source methods developed for inland and coastal water applications, such as the Royal Belgian Institute of Natural Sciences’ (RBINS) Acolite processor, the National Aeronautics and Space Administration’s (NASA) SeaDAS processor. The full image collections, also referred to as archives, containing the atmospherically corrected imagery and Rrs values, are used to calculate the three water quality (WQ) products in this pilot study; Chlorophyll-a, suspended matter, and turbidity concentrations.
We derived the following WQ products are obtained by applying relatively standard algorithms developed in the open scientific literature specifically for detecting the makeup of inland coastal waters.
a. Chlorophyll-a concentrations, which are measured in milligrams per cubic meter (mg/m³), are calculated using normalized difference chlorophyll index (NDCI) developed by [2].
b. The NDCI algorithm can be used to detect algae concentrations and blooms using the red and red-edge spectral bands.
c. Suspended matter and turbidity concentrations are measured in grams per cubic meter (g/m³) and Formazin Nephelometric Units (FNU), respectively, and are both derived from the methodology developed by Nechad B, et al. [3] for detecting total suspended matter (TSM) concentrations on the water surface.
It is important to note that the data in this research is not calibrated or validated against ground measurements, due to inconsistent availability of water quality data across the four study sites. The analyses used in this pilot study relied on the pixel-wise time series data extracted from the entire water surface across each site. Having datasets that were dense in both the spatial (10 m pixels) and temporal (1 new image roughly every 5 days) dimensions facilitated analyses that could focus on establishing WQ baselines, quantifying changes in temporal trends, and illustrating patterns in spatial distributions. Trends over time and within seasons were established using simple time series plots constructed from the average or median WQ data product value across the entire water surface or else constrained to Virtual Gage locations. Moving average filters were applied to time series data to both smooth spikes and interpolate across small gaps.
Spatial and temporal data analyses
Virtual gages: A Virtual Gage is a specific geographic region of interest in which water quality parameters are temporally assessed in greater detail than viable across the entire water body. The goal of establishing Virtual Gage locations is to extract data that enables rapid, flexible, and relevant investigation into areas where known WQ issues exist. Virtual gages are well defined points or areas of interest on a data map.
To establish a Virtual Gage location, we first collected information from local experts and the scientific literature about where WQ issues originate or tend to occur. Examples of this information include official WQ sampling locations, citizen science reports, known point source polluters, areas where rivers are input into a reservoir, or locations of critical infrastructure (e.g. drinking water or hydropower intake locations). Then, a spatially referenced area is created that reflects both the research and a statistically relevant pixel sample size. In this way, virtual gages allow us to generate time series for any point or area that is of interest on the data maps, as if we had placed a gage there physically. Virtual Gage locations were placed in areas close to densely populated regions and at least 50 meters across in rivers.
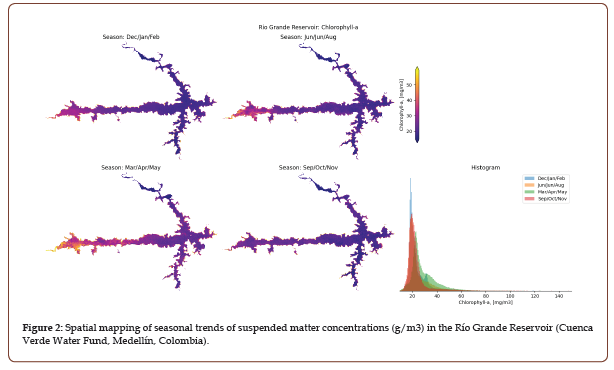
Seasonal trends: To better understand the seasonal effects on water quality parameter values, we created maps illustrating the average seasonal changes across the entire water body. This approach is illustrated in Figure 2. First, water quality values across the full archival time series were grouped into three-month intervals: December through February, March through May, June through August, and September through November. Then values were averaged through time to produce maps that highlight the seasonal differences. This allows for identifying periods during the year or location within the water body where trends are noticeable, providing a method to link hydrological and land processes, or prevailing meteorological conditions. Seasonal and meteorological drivers not only impact the urban and rural runoff but can influence the hydrodynamics (water mixing) including flooding, storm surge, sewage flows and light available for photosynthesis, and more generally photochemical processes within the watershed.
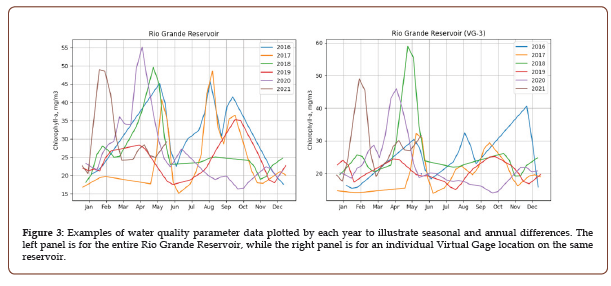
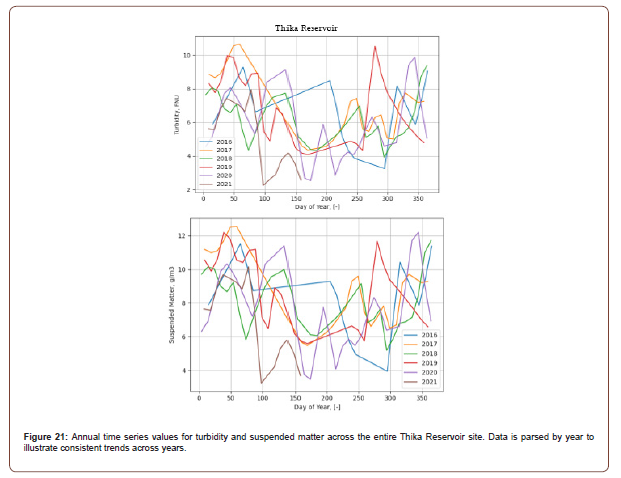
To further illustrate the differences within seasons and across years, we plot water quality time series data split by each year. Plots are produced for the entire water body as well as for each Virtual Gage location. Such plots can be produced for sub-regions of a waterbody or specific Virtual Gage locations, as shown in Figure 3.
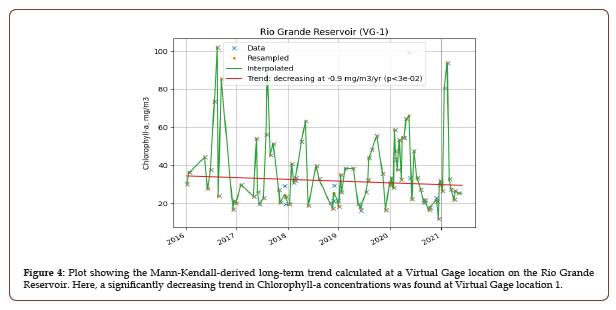
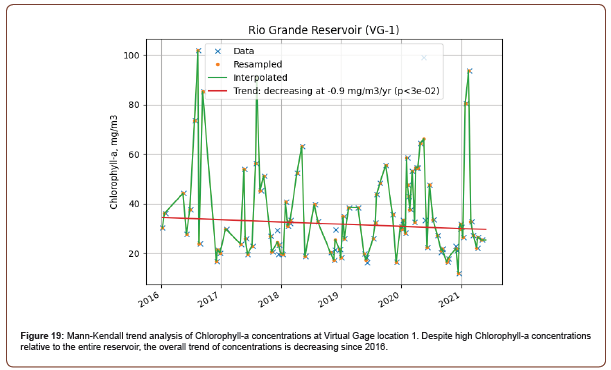
Long term trends (Mann-Kendall trend test): Quantifying the direction and magnitude of trends in the time series data is important to contextualizing any significant annual fluctuations [4]. To do so a seasonally adjusted Mann-Kendall trend test was used to assess the presence, direction, and magnitude of a trend in the larger time series. Mann-Kendall tests are used to look through an entire dataset and quantify whether there is a significant fundamental change in the trend, regardless of the nature of the data distribution (i.e., no assumptions for a normal distribution) or linearity of the trend (i.e., it could be a non-linear trend). Seasonally adjusted Mann-Kendall trend tests were applied to each WQ dataset averaged across each Virtual Gage location. The results quantified the long-term behavior at each Virtual Gage location and helped differentiate the dynamics at locations where water inputs and outlets occurred.
The procedure used and its results is illustrated in Figure 4. First, the median water quality parameter value is calculated across a Virtual Gage location for each image date. Then, a Mann-Kendall test is applied to the full archival time series which provides the direction, magnitude, and statistical significance of potential trends at that location. The outcome indicates whether the time series data at that location has a consistent increasing or decreasing trend. This statistical assessment is particularly useful to understand the underlying variability and longer-term trends at specific locations.
Spatial variation maps
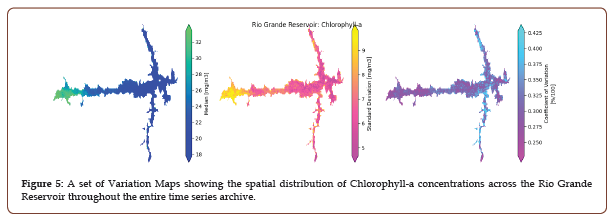
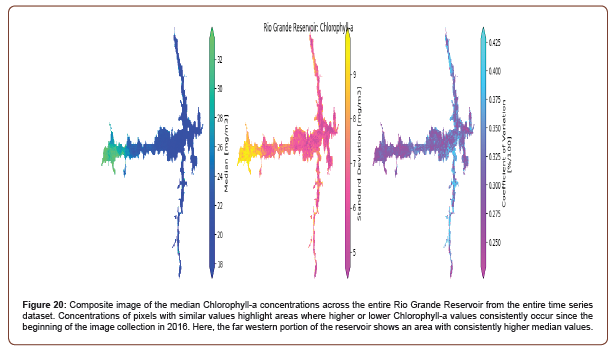
To quantify where water quality values are consistently high, low, and have high variability over time, we created spatial variation maps for each water body and water quality parameter (see Figure 5). This process calculates the median, standard deviation, and coefficient of variation on a pixel-wise basis through time. The product is a map that shows the spatial distribution of these summary statistics through time. These maps can be used to locate areas that stand out with consistently different water quality patterns or areas with high variability. Either of these areas could be locations that are valuable indicators of important processes or can be used as locations for more detailed monitoring.
Spatial trend maps
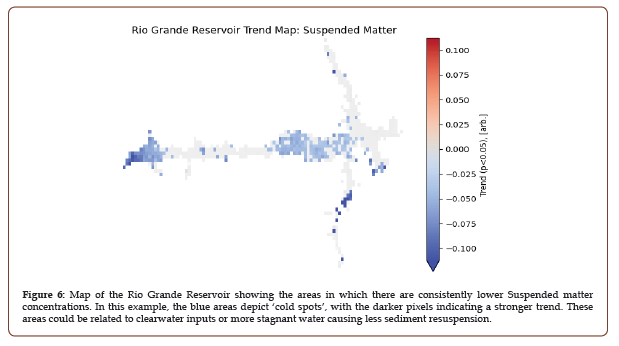
Next, extending the concept of spatial variation maps, we create spatial trend maps to visualize where temporal trends in water quality parameters are occurring (Figure 6). First, data across the entire water body is spatially binned by averaged to approximately 100m resolution. Then, a linear regression is applied along the temporal axis for each bin; a three-sigma outlier filtering process is used to remove outliers. Finally, the linear trends are visualized on a map where statistically significant (p-value below 5%) values are colorized based on direction and intensity. Similarly, to the Spatial Statistics maps, colorized areas can be used to understand areas or locations where long-term trends indicate a linear trend in underlying water quality over multiple years showing increasing environmental pressures on the ecosystems, or successful implementation of policies, land-use practice or water and sanitation projects.
Results and Discussion
Rio de Janeiro Water Fund (Riberao das Lajes Reservoir)
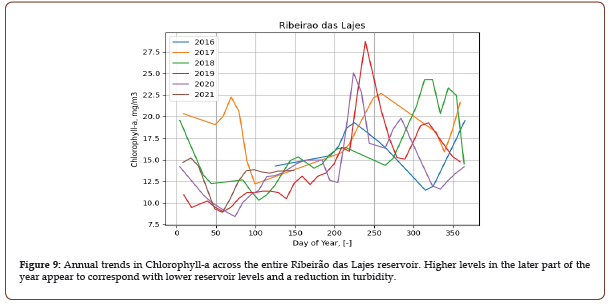
This is a part of a highly controlled reservoir system, with all developed inputs and outputs managed for hydropower generation and drinking water supply for the City of Rio de Janeiro [5]. The Ribeirão das Lajes reservoir itself is relatively shallow, has steep sides under water, and long water retention times Guarino AWS, et al. [6], which may contribute to the relatively high Chlorophyll-a levels observed across the entire reservoir and at the Virtual Gage locations 1-3 (Figure 7) [7]. The reservoir is at its highest levels at the end of the rainy season in April (~ day of year 100), during which both turbidity and suspended matter levels are at their highest (Figure 8). The reservoir is at its lowest levels in November (~ day of year 300), during which the Chlorophyll-a levels are among the highest (Figure 9). The seasonal algal blooms could be enhanced by generally lower sediment concentrations and turbidity and also by higher solar radiation during these months.
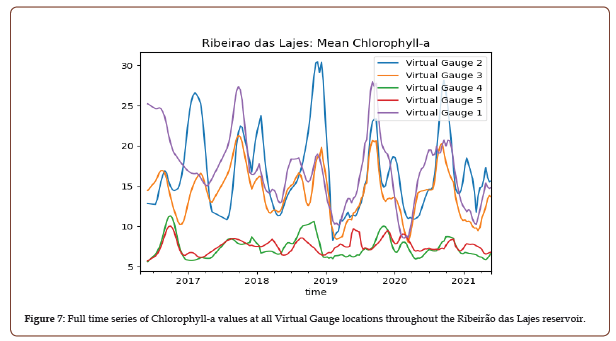
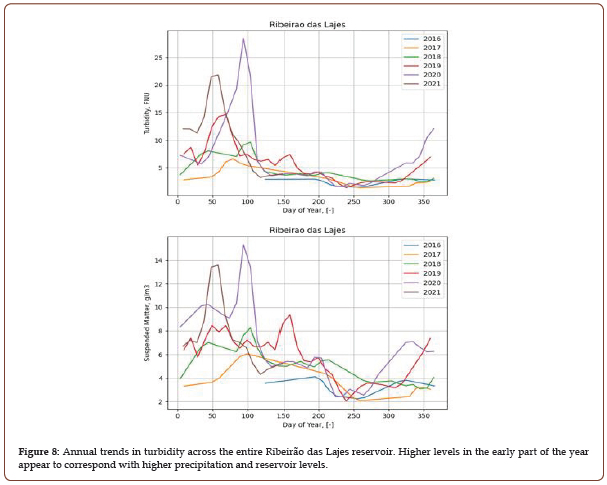
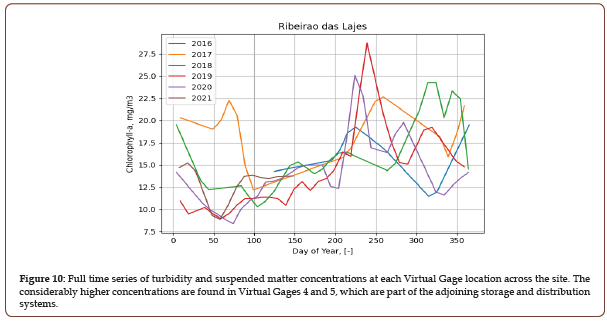
Across the entire site, higher turbidity and suspended matter levels are observed during the months of the Austral summer-fall (Dec-May) (Figure 8). This is particularly apparent in the adjoining downstream reservoirs, Reservatorio Vigario and Reservatorio Fonte Coberta, which correspond to Virtual Gauge locations 4 and 5 (Figure 10). The opposite signal is observed in Chlorophyll-a levels, with the highest levels occurring into the Austral winter-spring (Jan-Nov) and overall higher values observed in the main Ribeirão das Lajes reservoir (Figure 7). The considerably higher suspended matter and seasonally consistent concentrations at Virtual Gage locations 4 and 5 are likely associated with the control of pumping and hydropower at nearby facilities. Here, there is a notably higher increase in suspended matter for Virtual Gage location 5 compared to location 4, which is likely related to gradual changes in water flows at the two inputs.
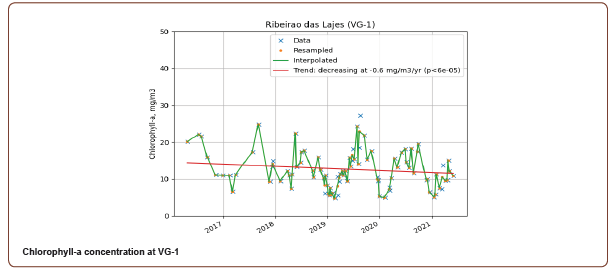
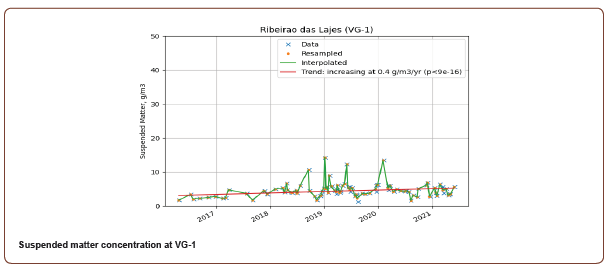
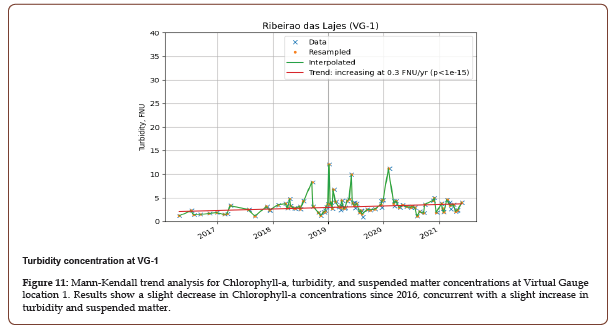
Focusing on regions of interest, we find that at Virtual Gage locations 1, 2 and 3 there are consistently high Chlorophyll-a levels which follow clear seasonal trends. This is particularly the case at the dam structure and intake locations (Virtual Gage 2). The direction and magnitude of Chlorophyll-a concentration trends over time are relatively neutral since 2016, except for a slightly decreasing trend at Tocos tunnel outlet (Virtual Gage location 1). However, both turbidity and suspended matter levels are gradually increasing over the same time period (Figure 11).
Sao Paulo Water Fund (Jaguari reservoir)
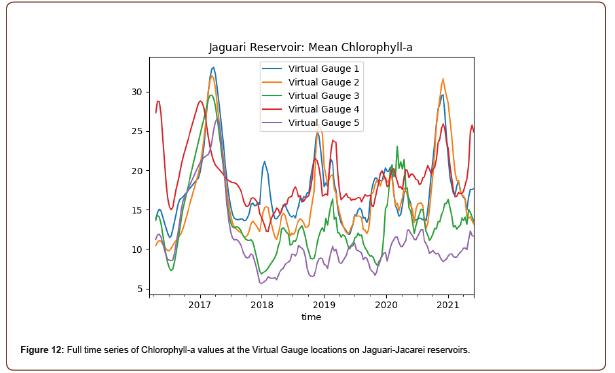
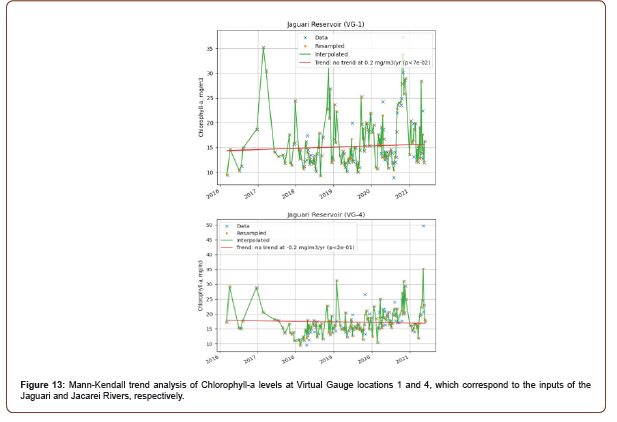
The Jaguari-Jacarei reservoirs are interconnected and the first main reservoirs in the Cantareira System supplying drinking water to the City of Sao Paulo. The reservoirs receive input from a number of surface water sources, the primary being the Jaguari and Jacarei Rivers. While there are large inputs of organic pollutants from these increasingly eutrophic rivers, the large capacity and low residence time in the reservoirs has kept the overall water quality stable [8]. This is evident from consistently high Chlorophyll-a concentrations at the locations where both rivers enter the reservoirs (Virtual Gages 1 and 4) (Figure 12). Interestingly, at these same locations there is no observable trend of Chlorophyll-a levels throughout the entire time series (Figure 13).
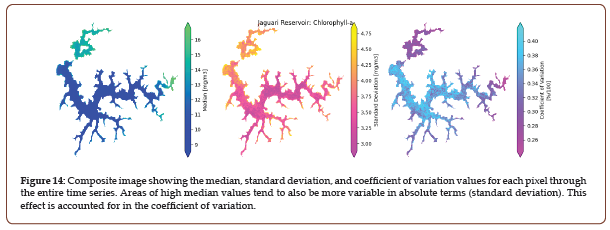
While most of the Mann-Kendall trend analyses showed little or no changes in the trend of all the water quality metrics throughout the entire time series, the northern portion of the site, where the Jaguari Reservoir is located, had consistently higher median values in all water quality parameters over time. For example, this translates to a discrete geographic area in which Chlorophyll-a values have been consistently higher compared to those across the entire site (Figure 14).
Cuenca Verde Water Fund (Río Grande reservoir)
The Rio Grande Reservoir lies at the confluence of the Grande and Chico Rivers outside of Medellin, Colombia. The reservoir is an integral part of the regional drinking water and hydroelectric power generation system and faces sedimentation challenges from both river inputs [9]. Additionally, increased industrial activities at and upstream of the reservoir are leading to greater nutrient concentrations and occurrences of algal blooms. Time series of turbidity and suspended matter show strong seasonal trends that correspond to the two distinct rainy seasons that occur between April-May and September-November (Figure 15).
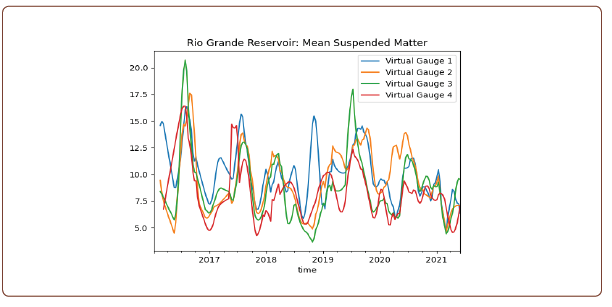
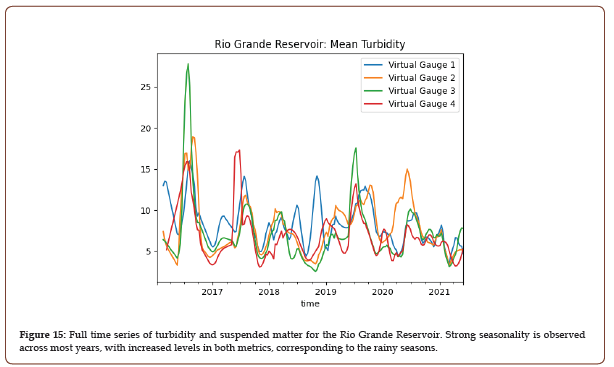
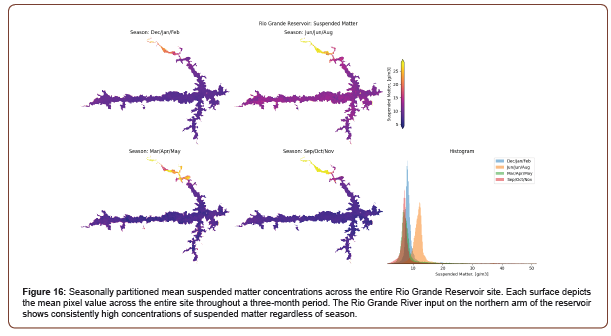
High turbidity and suspended matter concentrations tend to occur at the main river inputs, with the Rio Grande River providing consistent sediment inputs year-round (Figure 16). This trend is also evident across the entire time series dataset, with consistently high median turbidity values occurring at both the northern and western portions of the reservoir where both rivers input (Figure 17).
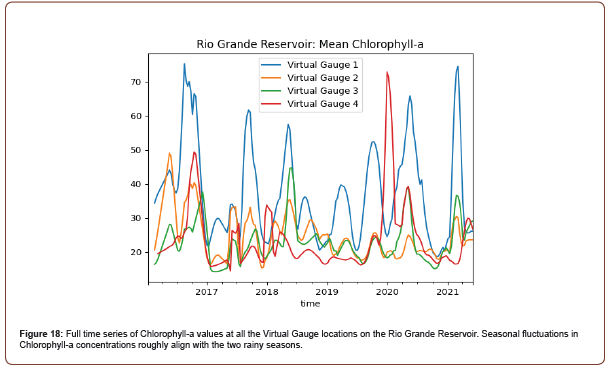
There are consistently high Chlorophyll-a concentrations at all virtual gage locations across the entire time series dataset (Figure 18), however the overall trend is decreasing since 2016 (Figure 19). Figure 20 shows the spatial distribution of Chlorophyll-a concentrations across the entire water and highlights the far western portion of the reservoir to have persistently higher concentrations over time, this area also corresponds to Virtual Gage location 1.

Upper Tana- Nairobi Water Fund (Thika reservoir)
The Thika Reservoir supplies 75% of the drinking water to the city of Nairobi and faces increases in sedimentation rates as land-use changes continue to reduce forest cover in the upper watershed ([10,11]. Time series of turbidity and suspended matter concentrations show seasonal patterns consistent with the wet (November to May) and dry (June to October) seasons. Higher values during the wet season presumably correspond with increased runoff during that time (Figure 21). These seasonal patterns are evident across the entire site without much variation due to the relatively small size of the reservoir (3 sq. km) (Figure 22).
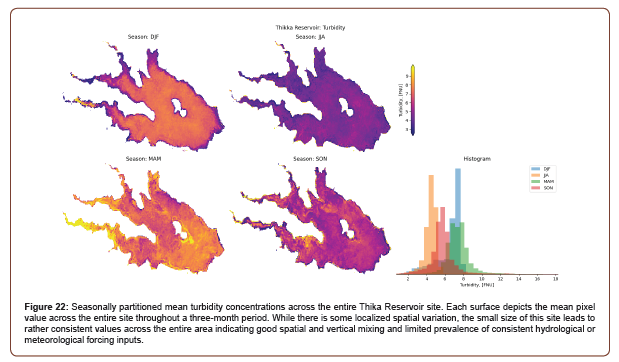
Each surface depicts the mean pixel value across the entire site throughout a three-month period. While there is some localized spatial variation, the small size of this site leads to rather consistent values across the entire area indicating good spatial and vertical mixing and limited prevalence of consistent hydrological or meteorological forcing inputs.
Summary
Remote Sensing applied to monitoring of water quality in lakes, rivers and reservoirs is a valuable emerging technology that can provide geospatial information about water clarity, nutrient, bacterial and industrial pollution from urban and rural sources. The methodology presented in this paper using cloud computing allows rapid monitoring deployment and scalable coverage across numerous watersheds and geographies.
This significantly lowers the costs of obtaining water quality information compared to laborious water sampling and collection methods. Furthermore, satellite data acquisition and processing are automated and available continuously across the globe, and new data are automatically analyzed and contextualized within seasonal or historical trends. This allows investments in water and sanitation infrastructure to be valued based on realized regional and community benefits and allows operators of water systems to reduce risks and lower operational and management costs.
Although this paper presents a comprehensive analysis of this entirely new source of water quality data across the sites and locations of interest, a more detailed analysis can be performed by looking at different timeframes (e.g., entire data set or monthly aggregates) within these watersheds. Additional insights may be unraveled by further combining the water quality data sets of this work with other sources of information including local sensors, information from water and sanitation utilities and a more detailed analysis of the timing of location conditions and their local impacts.
There is significant growth in available low-earth orbit satellite imagery or aerial imagery platforms used for observation from private companies such as Planet Labs and public agencies such as NASA, ESA, and others. Significant improvements are expected in how often new images are generated. Daily revisits for larger > 5~10 km water areas are already possible. Satellite imagery from commercial platforms is available at 1-meter spatial resolution, enabling access to narrower rivers (>10~20-meter width) and smaller ponds and lakes. These can be easily integrated for specific applications where daily data or high-resolution products are needed. Additionally, autonomous optical sensors provide coverage for smaller streams, and important surfacewater locations continuously, enabling improved accuracy of data obtained from satellite imagery and continuous information when satellite imagery is not available. Continuous monitoring of smaller river, stream, canal and could particularly be helpful to pinpoint sanitation and waste-water treatment hotspots, which in turn could inform more localized spatial extents where water quality impacts could be more concentrated.
These results and remote sensing technology in general, can be a useful addition to the toolkit used by infrastructure, and water and sanitation teams in general or more specifically to understand the impacts due to water quality interventions. The new datasets generated through this pilot can help provide insight in three key areas:
a. Inputs on where to measure and optimal in situ sampling rates: Remote sensing results pinpoint locations of high activity and variability throughout the year, helping to optimize the effectiveness of on the ground sampling by ensuring sampling is happening in the most interesting places.
b. Where to plan and develop future remediation or investment efforts: These data can also be used to identify locations where problems are most frequently occurring, as well as understanding the mitigation or remediation measures that should be applied. In addition to location, the scale of the needed intervention can be determined based on modeled or predicted impacts, and then verified during project implementation.
c. Inputs to help understand the ecological impact of construction, civil engineering, or other infrastructure projects: This remote sensing dataset on water quality gives us insight on what seasonal fluctuations are to be expected, and how levels of different water quality parameters are shifting over the long term. By combining this dataset with the timing and location of engineering projects, or interventions, meteorological and specifically rainfall data, as well as land use change information more generally, we can reach a more complete understanding of the downstream water quality and other environmental impacts from various projects.
This analysis of the water quality data sets can be extended by integrating local in-situ water quality data, or additional data on meteorological and hydrodynamics, as well as quantified geospatial datasets describing specific changes resulting from socioeconomic conditions (e.g., land use changes) across the locations, or other data sets as they become available. Local water-quality in situ data would allow validating and calibrating the satellite-based retrievals to get more quantitative results and the meteorological and hydrological data sets could provide additional context on the relationships between water quantity and quality. Additionally, geospatial information about wastewater infrastructure quality, waste outflow locations and changes in population movement during the lock-down could be used to identify locations for study further upstream within the urban system before significant mixing or dilution occurs. These additional datasets and analysis would allow these findings to be applied towards more quantitative and finer resolution scales in time and space.
Acknowledgement
None.
Conflict of Interest
No conflict of interest.
References
- Abell R (2017) Beyond the Source: The Environmental, Economic and Community Benefits of Source Water Protection. The Nature Conservancy.
- Mishra S, Mishra DR (2012) Normalized difference chlorophyll index: A novel model for remote estimation of chlorophyll-a concentration in turbid productive waters. Remote Sensing of Environment 117: 394-406.
- Nechad B, Ruddick KG, Park Y (2010) Calibration and validation of a generic multisensor algorithm for mapping of total suspended matter in turbid waters. Remote Sensing of Environment 114(4): 854-866.
- Hirsch RM, Slack JR, Smith RA (1982) Techniques of trend analysis for monthly water quality data. Water resources research 18(1): 107-121.
- Formiga Johnsson RM, Britto AL (2020) Water security, metropolitan supply, and climate change: some considerations concerning the Rio de Janeiro case. Ambiente e Sociedade 23: 1-24.
- Guarino AWS, Branco CWC, Diniz GP, Rinaldo JSR (2005) Limnological Characteristics of an Old Tropical Reservoir ( Ribeirão das Lajes Reservoir , RJ , Brazil ) Water 17(2): 129-141.
- Andrade, Andres Paladines, Marley Vellasco, Karla Figueiredo, Francisco Gerson Araújo, Christina Wyss Castelo Branco (2020) New Water and Biotic Quality Assessment Indices for a tropical reservoir based on fuzzy logic. Revista Ambiente & Água 15(5): e2597.
- Neto AJG, da Silva LC, Saggio AA, Rocha O (2014) Zooplankton communities as eutrophication bioindicators in tropical reservoirs. Biota Neotropica 14(4).
- Moreno YM, Ramirez JJ (2010) Seston fluxes in the dam of a Colombian tropical reservoir. Acta Limnologica Brasiliensia 22(3): 325-334.
- TNC (2012) Upper Tana-Nairobi Water Fund Technical Report. 254(September).
- United Nations World Water Assessment Program. (2006) Case study : Kenya (Kenya National Water Development Report) 60-83.
-
Fernando Miralles-Wilhelm*, Ivan Lalovic, Sara de Moitié, Philipp Grötsch, Adam Belmonte, Nathan Karres, Kari Vigerstøl, Shi-Teng Kang, Jihoon Lee, Raúl Muñoz Castillo. Remote Sensing Analysis of Water Quality in Reservoirs at Water Fund Locations. Adv in Hydro & Meteorol. 1(3): 2022. AHM.MS.ID.000512.
-
Water Quality, Water Bodies, Remote Sensing Analysis, Turbidity, Water Fund Locations, Reservoirs, Eutrophication, Nutrient pollution
-

This work is licensed under a Creative Commons Attribution-NonCommercial 4.0 International License.


