 Research Article
Rainfall Seasonality and Standardized Precipitation Valuation of Water Resources Susceptibility to Climate Variability on the Bui Plateau, Northwest Region, Cameroon
Suiven John Paul Tume*
Department of Geography and Planning, The University of Bamenda, Cameroon
Suiven John Paul Tume, Department of Geography and Planning, The University of Bamenda, Cameroon.
Received Date: May 13, 2021; Published Date: June 28, 2021
Abstract
This paper aims to assess the effects of climate variability on water resources, using Rainfall Seasonality Index (SI) and Standardized Precipitation Index (SPI). Water resources are subjected to hydro-climatic and spatial-temporal variations. They are a key constraint to economic development. Rainfall data collected were based on ground observations for stations across Bui. Water output data was also collected for a limited period from CAMWATER Jakri and Kumbo Water Authority. SI and SPI are computed using mean monthly and mean annual rainfall. The average Rainfall Seasonality Index stands at 0.915. This value falls within the class limit of 0.80–0.99. Thus, rainfall in is markedly seasonal with a long drier season. Normally, one would expect the index to be seasonal (0.60-0.79). The markedly seasonal rainfall with a long drier season is as a result of meteorological droughts that lead to a delay in the onset of first rains. standardized Precipitation Index on the other hand is a tool which was developed primarily for defining and monitoring drought. Indices for Bui range from -0.1 to -0.45 (mild to moderate drought conditions). The outcome of these extreme conditions has led to severe water shortages, especially during the dry season. Thus, there is need to enhance existing water resources and protect watersheds to ensure sustainability.
Keywords:Climate variability; Coping strategy; Precipitation; Vulnerability; Water scarcity
Introduction
More than 22.8 million people in 48 countries, most of them in Sub-Saharan Africa, will face severe water stress by 2025 [1]. Mounting water stress is attributed to climate change and unsustainable competing users. Africa is highly vulnerable to environmental changes and climate changes, thus, water resources inextricably more vulnerable [2- 4]. Climate change affects water resources negatively through decreasing precipitation against a backdrop of rising temperatures [1,5]. With all these changes, water quantity and quality due to climate change are expected to affect water availability, stability, access, and utilization. This is expected to lead to decreased water security and increased vulnerability of poor rural communities of tropical Africa (Ababaei et al., 2014). The impacts of climate change negatively affect livelihood security globally and induce risks and vulnerabilities in sectors such as health, agriculture and food security, energy, transport, water supply and sanitation, industry, and other water-using sectors [6,7]. Global environmental changes observed during the first decade of the 21st Century can be attributed to anthropogenically enhanced climate change and related to changes in the frequency and/or intensity of extreme weather events; changes in ecosystems and biodiversity patterns [5,8,9].
Water resources are subjected to hydro-climatic variability over space and time and are a key constraint to economic development [4,6,10]. Climate variability has superimposed onto already water-stressed catchments with complex land uses, engineered water systems, and a strong historical socio-political and economic footprint. Strategies that integrate land and water management and disaster risk reduction, within a framework of emerging climate change risks would bolster resilient development in the face of projected impacts of climate change [7,11]. Freshwater-related risks of climate change increase significantly with increasing greenhouse gas (GHG) concentrations [5,12]. For each degree of global warming, approximately 7% of the global population is projected to be exposed to a decrease of renewable water resources of at least 20% [13]. This will intensify competition for water among agriculture, ecosystems, settlements, industry, energy production, affecting regional water and energy security [14,15].
Climate variability is likely to increase the frequency of meteorological and agricultural droughts in the tropics by the end of the 21st Century [1,12,16]. This is expected to worsen the incidence of short hydrological droughts in these regions. Changes in the frequency of droughts longer than 12 months are more certain, because these depend on accumulated precipitation over long periods. Climate change negatively impacts freshwater ecosystems by changing stream flow and water quality [12]. Except in areas with intensive irrigation, the stream flow-mediated ecological impacts of climate change are expected to be stronger than historical impacts owing to anthropogenic alteration of flow regimes by water withdrawals and the construction of reservoirs [11]. Climate change is also projected to reduce raw water quality, posing risks to drinking water quality even with conventional treatment [5]. The sources of the risks are increased temperature, increases in sediment, nutrient, and pollutant loadings due to heavy rainfall, reduced dilution of pollutants during droughts and disruption of treatment facilities during floods [14].
Changes due to climate are expected to further aggravate water- related hazards, water scarcity and increasing the vulnerability of socio-ecological systems. Some flood-related impacts include destruction of water infrastructure, crop losses, sediment pollution, loss of soil fertility, landslides, and erosion [8,9]. Key climate change impacts of concern relating to the freshwater resources include floods and water stress (droughts) [4]. Severe water supply problems are also accelerated by a rapid increase in population, growing demands from agriculture and industry, expanding urbanization, unabated pollution of water bodies and the effects of climatic variability and extreme events [1,6,8,9]. Climate variability and change have been identified to be responsible for the increase in the frequency and intensity of surface runoff, soil water erosion, drought, pollution and for the decrease in surface water/runoff and groundwater, with negative impacts on agricultural lands, grasslands, and terrestrial and aquatic ecosystems [6,11].
Rainfall seasonality is the tendency for a place to have more rainfall in certain months than in others [17-19]. This makes use of the Seasonality Index (SI). It is related to the temporal distribution of rainfall monthly [20]. The method aims to characterize the distribution of precipitation throughout the year and to classify the climate of an area [ 17,19]. The climate of an area can be characterized as seasonal with a short dry season or marked seasonal with a long dry season, depending on the distribution of rainfall during the year [17,21]. Data required for the calculation of SI are mean monthly rainfall and mean annual rainfall. Rainfall seasonality index is a critical environmental factor affecting the evolution agro-hydrological systems [19,20,22,23]. SI classifies the type of climate in relation to water availability. The higher the seasonality index of an area, the greater the water resources variability and scarcity. Thus, higher SI values depict high water vulnerability [17,20,21]
Over the years, drought indices have been developed. These ranged from simple indices such as percentage of normal precipitation to more complicated indices like the Palmer Drought Severity Index (PDSI) [24]. Climatologists in the USA concluded that an index needed to be simple, easy to calculate, statistically relevant and meaningful. The understanding that a meteorological drought has different impacts on groundwater, reservoir storage, soil moisture and streamflow led McKee, Doesken and Kleist to develop the Standardized Precipitation Index (SPI) in 1993. SPI [25] is a powerful and flexible index to calculate. Precipitation is the only required input parameter. It is effective in analyzing wet and dry cycles.
It is a common phenomenon for human communities to be psychologically disturbed during dry spells when community water resources shrink or when rainstorms destroy water networks of pipes and feed water sources with sediments. This vividly illustrates the importance of water to life. The occurrence of freshwater resources for human use is dictated by many variables, which range from those ordained by nature through anthropogenic influences. The natural variable here is climate, of which its element-rainfall is the main source of water resources recharge. In this era of global environmental changes, it is only germane for humankind to have a clear picture of rainfall trend as it varies monthly, seasonally, and annually in order to ascertain effects on his day–to–day supplies of water as well as the agricultural cycle, which is basically seasonal and dependent on rainfall. Water availability or scarcity brings about development or stress, respectively. To understand the present state of water resources on the Bui Plateau, one should have a comprehensive view of rainfall seasonality and standardized precipitation trends in order to address the current situation of water shortages. Rainfall is not evenly distributed over space and time throughout the earth’s surface. There have always been deviations from the normal situation, hence, variability, which in turn affects the availability of water resources. Climate variations, coupled with other problems of the natural environment and those which are man–made have led to a scenario of looming water crisis in the horizon. Potable water is shrinking. Field evidence reveals that during the dry season and even at the heart of the rainy season, water rationing prevails for days and sometimes several weeks. This is a clear indication of depleting underground water resources, triggered by hydro–ecological despoliation of catchment areas, probably due to the colonization of headwaters by eucalyptus plantations, coupled with over-grazing, unsustainable agriculture, and deforestation. These problems need a critical re-appraisal in order to identify more sustainable measures of managing the precious resource.
Method of Study
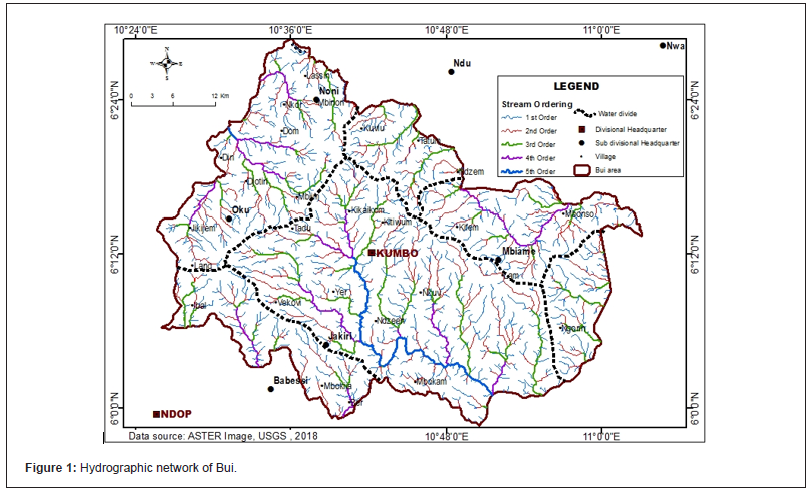
The Bui Plateau of Northwest Cameroon can be divided into six drainage basins (Figure 1). It is situated between latitudes 6o-6o24” N and longitudes 10o24″-11o00″E. It is a huge orographic plateau within the Cameroon Volcanic Line (CVL) with spectacular mountainous landscape like Mount Oku (3,011m asl) and the Mbaw–Tikar Plains (≈710m asl). It provides a major watershed for the Niger and Sanaga river systems. Bui has a surface area of about 2,795km2. Administratively, this area covers Bui Division, with headquarters in Kumbo. It has six sub-divisions- Kumbo (630km2), Jakiri (675km2), Nkum (375.3km2), Nkor–Noni (307.7km2), Mbiame (575km2) and Oku (232km2) (Figure 1).
In order to evaluate the effect of climate variability on water resources in Bui, using Rainfall Seasonality Index and Standardized Precipitation Index (SPI), consistent rainfall data was collected for seven stations as follows: Tatum (59 years), Jakiri (45 years), Shisong (40 years), Mbaw Nso (38 years), Takui (20 years), Tobin (11 years) and Oku (11 years). These stations are spread over the drainage basins. SI on inter-annual basis have been calculated. SI is calculated thus:

SPI is a tool which was developed primarily for defining and monitoring drought. It allows an analyst to determine the rarity of a drought at a given time scale (temporal resolution) of interest for any rainfall station with historic data. It can also be used to determine periods of anomalously wet events. It was developed by McKee et al. (1993) as a method for assessing climatic variability. Conceptually, SPI is the number of standard deviations by which the precipitation values recorded for a particular location would differ from the mean over certain periods. In statistical terms, the SPI is equivalent to the Z-score.

Where: Z-score expresses the X score’s distance from the mean (μ) in standard deviation (δ) units.
Statistically, the SPI is based on the cumulative probability of a given rainfall event occurring at a station.
Water output was also collected from CAMWATE, Jakiri (1986- 2000) and Kumbo Water Authority (1975-1990).
Results and Discussions
Rainfall seasonality
Table 1: Seasonality Index Classes.

Seasonality of precipitation (Table 1) is the tendency for a place to have more rainfall in certain months than in others [19]. SI is the sum of the absolute deviations of mean monthly rainfalls from the overall monthly mean divided by the mean annual rainfall. SI is dimensionless (does not have units of measurement, but class limits and regimes) (Table 1).
The SI across Bui is as follows: Shisong (0.91), Tobin (0.91), Jakiri (0.91), Oku (0.92), Tatum (0.92), Takui (0.917) and Mbaw Nso (0.92). These give an average SI of 0.915. These values fall within the class limit 0.80–0.99. Therefore, rainfall in Bui is markedly seasonal with a long drier season. Normally, one would expect that the SI would be seasonal (0.60-0.79). This is an indicator of climate variability and long-term climate change. The markedly seasonal rainfall with a long drier season is as a result of prolonged droughts that lead to a delay in the onset of the rainy season. When the wet season begins in March/April, drought conditions will still prevail for several weeks, such that consistent rains prevail as from July. Jackson IJ [26] refers to this rainfall regime as a single rainy season and a single dry season. During the dry and wet seasons, the SI is 0.48 and 0.602, respectively. This falls in the class limit 0.40–0.59 (rather seasonal with a shorter drier season) and 0.60-0.79 (seasonal) respectively. This buttresses the fact that the climate of Bui is clearly defined with a marked wet season and a dry season. That is why the dry season is clearly defined to begin in November and ends in March/April, while the wet season begins in March/April to October.
Rainfall seasonality anomalies
There are marked differences between rainfall characteristics in the dry and rainy seasons. In this study, the seasonal demarcations are April-October, depicted are rainy season, while the dry season is marked from November-March. Each of the seasons has different rainfall trends as well as anomalies characterized extreme weather events. These weather extremes are episodes of abnormally heavy rainfall or droughts that are normally spill overs of ENSO events. For Jakiri, the rainfall had a downward trend during the dry season and a normal increasing trend during the rainy season (Figure 2&3).
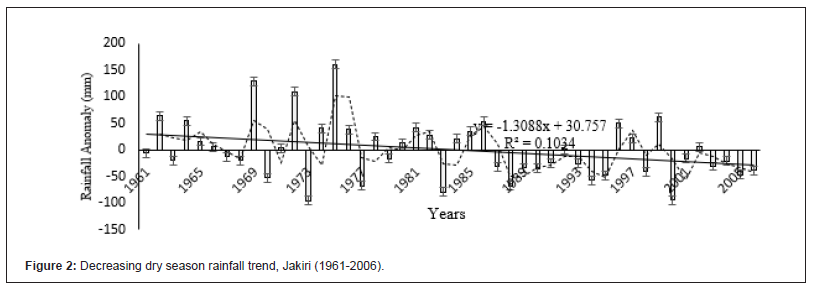
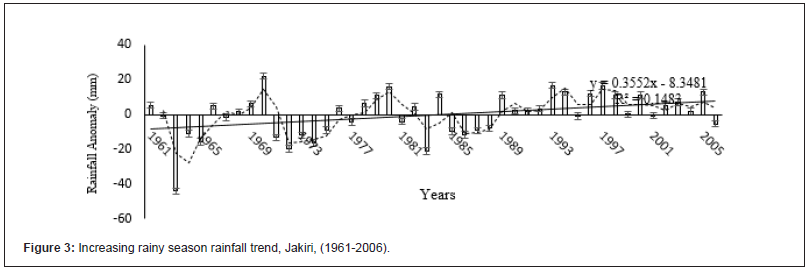
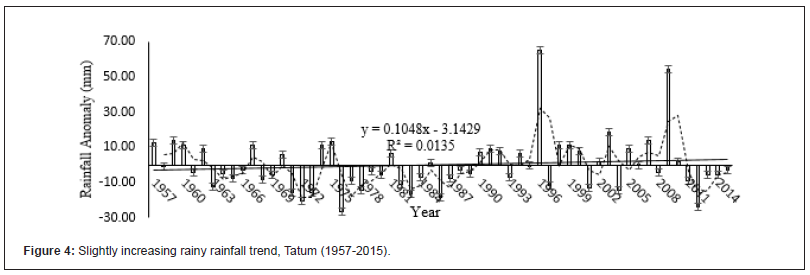
The decreasing rainfall trend during the dry season is as result of the strong harmattan winds that push the ITCZ towards the south. The harmmatan is a strong desiccating trade wind that brings drought conditions throughout the tropics. Rainfall trends are also variable in Tatum. Like Jakiri, there is an increasing rainfall trend in the rainy season, while the trend is decreasing in the dry season (Figure 4&5).

In Oku, the relative short duration of rainfall records (1986- 1997) already depicted a trend. Both dry and wet seasons have a decreasing rainfall trend in Oku (Figure 6&7).
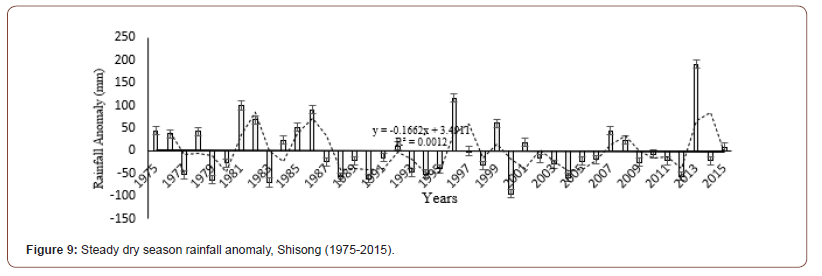
Seasonal rainfall trends for Shisong have little decrease for both seasons. The decreasing trend in the rainy season is as a result of the uncertainty in the onset of first rains and prolonged dry season. Over the past fifteen years, prolonged drought season have disrupted the agricultural calendar. Experience shows that when crops germinate in late March till mid-April, the rainfall is not sufficient to sustain growth of the tender crops. As a result, the crops ae often attacked by pests, get dry and farmers are compelled to re-plant (Figure 8&9).




Annual rainfall has been decreasing for both seasons in Takui (Figure 10&11).
Considering that Takui is one of the main watersheds in Bui (geo-hydrological center for the Bui and Marine stream systems), the future of these basins is at stake. Massive deforestation, unsustainable agricultural practices, overgrazing and large eucalyptus plantations are some of the causes of declining rainfall in this highland area.
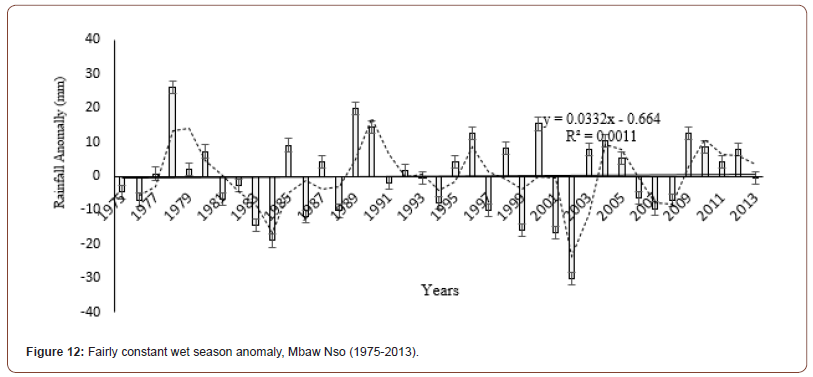
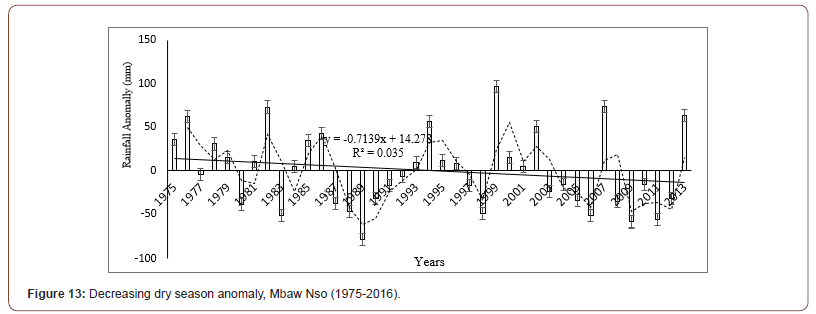
Annual rainfall has been fairly constant during the wet season in and decreasing progressively during the dry season in Mbaw Nso (Figure 12&13).
Annual rainfall has been increasing for both seasons in Tobin (Figure 14&15).


Standardized precipitation index
McKee TB, et al. [25] used the SPI to define drought intensities (Table 2). They also defined the criteria for a drought event for different timescales. A drought event occurs any time the SPI is continuously negative and reaches an intensity of -1.0 or less. The drought event ends when the SPI becomes positive. Each drought event, therefore, has a duration defined by its beginning and end, and an intensity for each month that the event continues. The positive sum of the SPI for all the months within a drought event can be termed the drought’s magnitude (Table 2).
Table 2: Drought Probability of Recurrence.

Drought scenarios throughout the Bui Plateau are illustrated (Figure 16-22).
For Tatum, 1957-1966, SPI values ranged from -0.92 to 1.28. There were 2 episodes of moderately wet: 4 episodes of mildly wet and 4 episodes of mild dryness. The decade 1967-1976 had SPI values of -1.78 to 1.05. This was marked by 1 episode of moderately wet; 2 episodes of mildly wet; 4 episodes of mild dryness; 2 episodes of moderate dryness and 1 episode of severe dryness during the 1976 drought. During the 1977-1986 decade, the SPI values ranged from -1.18 to 0.39. There were 4 episodes of mildly wet: 5 episodes of mild dryness and 1 episode of moderate dryness. From 1987-1996, SPI values were -0.58 to 3.45. There was 1 episode of extreme wetness (SPI of 3.45 in 1996); 4 episodes of mildly wet and 5 episodes of mild dryness. The decade 1997-2006, SPI values were -0.88-3.36. This was characterized by 1 episode of extreme wetness (SPI of 3.36 in 1999); 5 episodes of mild dryness and 2 episodes of moderate dryness. From 2007-2015, SPI values were -1.66 to -2.79. There was 1 episode of extreme wetness (SPI of 2.79 in 2009); 2 episodes of mildly wet; 5 episodes of mild dryness and 2 episodes of moderate dryness.


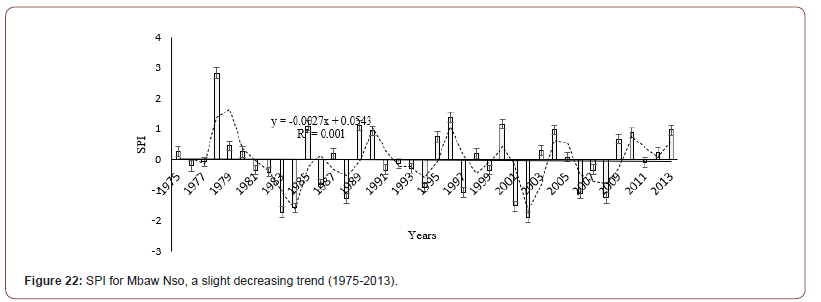
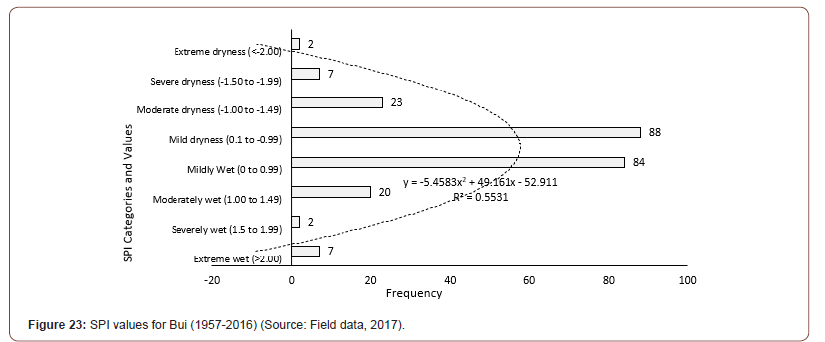


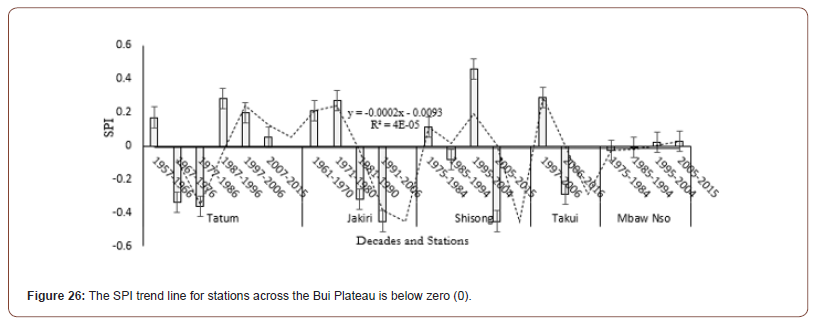
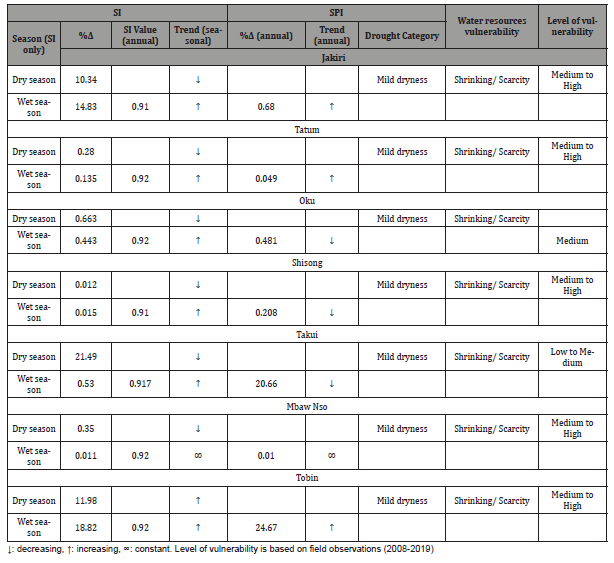
Table 3:SI-SPI trends and Vulnerability of Water Resources.
In Shisong, the 1975-1984 decade had SPI values of -2.65 (1983/84 drought) to1.32. This was characterized by 2 episodes of moderately wet; 5 episodes of mildly wet; 2 episodes of mild dryness and 1 episode of extreme dryness during the 1983/84 drought. From 1985-1994, SPI values were -1.29 to 1.37. There were 3 episodes of moderate wet; 1 mildly wet episode; 4 mild dryness episodes and 1 moderate dryness episode. During the 1995- 2004 decade, SPI values were -0.42 to 1.7. There were 2 severely wet episodes; 5 mild dryness episodes and 3 moderate dryness episodes. From 2005-2015, SPI values were -1.79 to 0.99. There were 3 mildly wet episodes; 5 mild dryness episodes and 3 moderate dryness episodes.
Jakiri has also witnessed variations in SPI values. From 1961- 1970, the values were -2.64 (1963 drought) to 1.07. There was 1 episode of moderate wet conditions; 3 episodes of mild dryness; 1 episode of severe dryness and 1 episode of extreme dryness (during the 1963 drought). From 1971-1980, SPI values were -1.07 to 0.76. There were 4 episodes of mildly wet: 3 episodes of mild dryness and 3 episodes of moderate dryness. The 1981-1990 decade was marked by SPI values of -1.49 (1983/84 drought) to 4.67 (severely wet conditions in 1986). There was 1 episode of severely were conditions, 3 episodes of mildly wet: 3 episodes of mild dryness and 3 episodes of moderate dryness during the 1997/98 El Nino. 2001-2006 had SPI values of -0.56 to 0.23. It was characterized by 3 episodes of mildly wet conditions and 3 episodes of mild dryness.
From 1986-1997 in Oku, SPI values were -1.79 to 1.18. There were 2 episodes of moderately wet; 5 episodes of mildly wet; 3 episodes of mild dryness and 2 episodes of severe dryness (1997 El Nino). In Tobin, the period 1998-2009 had SPI values of -1.8 to 1.39. This was marked by 3 episodes of moderately wet conditions: 4 episodes of mildly wet, 2 episodes of mild dryness and 3 episodes of moderate dryness. In Takui, SPI values were -0.06 to 2.73 (1997- 2016). There were 2 episodes of extreme wet; 2 episodes of mildly wet; 5 episodes of mild dryness and 1 episodes of severe dryness (1997 El Nino). From 2007-2016, SPI were -0.99 to 0.1. This was marked by 4 episodes of mildly wet and 6 episodes of moderate dry conditions. Mbaw Nso, a lowland agro-ecological basin and major hollow frontier, with an altitude of less than 900m asl had 1 episode of extreme wet conditions (1978). The SPI value in 1978 was 2.85. There were 5 episodes of moderately wet conditions, 13 episodes of mildly wet, 12 episodes of mild dryness, 6 episodes of moderate dryness and 2 episodes of severe dryness (1983-84 droughts). During the 1983-84 droughts, the SPI values ranged from -1.55 to -1.69. In summary, there have been 7 episodes of extreme wet, 2 episodes of severely wet, 20 episodes of moderately wet, 84 episodes of mildly wet, 88 incidents of mild dryness, 23 episodes of moderate dryness, 7 episodes of severe dryness and 2 episodes of extreme dryness between 1957-2015 (Figure 23).
Water resources vulnerability and scarcity
There is exposure of the hydrological system to droughts. Droughts are assessed in terms of the frequency, magnitude and duration using SPI (Table 3).
On the Bui Plateau, mild droughts are common all year round, especially during the dry season, when water resources shrink through the drying out of seasonal springs and streams. To be precise, there have been 88 incidents of mild dryness, 23 episodes of moderate dryness, 7 episodes of severe dryness and 2 episodes of extreme dryness from 1957-2015 [27,28]. Hazards include any threats to the system, both sudden shocks and slow increases in stress on the system (due to land degradation, increased rainfall variation). Water resources are very sensitive to current weather and climatic conditions. This sensitivity is determined by environmental and human characteristics that contribute to the hydrological systems responses to exposure. The Bui Plateau is a high energy environment where the topography ranges from ≈900-3,000m asl. The climate is seasonal, with a rainfall seasonality index of 0.917 (prolonged dry seasons) [29]. Watersheds are under the pressure of incompatible land uses (cultivator-grazier conflicts). All these pressures on water resources are occurring against a backdrop of rapid population growth and ailing water infrastructure. These exposures and sensitivities have drastically reduced the resilience of the water system to climate variability. As such, the vulnerability of water resources is medium to high in some communities.
Climate variability and change affects the function and operation of existing water infrastructure, drainage, and management practices. In most parts of the world, current water management practices may not be robust enough to cope with the impacts of climate variability and change. Observational records provide strong evidence that freshwater resources are vulnerable and will be strongly impacted by climate change, land use and land change and deforestation. Water availability is currently and will be increasingly, dependent on a combination of both natural hydro-climatic variability and anthropogenically-influenced climate change. Thus, a detailed understanding, monitoring, modelling and prediction of the hydro-climatic variability, in particular at inter-decadal and decadal timescales are essential for water resource management. Water output and storage capacity is variable. In Jakiri, the water output had an increasing trend (1986-2000) (Figure 24), while water storage capacity for Kumbo had a decreasing trend (1975- 1990) (Figure 25). Thus, water resources are vulnerable to climate variability. The situation is worsening as water crisis is the order of the day.
Water scarcity has been recurrent throughout the Bui Plateau as indicated by the annual SI of 0.915 and prevalence of mild drought categories. The duration of the dry season has consistently increased over the years. The trend line on the SPI graph for all the stations combined is negative (Figure 26). The consequences are severe domestic water scarcity, recurrent cultivator-grazier conflicts at hollow frontiers and increasingly, pasture scarcity on rangelands. With the increasingly variable and changing climate, the recurrence of these mild droughts could increase to moderate, severe, or even extreme drought scenarios. This calls for adequate conventional and indigenous strategies to adapt to these conditions [30] Field observations concludes that the level of water resources vulnerability is medium to high. If these changes in rainfall indices continues, then the Bui Plateau will likely experience very high to extreme levels of water resources vulnerability.
Coping with water scarcity
Rural communities have a long history of responding to climate variability and change, but with varying levels of success. These short-term coping strategies can form the basis of successful longterm adaptation strategies [31]. Most of the community water supply schemes in the Bamenda Highlands of Cameroon were realized by HELVETAS (Swiss Association for International Co-operation) from the 1960s to the late 1990s. This organization routinely proposed catchment areas protection for sustainable water production. Two types of catchment areas are distinguished: spring protection, if the water intake is at the spring, or riverbank protection, if water intake is from a river or stream [32]. In general, a participatory approach is followed, where the local population is trained and empowered to manage their own water catchment area. In a typical case, the ownership of the catchment area is obtained by a local water management committee (WMC) that employs caretakers to manage the catchment area. The area is clearly demarcated and fenced with barbed wire to keep cattle out. A life fence is planted to create a permanent and sustainable protection of the area against cattle and bush fires. Fire tracing around watershed is also effective in some communities. Indirectly, catchment protection is facilitated by introducing income generating activities for graziers and farmers with the aim to prevent them from entering the catchment areas. The local population who has been sensitized on this approach are then supposed to manage the catchment area in collaboration with the WMC at their own time and expense. From 1998 to 2004, HELVETAS designed and implemented watershed projects in 44 communities in Bui [33]. This involved the protection of about 60 catchments, covering a surface area of over 1,800ha. Major causes of watershed degradation are the expansion of eucalyptus plantations, unsustainable agricultural activities, and grazing. The eucalyptus tree secretes toxins which inhibit the growth of other plant species. A mature eucalyptus tree takes up about 400 litres of water daily and has as such led to the drying up of water in catchment areas. The introduction of indigenous/exotic trees into these areas using Analog Forestry is a good option for the rehabilitation of these degraded areas. Local and international NGOs like SHUMAS (Strategic Humanitarian Services) and HELVETAS championed watershed protection since the 1990s. Municipal Councils have also been active in water catchment protection [34]. For instance, the Kumbo Urban made a project proposal to protect some existing water catchments in the municipality [35]. These included Kitiwum, Kikaikelaki, Kai, Meluf, Melim, Mbuluf, Nzenshwai, Njavnyuy and Tadu. The role of the municipal councils is to co-ordinate and assist the various water schemes, by seeking funding and supervising the execution. The inhabitants of these villages are involved in tree and grass planting, bush fire control and construction of dead and live fences [36,37].
Conclusion
The Bui Plateau has a wet season that covers a period of eight months and a dry season spell of about four months. This erroneously gives the impression that water resources are available for most parts of the year. Each year, water scarcity continues to be heightened especially during the drought season. Climatic data have proven that the coming of the rainy season comes around mid- March. However, the beginning of rainfall does not mean the abrupt recharge of springs from catchments given the rate of human occupation of watersheds. This partly explains why despite the coming of the rains in March, water scarcity still extends to the month of April. During the first two months of rainfall (March and April) which is generally intense, the increased surface runoff pollutes water resources as a result of deposition of sediment from arable land, which occupy the major watersheds of Bui.
Continuous global climatic variations have affected water supply. This has been seen in the reduced and less reliable nature of stream flow whose magnitude and trend depend strongly on local climatic, hydrological, and ecological conditions. Although there exists scarcity of data to scientifically ascertain this assumption, field observations suggest that the gradual changes in rainfall patterns, increased evapotranspiration and alterations of the soil properties are gradually displacing the dominant sandwiched savannah/forest ecological boundary with increasing drier conditions over time. These have negatively affected the supply of water. Meteorological droughts are recurrent more than ever before as justified by SI: Shisong (0.91), Tobin (0.91), Jakiri (0.91), Oku (0.92), Tatum (0.92), Takui (0.917) and Mbaw Nso (0.92). These values fall within the class limit 0.80–0.99 on the SI classification table giving a markedly seasonal rainfall regime with a long drier season. Normally, one would expect that the SI would be seasonal (0.60-0.79). This is an indicator of climate variability and long-term climate change. The markedly seasonal rainfall with a long drier season is as a result of prolonged droughts that lead to a delay in the onset of the rainy season. Again, when the wet season begins in April, drought conditions will still prevail after several weeks, such that consistent rains prevail as from July. Jackson IJ [26] refers to this rainfall regime as a single rainy season and a single dry season. During the dry and wet seasons, the SI is 0.48 and 0.602, respectively. This falls in the class limit 0.40–0.59 (rather seasonal with a shorter drier season) and 0.60-0.79 (seasonal) respectively. This buttresses the fact that the climate of Bui is clearly defined with a marked wet season and a dry season. That is why the dry season is clearly defined to begin in November and ends in March/April, while the wet season begins in March/April to October. Again, average SPI values indicate that drought frequency on the Bui Plateau ranges from -0.01 to -0.45 (mild to moderate droughts, which indicate meteorological droughts).
Climate predictions several seasons in advance are currently making progress in narrowing the uncertainty in hydrologic predictions for water resource management, natural hazard mitigation, and related decision-making and policy guidance. This has been possible particularly for river basins with high sensitivity to climate variations associated with large-scale ocean–atmospheric phenomena such as ENSO. The use of climate information from seasonal prediction systems and climate change projections is often made by different water related sectors in different regions, with varying degrees of effectiveness. The quantities that climate models correctly predict are not necessarily the quantities needed by decision-makers for managing water resources or mitigating natural hazards. There is a need for forecasts to be issued probabilistically so that uncertainty estimates accompany the climate–hydrologic model outputs in order to provide better information for decision-making and management of risk. Methods for translating uncertain climate information to products useful for sector decision-making are in their infancy and much research is needed to advance them. A barrier to effectively integrating the output from large-scale climate models in hydrology and water resource management is the lack of active collaboration among scientists in these various disciplines and between scientists and stakeholders. National and international opportunities for cross-disciplinary collaboration on important water resources and environmental management issues that are sensitive to climate variability need to be assured. Although observational data and data access are prerequisites for sector management, many observational networks are shrinking. The climate observing system particularly in least developed regions is poor and, in some cases, such as in Africa, is deteriorating. Ways of securing climate observing systems and integrating climate information into water resource management are urgently needed.
Acknowledgement
None.
Conflict of Interest
No conflict of interest.
References
- Lükenga W (2015) Water Resource Management. Book Boon, UK, pp. 18-19.
- Arnell NW (2006a) Global Impacts of Abrupt Climate Change: An Initial Assessment. Working Paper 99, Tyndall Centre for Climate Change Research, University of East Anglia, UK, pp. 37.
- Arnell NW (2006b) Climate Change and Water Resources: A Global Perspective. Avoiding Dangerous Climate Change. Cambridge University Press, UK, pp. 167-175.
- Frederick KD, Major DC (2004) Climate Change and Water Resources. In: Toman MA and Sohngen B (2004) Climate Change. The International Library of Environmental Economics and Policy, Ashgate Publishing Company, USA, pp. 41-57.
- Bates BC, Kundzewicz ZW, Wu S, Palutikof JP (2008) Climate Change and Water. Technical Paper of the Intergovernmental Panel on Climate Change. In: Bates BC, Kundzewicz ZW, Wu S, Palutikof JP (eds), IPCC Secretariat, Germany, pp. 210.
- United Nations Framework Convention on Climate Change (UNFCCC) (2011) The Nairobi Work Program on Impacts, Vulnerability and Adaptation to Climate Change; Climate Change and Freshwater Resources: A Synthesis of Adaptation Actions Undertaken by Nairobi Work Program Partner Organizations. UNFCCC Secretariat, Germany, pp. 10-11.
- Kirono DGC, Hennessy KJ, Grose MR (2017) Increasing Risk of Months with Low Rainfall and High Temperature in Southern Australia for the past 150 years. Climate Risk Management 16: 10-21.
- Smit B, Pilifosova O (2001) Adaptation to Climate Change in the Context of Sustainable Development and Equity. Climate Change 2001: Impacts, Adaptation and Vulnerability, Cambridge University Press, UK, pp. 879-905.
- Kolawole DO, Wolski P, Ngwenya B, Mmopelwa G (2014) Ethno-meteorology and scientific weather forecasting: Small farmers and scientists’ perspectives on climate variability in the Okavango Delta, Botswana. Climate Risk Management 4-5: 43-58.
- Niang I, Ruppel OC, Abdrabo MA, Essel A, Lennard C, et al. (2014) Africa In: Barros VR, Field CB, Dokken DJ, Mastrandrea MD, Mach KJ, et al. (eds), Climate Change 2014: Impacts, Adaptation and Vulnerability. Part B: Regional Aspects. Contribution of Working Group II to 5AR of the Intergovernmental Panel on Climate Change. Cambridge University Press, UK & USA, pp. 1199-1265.
- Intergovernmental Panel on Climate Change (IPCC) (2007) Climate Change 2007: Impacts, Adaptation and Vulnerability. Contribution of Working Group II to the Fourth Assessment Report of the Intergovernmental Panel on Climate Change. Cambridge University Press, UK, pp. 976.
- Jiménez Cisneros BE, Oki T, Arnell NW, Benito B, Cogley JG, et al. (2014) Freshwater resources. In: Field CB, Barros VR, Dokken DJ, Mach KJ, Mastrandrea MD, et al. (eds), Climate Change 2014: Impacts, Adaptation and Vulnerability. Part A: Global and Sectorial Aspects. Contribution of Working Group II to the Fifth Assessment Report of the Intergovernmental Panel on Climate Change, Cambridge University Press, UK & USA, pp. 229-269.
- Boucher G (1999) Global Warming. In: Pacione M (edr) Applied Geography: Principles and Practice, An introduction to useful Research in Physical, Environmental and Human Geography, Routledge press, UK, pp. 21-33.
- United Nations Environment Programme (UNEP) (2010) Making the Case for Ecosystem-based Adaptation: Building Resilience to Climate Change. UNEP, Nairobi, pp. 11.
- Bertram M, Barrow E, Blackwood K, Rizvi AR, Reid H, et al. (2017) Making Ecosystem-based Adaptation Effective: A Framework for Defining Qualification Criteria and Quality Standards (Friends of Ecosystem-based Adaptation-FEBA technical paper developed for UNFCCC-SBSTA 46). UK, pp. 14.
- Ericksen P, Thornton P, Notenbaert A, Cramer L, Jones P, et al. (2011) Mapping Hotspots of Climate Change and Food Insecurity in the Global Tropics. CCAFS Report CGIAR Research Program on Climate Change, Agriculture and Food Security (CCAFS), Denmark, pp. 50.
- Walsh RPD, Lawler DM (1981) Rainfall Seasonality: Description, Spatial Patterns and Change through Time. Weather, (36), 201-208.
- Olaniran OJ (1983) The Monsoon factor and Seasonality of Rainfall Distribution in Nigeria. Malaysian Journal of Tropical Geography 7: 38-41.
- Patil MK (2015) Change in Seasonality Index of Rainfall in Sangli District. Indian Streams Research Journal 5-1: 1-7.
- Ngongondo C, Tallaksen LM, Xu CY (2014) Growing Season Length and Rainfall Extremes Analysis in Malawi. Hydrology in a Changing World: Environmental and Human Dimensions, pp. 361-366.
- Chabala LM, Kuntashula E, Kaluba P (2013) Characterization of Temporal Changes in Rainfall, Temperature, Flooding Hazard and Dry Spells over Zambia. Universal Journal of Agricultural Research 1(4): 134-144.
- Omotosho JB, Balogun AA, Ogunjobi K (2000) Predicting Monthly and Seasonal Rainfall, Onset and Cessation of the Rainy Season in West Africa using only Surface Data. International Journal of Climatology 20(8): 865-880.
- Abaje IB, Ishaya S, Usman SU (2010) An Analysis of Rainfall Trends in Kafanchan, Kaduna State, Nigeria. Research Journal of Environmental and Earth Sciences 2(2): 89-96.
- World Meteorological Organization (2012) Standardized Precipitation Index User Guide. Switzerland, pp. 24.
- Mc Kee TB, Doesken NJ, Kleist J (1993) The Relationship of Drought Frequency and Duration to Time Scales. Proceedings of the Eighth Conference on Applied Climatology. American Meteorological Society, USA, pp. 179-184.
- Jackson IJ (1982) Climate, Water and Agriculture in the Tropics. UK.
- Tume SJP (2019) Standardized Precipitation Valuation of Water Resources Vulnerability to Climate Variability on the Bui Plateau, Northwest Cameroon. Environment and Ecology Research 7(2): 83-92.
- Tume SJP, Kimengsi JN, Fogwe ZN (2019) Indigenous Knowledge and Farmer Perceptions of Climate and Ecological Changes in the Bamenda Highlands of Cameroon: Insights from the Bui Plateau. Climate 7(138): 1-18.
- Tume SJP (2008) Rainfall Variability and Implications on Water Resources Management: The Case of Bui Division, Northwest Province of Cameroon. University of Buea, Cameroon, pp. 210.
- Tume SJP, Fogwe ZN (2018) Standardized Precipitation Index Valuation of Crop Production Responses to Climate Variability on the Bui Plateau, Northwest Region of Cameroon. Journal of Arts and Humanities 1(2): 21-38.
- Organization for Economic Co-operation and Development (OECD) (2009) Integrating Climate Change Adaptation into Development Co-operation, Policy Guidance, OECD, UK, pp. 193.
- Waarde van der JJ (2004) Helvetas Cameroon Experiences in Catchment Protection Activities. Helvetas Cameroon, Swiss Association for International Co-operation, Gospel Printers, Cameroon, pp. 24.
- Wirsiy EF, Youndjie KG, Atanga W, Fru M (2006) Feasibility Study on the Introduction of Analog Forestry in Bui Division, Northwest Province of Cameroon: Report on Community Consultation. Centre for Nursery Development and Eru Propagation (CENDEP), UK.
- Tume SJP, Tani BV (2018) Stakeholders Signature to Climate Change Adaptation in the Agrarian Sector of Bui Plateau, Northwest Cameroon. Journal of Environmental Issues and Agriculture in Developing Countries 10(3): 140-156.
- Lingondo PE, Lawir FY, Ndzefemmegho P, Fonba E, Tanda GA, et al. (2008) Baseline Socio-Economic Report for Mvem Cluster, Kitiwum and Mbiame in Bui Division. CENDEP, UK.
- CENDEP (2008) First Project Review and Planning Workshop.
- CENDEP (2009) Second Project Review and Planning Workshop, UK.
- Jackson IJ (1982) Climate, Water and Agriculture in the Tropics. UK.
-
Suiven John Paul Tume. Rainfall Seasonality and Standardized Precipitation Valuation of Water Resources Susceptibility to Climate Variability on the Bui Plateau, Northwest Region, Cameroon. Adv in Hydro & Meteorol. 1(1): 2021. AHM.MS.ID.000502.
-
Climate variability, Coping strategy, Precipitation, Vulnerability, Water scarcity, Rainfall seasonality, Water resources
-

This work is licensed under a Creative Commons Attribution-NonCommercial 4.0 International License.


