 Research Article
Rainfall Projection Using Different Emission Scenarios for Two Climatic Normals in the Niger Delta Region of Nigeria (2016-2045 and 2045-2075)
Kpang MBT1, Weli VE1*, and Okwapkpam I2
1Department of Geography and Environmental Management, University of Port Harcourt, Nigeria
2Ignatius Ajuru University of Education, Rumuolumeni, Rivers state, Nigeria
Weli VE, Department of Geography and Environmental Management, University of Port Harcourt, Nigeria.
Received Date: April 1, 2021; Published Date: June 01, 2021
Abstract
This study projected rainfall using for two emission scenarios (A2-high emission and B2-low emission) and for four seasons (DJF, MAM, JJA and SON). The projection reveals that Yenagoa and Port Harcourt are areas that will have an increase in rainfall amounts of more than 10mm under A2 scenario in DJF within the first climate normal (2016-2045) and the increase is further expected to step up to above 12mm within the next climate normal (2045-2075) while under the B2 scenario the projection reveal a decline in rainfall amounts within Benin, Ogoja, Owerri, Ondo and Umudike within the first climate normal (2016-2045) while Ondo is projected to experience a decline within the next climate normal (2045-2075) in DJF. In MAM in both the first and second climate normals under the two emission scenarios (A2, B2), there is constant, steady, and significant increase in rainfall amounts over the region. More specifically, Warri, Calabar, Port Harcourt, Uyo and Yenagoa is projected to experience an increase in rainfall amounts of more than 20mm under the A2 scenario in the first and second climate normals while on the other hand, under the B2 scenario the projection reveal that an increase in rainfall amounts of more than 10mm will affect Warri, Calabar, Port Harcourt, Uyo, Owerri and Yenagoa in the second climate normals while all the cities are also affected except Owerri in the first climate normal. Generally, under emission scenarios, A2 and B2 only cities like Ikom, Ondo and Umudike are projected to have extremely low increase in rainfall amount within the MAM season of the climate normals. The Statistical Downscaling Model developed revealed increase in rainfall amounts within the projected period in the two climate normals with higher increase under A2 scenario than B2. The study recommends that it is necessary to develop a local climate management system in preparedness for climate change. Effort should be made to initiate and maintain the B2 scenario, intensification of public awareness campaign on coping and adaptation strategies to climate change
Keywords: Rainfall projection; Climate normal; Emission scenarios; Niger delta region
Introduction
Climate change may have drastic implication for temperature and precipitation patterns, including increased climate variability [1]. The Intergovernmental Panel on Climate Change [2] suggested that climate hazards, including alteration in precipitation cycles have consequences such as reduced crop yields due to changing local temperature regimes and, the food security of vulnerable populations is likely to decrease due to extreme weather events. However, Reiter A, et al. [3] have noted that climate changes will not be homogeneous or uniform globally but there will be possible occurrence of substantial differences in temperature and precipitation trends at the regional level. This situation has led to several investigations in the form of trend analyses of meteorological observations in recent years with remarkable results [4-7].
Precipitation which includes rain, snow, hail, and sleet, varies from year to year over decades, centuries, millennia and over space. Changes in its amount, intensity, frequency, and type enormously affect the environment and society in myriad of ways. Rain is not only the most popular form of precipitation, but also the most variable component of the climate system and has a vital role in equal balancing of surface and sub-surface water resources through the hydrologic cycle process in nature. It is one of the most important climatic variables because of its two-sided effects - as a deficient resource, such as droughts and as a catastrophic agent, such as floods. Several studies have been carried out on rainfall at different temporal scales ranging from daily to annual and in different areas [8- 11]. It is expected to result in long-term water and other resource shortages, degrading soil condition, disease and pest outbreaks on crops and livestock and so on.
Rainfall is a vital weather element which can give information on the state of an environment [12]. A decreasing and/or rise in rainfall may be quite instructive for different segments of the human and natural systems. Rainfall is an aqueous deposit derived from the atmosphere, which appears in solid, liquid, and gaseous state in our environment [13]. On the other hand, rainfall pattern is a term that comprises many components, including mean and other statistical measures of annual rainfall total, its temporal distribution, the length of the rainy season onset and cessation, distribution of rain-spells and their yields, distribution of dry-spells etc. Furthermore, rainfall is an important weather and climate parameter that affects socio-economic livelihood of people within the global community especially in the developing countries practicing rainfed agriculture. It is usually considered the most important weather element because it has the largest space and time variability especially in the tropical region such as the Niger Delta [14].
Several studies in the field of climate change and global warming have proven the usefulness of Statistical Downscaling Model (SDSM) for downscaling process [15-17]. Many statistical models have been developed and were first mostly applied in Europe and in the USA [18-30]. However, these are currently used throughout the world to examine changes in climate variables using the results of GCMs to downscale climate change impact particularly at regional and local scales [31-38]. On regional basis some studies which seek to identify the effects of climate change on climatic variables and temperature extreme have been done in Africa. It has been reported that over West Africa rainfall distribution is palpably critical for many activities such as hydroelectric power generation, water resources monitoring, rain-fed agriculture, drought, and flood forecasting [39-42].
However, despite the international modeling efforts to downscale the impact of global warming over different regions and nations of the world [43-47]; no known study applying downscaling techniques on rainfall is available for Nigeria and specifically for the Niger Delta region. This is the gap which this study intends to provide.
Methodology and Geography of study area
Secondary data were used in this study and they are basically of two-fold. The first category of data used was rainfall data measured at different local meteorological stations within the Niger Delta region (which in this context is referred to as predictand) and these set of data was collected from the archive of the Nigerian Meteorological Agency for a thirty-year period covering 1986-2015. While the second category of data used was the global scale climate variables also known as large scale predictors and these other set of data was sourced from the archive of the various working groups such as Hadley Centre Global Climate model version 3 (HadCM3) and National Centre for Environmental Prediction (NCEP)/National Centre for Atmospheric Research reanalysis project for two emission scenarios (A2 = high greenhouse gas emission and B2= low greenhouse gas emission) as displayed in table 1.
To augment the missing period, the National Centre Environmental Prediction (NCEP) reanalysis data was accessed and validated by running a Pearson Product Moment Correlation analysis between the NCEP reanalysis data and the available period of measurement by NIMET. The validity of the data was made based on r2 value and p-value at 0.05 confidence level as well as the root mean square error coefficient (RMSE) between observed and NCEP/ NCAR data. On the other hand, for some of the stations that had data in respect to the baseline periods (1986-2015), there were also periods with missing datum in some of the local stations which was normalized by using the interpolation and extrapolation method suggested and successfully used with desirable results in similar studies by [48-51]. Rainfall data used for this study are for one climatic normal (1986-2015) and this is so because apart from being the maximum data field limit for operationalizing the SDSM as proposed by the builder of the model, the use of 30-year weather data in characterizing the climate of an area has also been recommended by the World Meteorological Organization (WMO) as sufficient for calculating climatic normal.
In the case of large-scale predictors, it was accessed from the records of HadCM3. NCEP/NCAR reanalysis predictors used for calibration and HadCM3 data used for weather and scenarios generation are the two basic forms of large-scale predictors that exist. Meanwhile, the qualitative (e.g., scatter plots) as well as quantitative (e.g., value of explained variance for different months, correlation, partial correlation (r) and P values) approaches suggested by [52] was adopted for obtaining the most suitable sets of predictors corresponding to individual station from the site of NCEP/NCAR predictors displayed in table 1.
The Statistical Downscaling Model version 4.2 developed by [53] was employed in this study to build statistical relationships between GCM predictors and local climate variable. Other analytical tool also used in this study includes Pearson Product Moment Correlation (PPMC), Analysis of Variance (ANOVA), and Multiple Regression Analysis (MRA) and Wilcoxon rank test. The SDSM is essentially carried out according to the following procedural steps; Quality control and data transformation, screening of predictor variables, model calibration, weather generation (using observed predictors), Statistical analyses, graphing model output and scenario generation (using climate model predictors). All these operate on the principle of multiple linear regressions using the equation shown below:

Where Y= Predicatand (rainfall)
X1-Xn = regressions coefficients for b1-bn
e = error term
Nevertheless, some of the steps listed did not apply in this study because of the subject of investigation whereas all the necessary steps applicable to the predictand in this study were carefully followed. In respect to data screening rainfall was fed into the model to check the following; 1) whether the data were well arranged to suit the SDSM format; 2) whether there were missing periods in data; c) if there were outliers in the data on the other hand, the predictors were also screened and this was achieved by running a correlation between the predictors and the predictand and the predictors were further selected on the basis of correlation ( r2), partial correlation (r), and p values as suggested and applied in several studies [54-56] with huge success. Again, the large-scale atmospheric predictors from the NCEP/NCAR reanalysis data sets were used for calibration and validation of the downscaling models. The calibration was achieved by running a seasonal scale sub-model and subsequently verified if it suits the Niger Delta region. The results of model performance strongly correlated with the observed data and were significant at p<0.05.
The calibrated data were then used to generate ensembles data for the area and the output consequently validated in comparison with the observed data to verify if they sufficiently represent the observed data and thus a predictive model. In order to achieve this, the root mean square error (RMSE), the coefficient of determination (R2), and Ratio of standard deviation (RSD) and p-values between observed and simulated data were performed for the period 2001-2015. (Table 1).
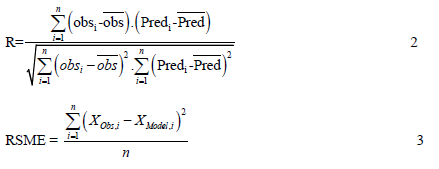
The performance of the model is measured on the strength of R and RMSE and the closer R values to 1 and RMSE value to 0, the predictions are better.
At the successful calibration and validation, the derived predictors of the HadCM3 (Hadley Center for Climate and Prediction and Research) were used to simulate rainfall amount for all local meteorological stations in Niger Delta region from the baseline period (1960) to the end of the projected period for this study (2080). This data, therefore, formed the downscaled rainfall variables for all stations of the Niger Delta region use for the projection of rainfall for the teo climate normals.
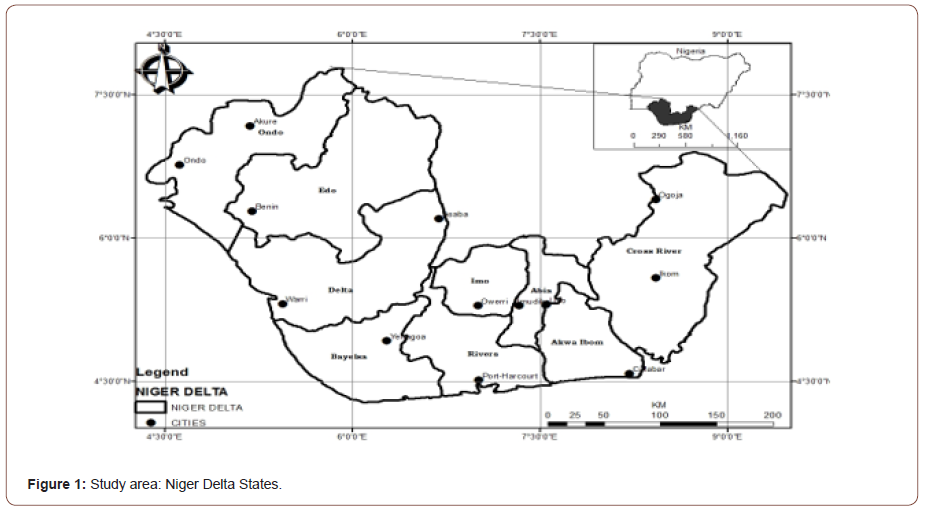
The Niger Delta, as now officially defined by the Nigerian government, extending over about 70,000 km2 (27,000 sq mi) and make up 7.5% of Nigeria’s land mass historically and cartographically consists of present-day Bayelsa, Delta, Rivers, Abia, Akwa-Ibom, Cross River, Edo, Imo, and Ondo States in the region. The Niger Delta region, located within the tropical rainforest climate zone lies between latitudes 4.15°N - 7.17°N and longitudes 5.05°E - 8.68°E) along the Lower Guinea Coast. It is in the Atlantic Coast of southern Nigeria at the point where River Niger divides into numerous tributaries. Accordingly, it is the second largest delta in the world with a coastline which spans about 450 kilometers and terminates at the entrance of River Imo and remain the largest wetland in Africa and among the three largest in the world and of course the richest wetland in the world [57-59]. The ecosystem of the area is highly diverse and supportive of numerous species of terrestrial and aquatic flora and fauna and human life. The region is divided into four ecological zones namely coastal inland zone, mangrove swamp zone, freshwater zone, and lowland rain forest zone (ANEEJ, 2004). The Niger Delta has the largest mangrove swamps in Africa, with its stagnant swamp covering about 8600 squares, and about 2,370 square kilometers of the area consist of rivers, creeks, and estuaries [60]. It covers over 70,000km2 and constitutes about 7.5% of Nigeria’s land mass. Within West Africa, with an annual rainfall totals varying from 2400mm to 4000mm [61, 62]. The region is dominated by mining activity (petroleum) and has about 70% of its population living in rural areas. Rain fed agriculture is the major means of sustenance of the people. The area is influenced by the localized convection of the West African monsoon with less contribution from the mesoscale and synoptic system of the Sahel (Ba et al., 1995). The monsoon rains (wet) season over the area begins in May, as result of the seasonal northward movement of the Intertropical Discontinuity (ITD), with cessation in October [63-66]. Politically, the Niger Delta is situated in the southern part of Nigeria and made up of nine states which include Abia, Akwa Ibom, Bayelsa, Cross River, Delta, Edo, Imo, Ondo, and Rivers as shown in figure 1 below (Figure 1).
Results and Discussion of Findings
Rainfall characteristics with different emission scenarios in the Niger Delta Region
Comparison between observed and modeled rainfall data: Table 2 shows the DJF (December, January, February) data for observed and simulated average rainfall information for the various meteorological stations for the period under review. It is clear from the table that the initial validation analysis presented in table 1, 2 above can be sustained, indicating that the model sufficiently captures distribution of rainfall in the Niger Delta region. Accordingly, it is obvious from the tabulated records that the observed and simulated data within the period of validation sufficiently matches. For instance, in Warri while observed is 37.1mm, the simulated is 36.7mm. However, in Akure the simulated and observed data are the same having 17.7mm respectively. On the other hand, Ogoja also demonstrate similar pattern with Akure where the simulated and observed data in this case equally have the same values of 10.8mm, respectively. Nevertheless, simulated data for Umudike and Calabar are 0.4mm and 0.5mm respectively higher than the observed data. Because of the record presented in the above table, it is evidently clear that the simulated data significantly matches the observed data and captures the general pattern of rainfall for the Niger Delta region for the season of the year (Figure 2).
Table 1: List of NCEP Predictors.
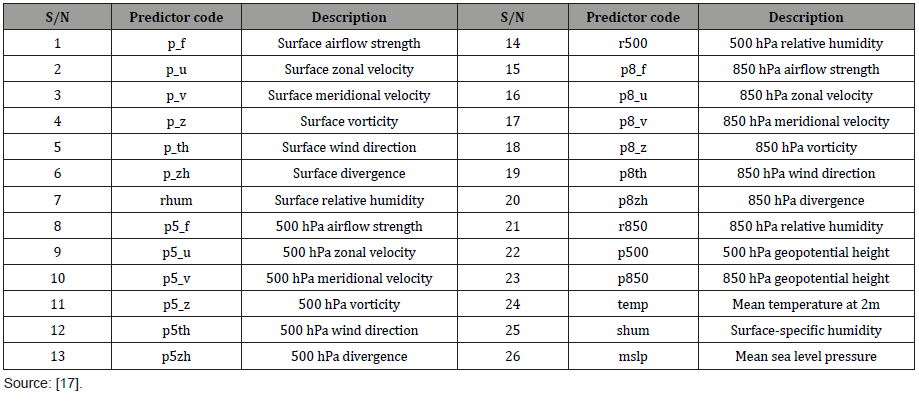
Table 2: DJF Observed and Modelled Rainfall Data for Niger Delta Region.

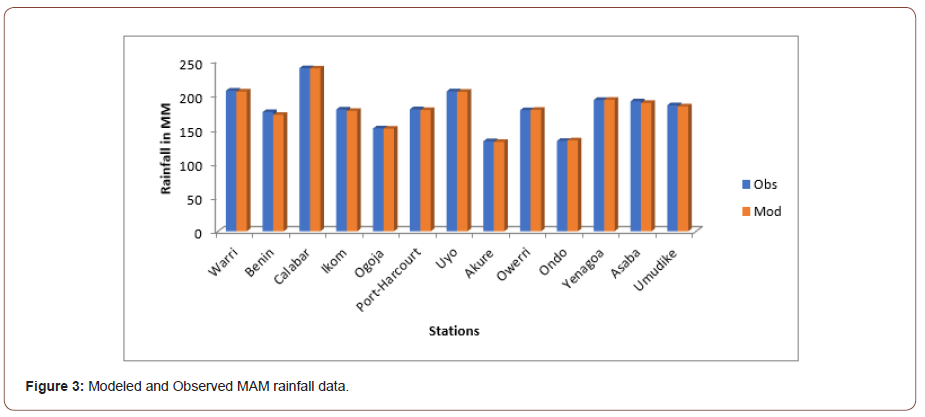
In Table 3 the MAM data for observed and simulated average rainfall information for the various meteorological stations for the period under review are displayed. From the values of the simulated and observed data reported in the table it suggests that the model sufficiently captures the local data characteristics for rainfall in the Niger Delta region implying therefore that the validation analysis presented in table 3 above can be sustained. Accordingly, it is obvious from the tabulated records that the observed and simulated data within the period of validation sufficiently matches. Justifiably accounting for the fact that the observed and simulated data matches, observed data for Warri is 205.9mm against 204.6mm simulated for the same station. However, the simulated data for Yenagoa, Owerri and Ondo are 0.3mm, 0.5mm and 0.8mm higher than the observed. Because of the record presented in the above table, it is evidently clear that the simulated data significantly matches the observed data and captures the general pattern of rainfall for the Niger Delta region for the season of the year (Figure 3).
Table 3: MAM (March, April, May) Observed and Modelled Rainfall Data for Niger Delta Region.

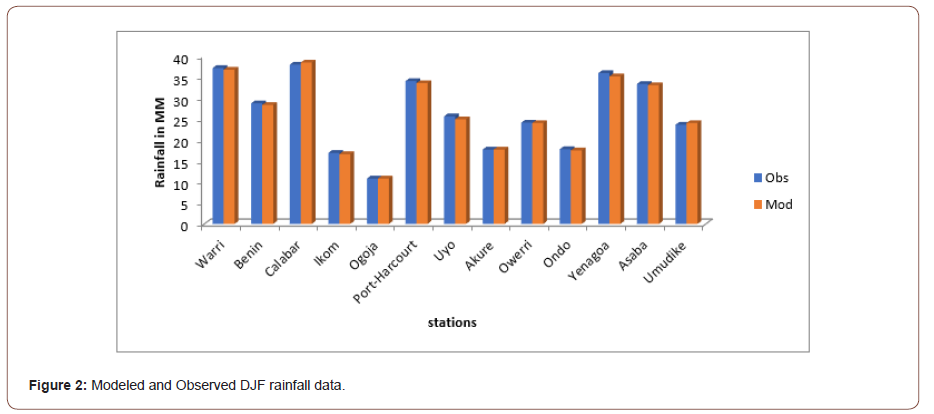
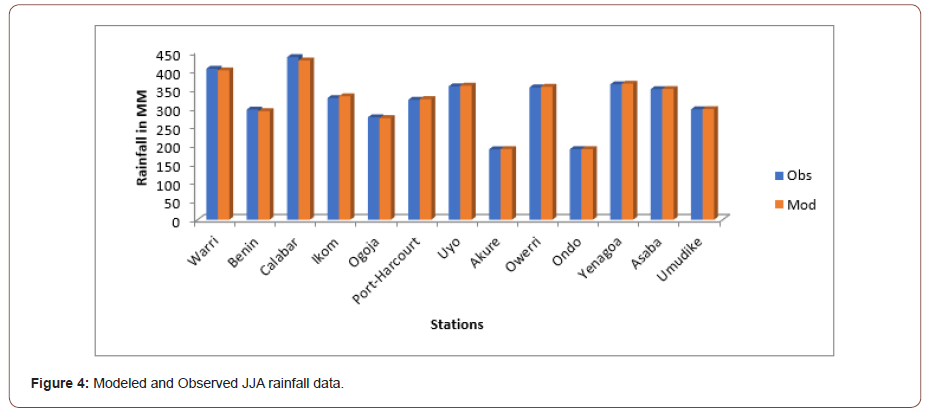
Table 4 shows the JJA (June, July, August) data for observed and simulated average rainfall record for the various meteorological stations for the period under review. From the values of the simulated and observed data reported in the table it suggests that the model sufficiently captures the local data characteristics for rainfall in the Niger Delta region implying therefore that the validation analysis presented in table 4 above can be sustained. Accordingly, it is obvious from the tabulated records that the observed and simulated data within the period of validation sufficiently matches. For instance, whereas Warri observed data is 403.7mm, the simulated for the same station is 399.5mm. Furthermore, the table also shows that Asaba, Akure and Umudike simulated data are 0.3mm, 0.6mm and 0.7mm higher than the observed. Similarly, other stations of the Niger Delta region within the JJA also report that the simulated data is slightly higher than the observed. For instance, Owerri, Yenagoa, Uyo, and Port Harcourt simulated data are 1.6mm, 1.7mm, 1.8mm and 1.9mm higher than the observed respectively whereas in the case of Ikom, it is 4.7mm. It is therefore revealing on account of the record presented in the above table that the simulated data significantly matches the observed data and captures the general pattern of rainfall for the Niger Delta region for the season of the year (Figure 4).
Table 4: JJA Observed and Modelled Rainfall Data for Niger Delta Region.

Table 5: SON Observed and Modelled Rainfall Data for Niger Delta Region.

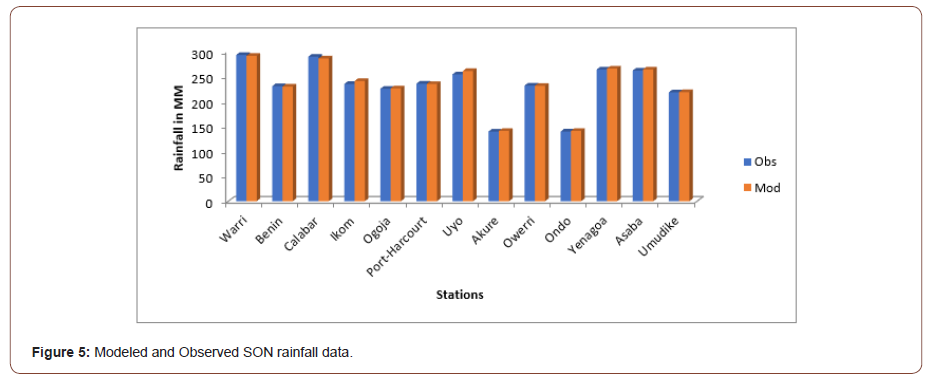
In Table 5 the SON observed and simulated average rainfall data for the various meteorological stations for the period under review are presented. From the values of the simulated and observed data reported in the table it suggests that the model sufficiently captures the local data characteristics for rainfall in the Niger Delta region implying therefore that the validation analysis presented in table 5 above can be sustained. Accordingly, it is obvious from the tabulated records that the observed and simulated data within the period of validation sufficiently matches. For instance, whereas Warri observed data is 292.2mm, the simulated for the same station is 290.5mm. In Ogoja the simulated data is 0.8mm higher than the observed, while the following stations Ondo, Akure, Umudike and Yenagoa the simulated data are 1.2mm, 1.3mm and 1.4mm and 1.9mm higher than the observed correspondingly. On the other hand, Asaba has 2.1mm higher in terms of the simulated against the observed while Ikom and Uyo record 5.8 and 6.7 higher than the observed, respectively. Therefore, against all odds the record presented in the above table sufficiently establish that the simulated data significantly matches the observed data and captures the general pattern of rainfall for the Niger Delta region for the season of the year (Figure 5).
Projections of rainfall characteristics for A2 and B2 Scenarios in the Niger Delta Region (2016-2045) (Figure 6): Figure 6 displays the rainfall amount for A2, B2 emission scenarios for Niger Delta region for the projected period (2016-2045) and for the DJF season. In the figure, under A2 emission scenario projections show that there will be higher increase in rainfall amount in the climate normal compared to the baseline period (1986-2015). From the A2, projection analysis as reveal in the figure, there will be increase in rainfall over the the Niger Delta region generally. Conversely, Uyo will have an increase in rainfall amount slightly above 8mm within the season while Yenagoa and Port Harcourt will be seriously affected with an increase in rainfall amount of more than 10mm indicating a positive departure from the baseline period. However, for the B2 scenario, the figure shows that there will be a reduction in rainfall in places Benin, Ogoja, Owerri, Ondo and Umudike compared to the baseline period (Figure 7).
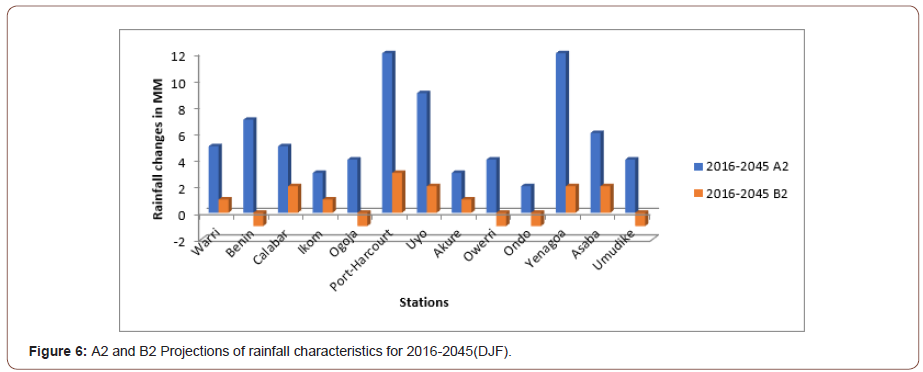
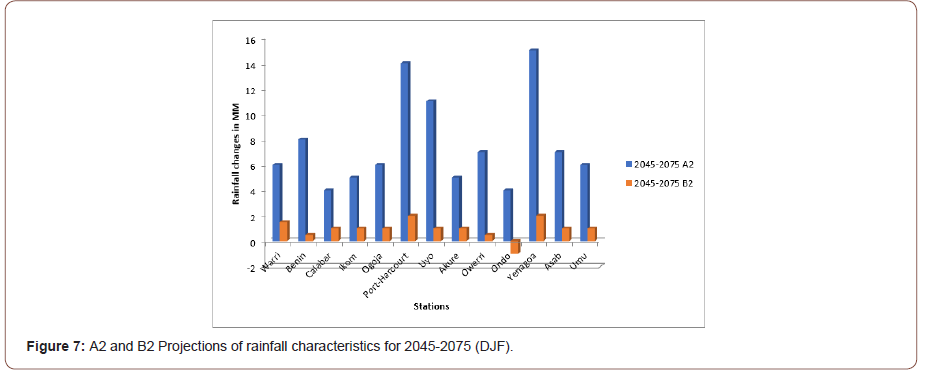
Figure 7 displays the rainfall amount for A2, B2 emission scenarios for Niger Delta region for the projected period (2045-2075) and for the DJF season. In the figure, under A2 emission scenario projections reveal that there will be higher increase in rainfall amount in the climate normal compared to the baseline period (1986-2015). From the A2 projection explanation as indicated in the above figure, the area will experience general increase in rainfall amounts. Nevertheless, Uyo will equally have an increase in rainfall amount slightly above 10mm within the season whereas Yenagoa and Port Harcourt are to experience an increase of more than 12mm in rainfall amount indicating a positive departure from the baseline period. On the other hand, for the B2 scenario, the figure also shows that increase in rainfall amount will continue over the region, but Ondo will experience a reduction in rainfall within the projected climate normal (Figure 8).
Figure 8 displays the rainfall amount for A2, B2 emission scenarios for Niger Delta region for the projected period (2016-2045) and for the MAM season. In the figure, under A2 emission scenario projections clearly show that there will be significant increase in rainfall amount in the indicated climate normal compared to the baseline period (1986-2015). The figure shows that Warri, Calabar and Uyo will have an increase in rainfall above 20mm within the season whereas Port Harcourt and Yenagoa will experience increase above 25mm respectively within the same season under the A2 scenario. Similarly, the figure also projects an increase in rainfall under the B2 scenario of the same season. The projection reveals an increase in rainfall amounts above 10mm for Warri and Calabar while Port Harcourt, Uyo and Yenagoa will have increase in rainfall above 15mm within the same period. From the figure the amounts of rainfall increase within the projected period under the A2 scenario is almost twice that of B2 in the affected areas. More importantly, it is apparent that under the two emission scenarios and within the MAM season, the Niger Delta region will experience general increase in rainfall amounts. This implies that within the period and the season, no reduction in rainfall amounts is projected under the specific emission scenarios considered in this study (Figure 9).
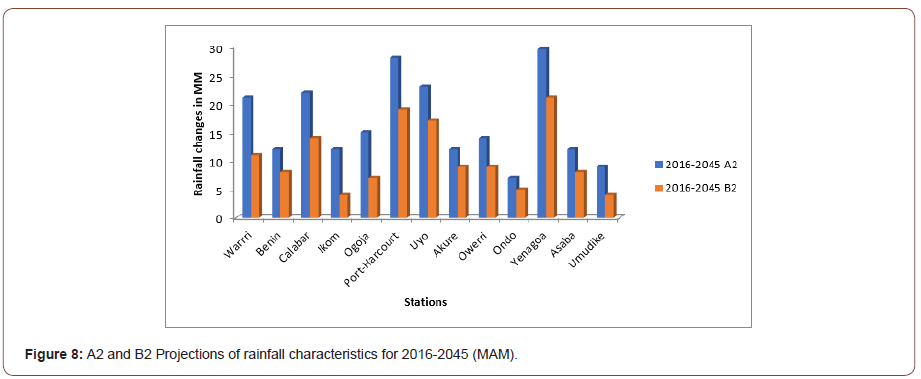
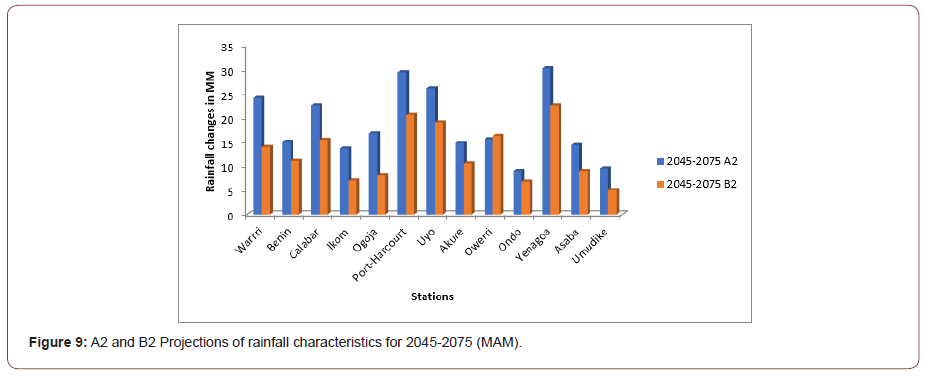
Figure 9 displays the rainfall amount for A2, B2 emission scenarios for the MAM season within the projected period (2045- 2075) for the Niger Delta region. The projections as displayed in the figure under A2 emission scenario clearly revealed that rainfall amount in the baseline period (1986-2015) will be ultimately lower than rainfall amount in the climate normal under review. The projections illustrated in the above figure proclaim that the region will have significant and steady increase in rainfall amount over the period. Furthermore, Benin, Ikom, Ogoja, Akure, Owerri and Asaba specifically will have an increase in rainfall amount above 10mm whereas that of Warri and Calabar will be above 20mm within the same season while the areas to be mostly affected under the A2 scenario are Port Harcourt, Uyo and Yenagoa where the projections show that increase in rainfall amounts will be above 25mm. Similarly, no reduction in rainfall amount is expected within the period as the result shown in the figure also account for increase in rainfall amount under the B2 scenario of the same season. However, places like Warri, Benin, Calabar, Port Harcourt, Uyo, Owerri and Yenagoa will have increase in rainfall amounts above 10mm for the same season. Therefore, increase in rainfall amounts within the season (MAM) and period (2045-2075) under the different emission scenarios (A2, B2) is a clear indication of positive departures from the baseline period (1986-2015) (Figure 10).
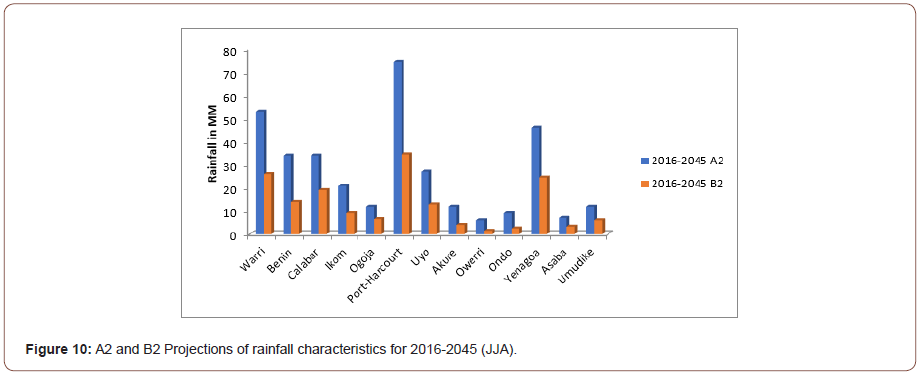
Projected Rainfall Characteristics for JJA (June, July, August) for A2 and B2 scenarios (2016-2045): Figure 10 displays the rainfall amount for the JJA (June, July August) season under A2, B2 emission scenarios for the projected period (2016-2045) in the Niger Delta region. The rainfall amount represented in the above figure under A2 emission scenario declares that there is significant departure of the climate normal in context from the baseline period (1986-2015) which visibly confirm that rainfall amount within the projected period is higher in comparison with the baseline. From the projections in the figure, Benin and Calabar will have an increase in rainfall amount above 30mm; that of Yenagoa will be above 40mm while Warri will have an increase in rainfall amount above 50mm within the season. On the other hand, Port Harcourt is projected to experience an outstanding increase above 70mm within the same season under the A2 scenario. In a related development, the projections do not demonstrate any reduction in rainfall amount under the different emission scenarios within the projected period as increase in rainfall amounts under the B2 scenario of the same season is visually clear from the illustrative diagram. However, only places like Warri, Port Harcourt and Yenagoa under the B2 scenario are projected to have significant increase in rainfall amounts above 20mm for the same season. Thus, the projected increase in rainfall amounts within the season (JJA) and period (2016-2045) under the different emission scenarios (A2, B2) remarkably declares departures from the baseline period under review (Figure 11).
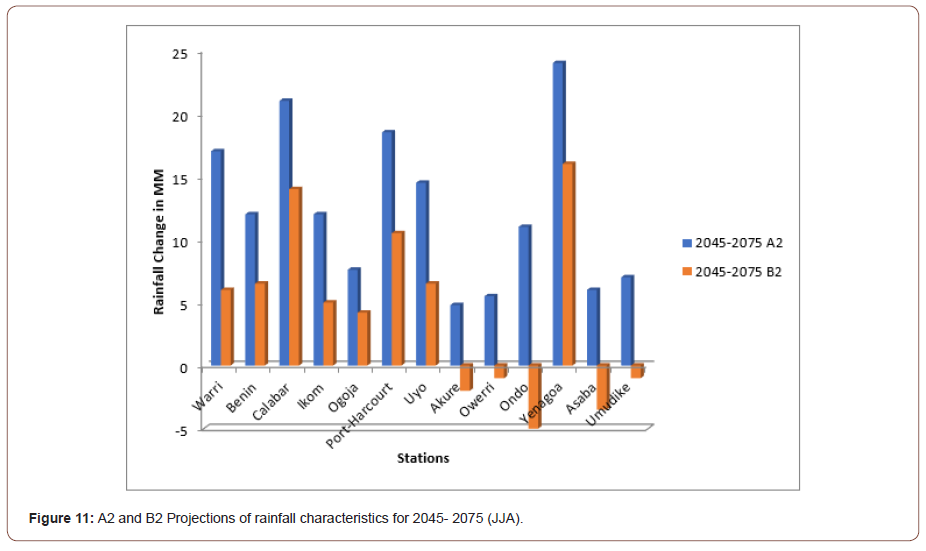
Displayed in Figure 11 above, is the rainfall amounts for the JJA season under the different emission scenarios (A2, B2) for the Niger Delta region for the projected period (2045- 2075). The revealing projections in the figure under the A2 emission scenario show that there will be higher increase in amounts of rainfall in the climate normal compared to the baseline period (1986-2015). However, while the following stations: Benin, Ikom, Uyo and Ondo are to be affected with more than 10mm increase in rainfall amounts, Warri and Port Harcourt will experience increase in rainfall amounts above 15mm and outstandingly as identified in the figure under reference Calabar and Yenagoa will experience the highest increase in rainfall amounts which is above 20mm indicating a positive departure from the baseline period. However, while increase in rainfall amounts of above 10mm is expected to affect Calabar, Port Harcourt and Yenagoa under the B2 scenario, the projection shown in the figure also establishes a reduction in rainfall amounts under the B2 scenario within the same period and season. The projected reduction in rainfall amounts within the season (JJA) and period (2045- 2075) under the B2 emission scenario will affect places like; Akure, Owerri, Ondo, Asaba and Umudike within the Niger Delta region. This is an expression of an indication of negative departures from the baseline period (Figure 12).
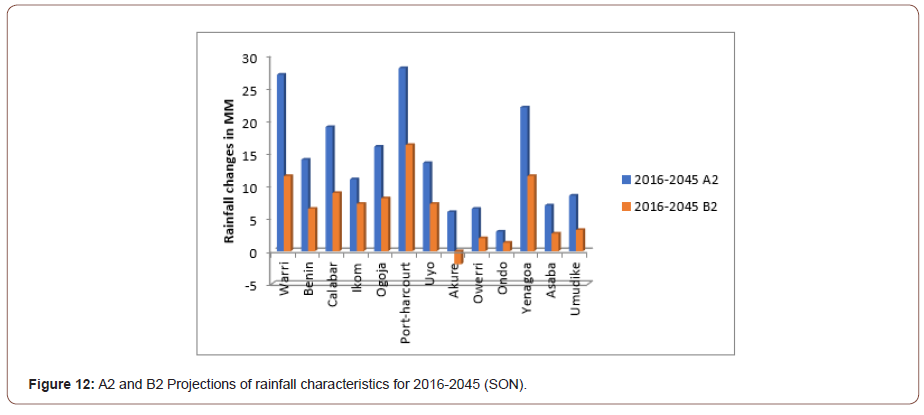
Projected Rainfall Characteristics for SON (September, October, November) (2016-2045): Figure 12 shows the rainfall amounts for the different emission scenarios (A2, B2) for the SON season in the Niger Delta region for the projected period (2016- 2045). The figure analytically displays the rainfall projections of the SON season under A2 emission scenario with observable evidence of higher increase in rainfall amount in the climate normal. In contrast, the foregoing therefore suggests that there is sharp deviation from the baseline period (1986-2015). The figure projects that Benin, Ikom, Ogoja and Uyo will have an increase in rainfall amounts above 10mm within the season whereas Warri, Port Harcourt and Yenagoa are projected to experience an increase in rainfall amounts of more than 20mm under the A2 emission scenario in the SON season. However, while the following places: Warri, Port Harcourt and Yenagoa are also to be affected with more than 10mm increase in rainfall under the B2 scenario, the projection visibly reveals that Akure will experience a reduction in rainfall amounts within the season and period (Figure 13).
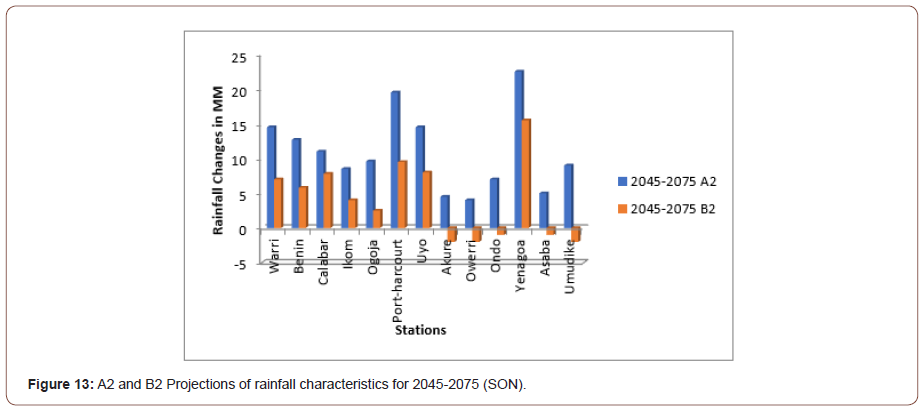
The projections presented in Figure 13 is the rainfall amount for A2, B2 emission scenarios for Niger Delta region for the SON season and for the projected period (2045-2075). Distinctively, the A2 emission scenario in the figure demonstrates a general increase in rainfall amounts over the region in the climate normal compared to the baseline period (1986-2015). Irrespective of the general increase in rainfall amount so projected as asserted from the figure, it is further projected that Warri, Benin, Calabar, and Uyo will have an increase in rainfall amounts above 10mm within the season, whereas Port Harcourt and Yenagoa will have higher increase in rainfall amount within the range of 20mm and above under the A2 emission scenario in the SON season. However, while there will be steady and constant increase in rainfall amounts in some places under B2 scenario as averred by the figure above; Yenagoa specifically is projected to have significant increase in rainfall amounts of more than 10mm. Similarly, under the B2 scenario the projection revealed a reduction in rainfall amounts in Akure, Owerri, Ondo, Asaba and Umudike areas of the Niger Delta region.
Summary
Generally, the rainfall amounts expressed in this study are basically for two emission scenarios (A2, B2) and for four seasons (DJF, MAM, JJA and SON). The projection reveals that Yenagoa and Port Harcourt are areas that will have an increase in rainfall amounts of more than 10mm under A2 scenario in DJF within the first climate normal (2016-2045) and the increase is further expected to step up to above 12mm within the next climate normal (2045-2075) while under the B2 scenario the projection reveal a decline in rainfall amounts within Benin, Ogoja, Owerri, Ondo and Umudike within the first climate normal (2016-2045) while Ondo is projected to experience a decline within the next climate normal (2045-2075) in DJF. In MAM in both the first and second climate normals under the two emission scenarios (A2, B2), there is constant, steady, and significant increase in rainfall amounts over the region. More specifically, Warri, Calabar, Port Harcourt, Uyo and Yenagoa is projected to experience an increase in rainfall amounts of more than 20mm under the A2 scenario in the first and second climate normals while on the other hand, under the B2 scenario the projection reveal that an increase in rainfall amounts of more than 10mm will affect Warri, Calabar, Port Harcourt, Uyo, Owerri and Yenagoa in the second climate normals while all the cities are also affected except Owerri in the first climate normal. Generally, under emission scenarios, A2 and B2 only cities like Ikom, Ondo and Umudike are projected to have extremely low increase in rainfall amount within the MAM season of the climate normals.
In the JJA season of the first climate normal the projection reveal an increase in rainfall amounts of more than 30mm in Warri, Benin, Calabar, Port Harcourt and Yenagoa under A2 scenario and Warri, Port Harcourt and Yenagoa to be affected by an increase in rainfall amounts of more than 20mm under the B2 scenario of the first climate normal while in the A2 scenario of the second normal Warri, Calabar, Port Harcourt and Yenagoa is projected to have an increase in rainfall amounts of above 15mm and increase of above 10mm in rainfall amounts under the B2 scenario at Calabar, Port Harcourt and Yenagoa. However, a decline in rainfall amounts is also projected under the B2 scenario in the second climate normal (2045-2075) in Akure, Owerri, Ondo, Asaba and Umudike. The SON season of the projection period shows that Warri, Port Harcourt and Yenagoa will experience more than 20mm increase in rainfall amounts under A2 and and more than 10mm in rainfall amounts under B2 scenarios respectively in the first climate normal. While an increase of more than 15mm in rainfall amounts is expected to affect Port Harcourt and Yenagoa under the A2 scenario, Yenagoa will also experience an increase of more than 10mm in rainfall amounts under the B2 scenario in the second climate normal (2045-2075). Also, a reduction in rainfall amount projected under the B2 scenario is expected to affect Akure, Owerri, Ondo, Asaba and Umudike in the second climate normal (2045-2075). In the SON season under the B2 scenario Akure is also projected to have a decline in rainfall amounts in the first climate normal (2016-2045).
It is observable from the projections that the Niger Delta region will experience a constant increase in rainfall amounts under the A2, B2 emission scenarios in the two climate normals across the seasons. However, a decline is projected and expected to be visible under the B2 scenario only in JJA and SON seasons at Akure, Owerri, Ondo, Asaba and Umudike areas of the Niger Delta region in the second climate normal (2045-2075) while Benin, Ogoja, Owerri, Ondo and Umudike still under the B2 scenario will experience its decline in the DJF of the first climate normal (2016-2045). Nevertheless, in the second climate normal (2045-2075) and under the B2 scenario Ondo is projected to experience a decline in the DJF rainfall. As a matter of fact, an increase in rainfall amounts is projected across the cities in the Niger Delta region under the two emission scenarios A2, B2. Warri, Calabar and Uyo are projected to experience increase in rainfall amounts of more than 20mm while Port Harcourt and Yenagoa will experience increase in rainfall amounts of more than 25mm under A2 in the first and second climate normals in the MAM season whereas Warri, Calabar, Port Harcourt and Yenagoa are projected to be mostly affected in the MAM and JJA seasons having tremendous increase in rainfall amounts for the two climate normals (2016-2045, 2045-2075) under the A2, B2 scenarios. On the other hand, Warri, Port Harcourt and Yenagoa to increase in MAM, JJA and SON under A2, B2 scenario in the first climate normal (2016-2045) while Port Harcourt and Yenagoa among all the cities are projected to have an increase in rainfall amounts in all the seasons (DJF, MAM, JJA and SON) and under the two emission scenarios, A2, B2 within the projected climate normals. The projections reveal that there will be a reduction in rainfall in Ondo in DJF season under the B2 scenarios and in the second climate normal while there will also be a reduction in rainfall in Benin, Ogoja, Owerri and Umudike in the first climate normal under the B2scenario whereas in Akure, Owerri, Ondo, Asaba and Umudike the decline is expected to occur under the B2 scenario in JJA and SON of the second climate normal (2045-2075). Also, Akure will experience a reduction in rainfall in 2016-2045 under A2 scenario. This implies that apart from the cities mentioned where there will be reduction in rainfall within the projected periods; continuous, steady, and significant increase in rainfall will be experienced and therefore characterize the pattern and condition of rainfall in the Niger Delta region within the two climate normals across the region particularly within the projected period of this study.
Acknowledgement
None.
Conflict of Interest
No conflict of interest.
References
- Hansen J, Ruedy R, Sato M, Lo K (2010) Global surface temperature change. Reviews of Geophysics 48: RG4004.
- Intergovernmental Panel on Climate Change (2013) Climate Change 2013: The Physical Science Basis. Working Group I Contribution to the Fifth Assessment Report of the Intergovernmental Panel on Climate Change. Cambridge University Press, UK&USA.
- Reiter A, Weidinger R, Mauser W (2012) Recent climate change at the upper Danube-a temporal and spatial analysis of temperature and precipitation time series. Climatic Change 111: 665-696.
- Diaz HF, Trigo R, Hughes MK, Mann ME, Xoplaki E, et al. (2011) Spatial and temporal characteristics of climate in medieval times revisited. American Meteorological Society 92: 1487-1500.
- Anisimov O, Kokorev V, Zhiltsova Y (2013) Temporal and spatial patterns of modern climatic warming: case study of Northern Eurasia. Climatic Change 118: 871-883.
- Duncan JMA, Dash J, Atkinson PM (2013) Analyzing temporal trends in the Indian summer monsoon and its variability at a fine spatial resolution. Climatic Change 117: 119-131.
- Shi W, Tao F, Liu J, Xu X, Kuang W, et al. (2014) Has climate change driven spatio-temporal changes of cropland in northern China since the 1970s? Climatic Change 124: 163-177.
- Allen M, Ingram W (2002) Constraints on future changes in climate and the hydrologic cycle. Nature 419(6903): 224-232.
- Karl TR, Knight RW (1998) Secular trends of precipitation amount, frequency, and intensity in the United States. Bulletin of the American Meteorological Society 79: 231-241.
- Schmidli J, Frei C (2005) Trends of heavy precipitation and wet and dry spells in Switzerland during the 20th century. International Journal Climatology 25: 753-771.
- Sun Y, Solomon S, Dai A, Portman RW (2006) How often does It rain. Journal of Climate 19: 916-934.
- Afangideh A, Okpiliya E, Eja E (2010) A preliminary investigation into the Annual Rainfall Trend and Patterns for Selected Towns in Parts of - South-Eastern Nigeria. Journal of Sustainable Development 3(3): 143-176.
- Ayoade JO (2004) Introduction to climatology for the tropics. Spectrum books, Nigeria.
- Ogallo LA (1980) Time series analysis of rainfall in East Africa. PhD Thesis, Dept of Met.
- Chu JT, Xia J, Xu CY, Singh VP (2010) Statistical downscaling of daily mean temperature, pan evaporation and precipitation for climate change scenarios in Haihe River, China. Theoretical and Applied Climatology 99(1-2): 149-161.
- Huang C, Barnett AGX, Wang X, Vaneckova P, Fitz Gerald G, et al. (2011) Projecting future Heat-related mortality under climate change scenarios: a systematic review. Environmental Health Perspectives 119: 1681-1690.
- Mahmood R, Babel MS (2013) Evaluation of SDSM developed by annual and monthly Sub-models for downscaling temperature and precipitation in the Jhelum Basin, Pakistan, and India. Theoretical and Applied Climatology 113: 27-44.
- Wilby RL, Wigley TML (1997) Downscaling general circulation model output: A review of methods and limitations. Programme Physical Geography 21(4): 530-548.
- Gellens D, Roulin E (1998) Streamflow response of Belgian catchments to IPCC climate change scenarios. Journal of Hydrology 210(1-4): 242- 258.
- Wilby RL, Hay LE, Leavesley GH (1999) A comparison of downscaled and raw GCM output: implications for climate change scenarios in the San Juan River Basin, Colorado. Journal of Hydrology 225(1-2): 67-91.
- Wilby RL, Harris I (2006) A framework for assessing uncertainties in climate change impacts: low-flow scenarios. Water Resources Research 42(2): W02419.
- Li X, Sailor D (2000) Application of tree-structured regression for regional precipitation prediction using general circulation model output. Climate Research 16(1): 17-30.
- Huth R (2002) Statistical downscaling of daily temperature in Central Europe. Journal of Climatology 15(13): 1731-1742.
- Hay LE, Clark MP (2003) Use of statistically and dynamically downscaled atmospheric Model out-put for hydrologic simulations in three mountainous basins in the western United States. Journal of Hydrology 282(1-4): 56-75.
- Diaz Nieto J, Wilby RL (2005) A comparison of statistical downscaling and climate change factor methods: impacts on low flows in the River Thames, United Kingdom. Clim Chang 69(2): 245-268.
- Salzmann N, Frei C, Vidale PL, Hoelzle M (2007) The application of Regional Climate Model output for the simulation of high-mountain permafrost scenarios. Global Planet Change 56(1-2): 188-202.
- Wang J, Zhang X (2008) Downscaling and projection of winter extreme daily precipitation over North America. Journal of Climate, 21(5):923-937.
- Woloszyn E (2009) Analysis of Rainfall Data of Gdańsk Meteorological Station. International Symposium on Water Management and Hydraulic Engineering Ohrid/Macedonia
- Yang W, Bardossy A, Caspary HJ (2010) Downscaling daily precipitation time series using a combined circulation and regression-based approach. Theoretical & Applied Climatology 102(3-4): 439-454.
- Sunyer MA, Madsen H, Ang PH (2011) A comparison of different regional climate models and statistical downscaling methods for extreme rainfall estimation under climate change. Atmospheric Research 103: 119-128.
- Huang C, Barnett AGX, Wang X, Vaneckova P, FitzGerald G, et al. (2011) Projecting future Heat-related mortality under climate change scenarios: a systematic review. Environ Health Perspect 119: 1681-1690.
- Mahmood R, Babel MS (2012) Evaluation of SDSM developed by annual and monthly sub-Models for downscaling temperature and precipitation in the Jhelum basin, Pakistan, and India. Theoretical and Applied Climatology 113: 27-44.
- Wetterhall FA, Bárdossy D, Chen SH, Xu CY (2006) Daily precipitation-downscaling techniques in three Chinese regions. Water Resources Research 42(aa): W11423.
- Sharma D, Das Gupta A, Babel MS (2007) Spatial disaggregation of bias corrected GCM precipitation for improved hydrologic simulation: Ping River Basin, Thailand. Hydrologic Earth System Science 4: 35-74.
- Akhtar M, Ahmad N, Booij MJ (2008) The impact of climate change on the water resources of Hindukush-Karakorum-Himalaya region under different glacier coverage scenarios. Journal of Hydrology 355(1-4): 148-163.
- Elshamy ME, Seierstad IA, Sorteberg A (2009) Impacts of climate change on Blue Nile flows using bias corrected GCM scenarios. Hydrology and Earth System Science 13: 551-565.
- Kannan S, Ghosh S (2011) Prediction of daily rainfall state in a river basin using statistical Downscaling from GCM output. Stoch Env Res Risk A 25(4): 457-474.
- Souvignet M, Heinrich J (2011) Statistical downscaling in the arid central Andes: uncertainty analysis of multi-model simulated temperature and precipitation. Theoretical and Applied Climatology 106: 229.
- Omotosho JB, Abiodun BJ (2007) A numerical study of moisture build-up and rainfall over West Africa. Applied Meteorology 14: 209-225.
- Parry ML, Canziani OF, Palutikof JP, Van der Linden PJ, Hanson CE (2007) Impacts, Adaptation and Vulnerability. Contribution of Working Group II to the Fourth Assessment Report of the Intergovernmental Panel on Climate Change Cambridge University Press Cambridge UK 2007.
- Akinsanola AA, Ogunjobi KO (2015) Recent Homogeneity Analysis and Long Term Spatio-temporal Rainfall Trends in Nigeria. Theoretical and Applied Climatology 128: 275–289.
- Akinsanola AA, Ogunjobi KO, Gbode IE, Ajayi VO (2015) Assessing the capabilities of three regional climate models over CORDEX Africa in simulating West African summer monsoon precipitation. Advance Meteorology.
- Hewitson BC, Crane RG (2006) Consensus between GCM climate change projections with empirical downscaling: precipitation downscaling over South Africa. International Journal of Climatology 26(10): 1315-1337.
- Sylla MB, Gaye AT, Jenkins GS, Pal JS, Giorgi F (2010) Consistency of projected drought over the Sahel with changes in the monsoon circulation and extremes in a regional climate model projection. Journal of Geophysical Research 115: D16108.
- Abiodun BJ, Salami AT, Mathew OJ, Odedokun OD (2012) Potential impacts of afforestation on climate change and extreme events in Nigeria. Climate Dynamics 41(2): 277-293.
- Patricola CM, Cook KH (2009) Northern African climate at the end of the twenty-first century: an integrated application of regional and global climate models. Climate Dynamics 35: 193-212.
- Patricola CM, Cook KH (2010) Sub-Saharan Northern African climate at the end of the twenty- first century: forcing factors and climate change processes. Climate Dynamics 45: 4-12.
- Ayoade JO (2004) Introduction to climatology for the tropics. Spectrum books, Lagos, Nigeria.
- Ayoade JO (1970) Rain gauge networks and the areal extension of rainfall records. Department of Geography, University of London Occasional Papers 10- 15.
- Ayoade JO (1974) A Statistical Analysis of Rainfall over Nigeria. Journal of Tropical Geography 39: 11-23.
- Efe and Eyefia (2013)
- Mahmood R, Babel MS (2013) Evaluation of SDSM developed by annual and monthly Sub-models for downscaling temperature and precipitation in the Jhelum Basin, Pakistan, and India. Theoretical and Applied Climatology 113: 27-44.
- Wilby RL, Dawson CW, Barrow, E.M (2002) SDSM—a decision support tool for the assessment of regional climate change impacts. Environment Modell Software 17(2): 145-157.
- Wilby RL, Hay LE, Gutowski WJ, Arritt RW, Takle ES, et al. (2000) Hydrological responses to dynamically and statistically downscaled climate model output. Geophysical Research Letters 27: 1199- 1202.
- Wilby RL, Dawson CW, Barrow EM (2002) SDSM—a decision support tool for the assessment of regional climate change impacts. Environment Modell Software 17(2): 145-157.
- Wilby RL, Dawson CW, Barrow EM (2013) The statistical down scaling model: Insights from one decade of application. International Journal of Climatology 33: 1707-1719.
- Awosika LF (1995) Impacts of global climate change and sea level rise on Coastal resources and energy development in Nigeria. In: Umolu JC (edr), Global Climate Change: Impact on Energy Development. DAMTECH Nigeria Limited, Nigeria.
- Civil Liberties Organization (2002) Blood Trail: Repression and Resistance in the Niger Delta, Ikeja.
- Iyayi F (2004) An integrated approach to development in the Niger Delta. A paper prepared for the Centre for Democracy and Development (CDD).
- Awosika LF (1995) Impacts of global climate change and sea level rise on Coastal resources and energy development in Nigeria. In: Umolu JC (edr), Global Climate Change: Impact on Energy Development. DAMTECH Nigeria Limited, Nigeria.
- Anyadike RNC (1992) Regional Variations in Fluctuations of Seasonal Rainfall over Nigeria. Theor Appl Climatol 45: 285-292.
- Wu P, Christidis N, Stott P (2013) Anthropogenic impact on Earth’s hydrological cycle. Nature 3(9): 807-810.
- Fontaine B, Trzaska S, Janicot S (1998) Evolution of the relationship between near global and Atlantic SST modes and the rainy season in West Africa: statistical analyses and sensitivity experiments. Climate Dynamics 14(5): 353-368.
- Druyan LM, Feng J, Cook KH, Xue Y, Fulakeza M, et al. (2010) The WAMME regional model intercomparison study. Climate Dynamics 35(1): 175-192.
- Willett KM, Jones PD, Thorne PW, Gillett NP (2010), A comparison of large-scale changes in surface humidity over land in observations and CMIP3 GCMs, Environment Research Letters, 5:
- Weli VE, Efe SI (2015) Climate change and Epidemiology of Malaria in Port Harcourt Region, Nigeria. American Journal of Climate Change 4(1): 40-47.
-
Kpang MBT, Weli VE, Okwapkpam I. Rainfall Projection Using Different Emission Scenarios for Two Climatic Normals in the Niger Delta Region of Nigeria (2016-2045 and 2045-2075). Adv in Hydro & Meteorol. 1(1): 2021. AHM.MS.ID.000501.
-
Environmental restrictions, Construction, Material, Building Information Modeling, Drone equipment, 3D Printing, Network Connectivity
-

This work is licensed under a Creative Commons Attribution-NonCommercial 4.0 International License.


