


 Research Article
Diurnal, Seasonal, and Inter-Annual Characterization of Water Fluxes in a Bottomland Hardwood Forest in the Southeastern United States
Received Date: January 22, 2026; Published Date: February 23, 2026
Abstract
Bottomland Hardwood Forests (BHFs) play a crucial role in regulating regional climate and hydrology. With increasing impacts of climate change on forests globally, it is important to understand the water dynamics of inland hardwood forested systems, such as the ones in the Lower Mississippi Alluvial Valley (LMAV), that are characterized by prolonged seasonal inundations. Water and heat flux data were obtained from a BHF located in the Russel Sage Wildlife Management Area (RSWMA), in northeast Louisiana. Latent heat energy (LE) data from 2014 to 2021 measured at the US-ULM carbon flux tower (37 m) were used to characterize the temporal variability of water fluxes in this BHF. The mean daily ET values differed significantly (p<0.001) between the lowest 1.78 (± 0.39) mm/day in winter to the highest 5.01 (±0.63) mm/day in mid-summer. Similarly, mean spring ET of 3.19 (±0.36) mm/day was similar to the mean autumn ET at 3.19 (± 0.49) mm/day. The diurnal variations of ET in all seasons were consistent with those of net radiation, except in winter where ET variability was less predictable due to highly variable weather conditions. ET was observed to be mainly influenced by net radiation in conjunction with vegetation development during growing season and available energy during non-growing season. These results are helpful in improving our understanding of hydrological and energy budgets and will contribute to develop more accurate water flux models for the region including the contribution of ephemerally flooded forested wetlands, a critical but understudied ecosystem.
Keywords: Bottomland Hardwood Forests; evapotranspiration; sensible heat flux; Eddy covariance; Lower Mississippi Alluvial Valley
Introduction
Bottomland Hardwood Forests (BHFs) are deciduous forested wetlands located in broad floodplain areas bordering large river systems such as within the Lower Mississippi Alluvial Valley (LMAV), in the central and southeastern United States [1]. Ecosystem services provided by BHFs, including water quality regulation, flood control, wildlife habitat, timber production, and disturbance resiliency, and climate moderation through carbon balance, are of global importance [2,3]. Like other wetland types, a hydrological regime of alternating wet and dry cycles driven by fluctuating water levels of the associated rivers and groundwater level changes is characteristic of BHFs [4,5]. The health and sustainability of BHFs depends primarily on the longitudinal (upstream to downstream), lateral (river to floodplain to uplands and vice-versa), vertical (surface water to groundwater and vice versa), and temporal (seasonal and annual flooding) variability of water availability [6]. The primary factor controlling the biota in BHFs is the flooding pulse from adjacent water sources which deposit dissolved nutrients, organic matter, and sediment, and contributing to the formation of young floodplains with successive flooding event [7].
Even small changes in duration and frequency of water levels can result in a distinct shift in the plant community as many species are adapted to a certain range of flood tolerance [5]. Therefore, a deeper understanding of the water use pattern and surface energy balance in these BHFs is crucial to preserving this ecosystem. The study of BHF water flux remains incomplete without the assessment of factors that are integral to the proper functioning of these forests – evapotranspiration (ET), flood regimes, and precipitation [8,9]. The process of ET fundamentally requires sufficient energy from net radiation (Rn) to evaporate a certain amount of water. The dissipation of total Rn into different elements of surface heat balance is approximated by the equation:
Rn ≈ LE + H +G (1)
where LE is the latent heat flux, H is the sensible heat flux and G is the ground heat flux [10].
High soil moisture, greater leaf area index (LAI) during the growing season, and surface roughness contribute to the higher rates of ET from forests compared to open water surfaces [11,12]. ET in BHF comprises evaporation from the water surface, soil, transpiration from forest canopy. ET has been reported as a major component of BHF’s water balance in a number of studies along with LE (heat energy equivalent to ET) dominating the surface heat balance [13]. Therefore, ET and surface heat balance studies are important to assess water use patterns in a BHF ecosystem that is characterized by alternating periods of inundation and dryness.
Direct ET measurements are made by micrometeorological methods based on Bowen Ratio [14-16]. Due to the advantage of vertical water flux measurements by the Eddy Covariance (EC) method covering a fetch of 200-300 m radius from the sensor, it has gained popularity in the last couple of decades [10,17]. EC flux towers are typically equipped with an Infrared Gas Analyzer and Sonic Anemometer (IRGASON) and a suite of other sensors that collect data on physiological and ecological processes such as vegetation, hydrology, as well as meteorological characteristics. The open-path IRGASON consists of a light source and a detector which make high-frequency in-situ gas measurements where the flux density is affected by ambient temperature and pressure. Assuming no transpiration occurs at nighttime, most of studies present only the diurnal patterns of ET in relation to the meteorological conditions [18,19], along with the leaf characteristics and various surface resistance factors [12,20].
However, a substantial nighttime ET accounting for up to 30% of the total daily ET have been reported in temperate deciduous forest [21], oak- grassland savanna [22], mixed hardwood forest [23] that share similar vegetation and climate characteristics with BHFs. Thus, it is important to quantify the contribution of nighttime ET to total ET which can have important implications for plant water relations research. The rate of ET varies across various vegetation, climate, and hydrology, which not only suggests the dynamics of water use patterns across different biogeographical regions but also informs the planning of hydrological budget in the given region. For e.g., the mean ET rate of 2.2 mm/day was reported for a reed wetland in a warm and temperate region in China [24] while much higher ET rates of 8 mm/day was recorded in freshwater wetland in semi-arid central Spain [25]. Similarly, a mean ET rate of 3.9 mm/day was reported by Drexler et al. [26] for a marsh in semi-arid climate in California, USA. These differences in water use patterns despite commonality in ecosystems suggest a need for separate ecosystem-specific water budget plannings.
This paper aims to characterize water fluxes in a mature BHF in the LMAV in northeast Louisiana. This study is unique in several notable ways. To begin with, it is the first report of water fluxes in a mature BHF in Russel Sage Wildlife Management Area (RSWMA) representative of floodplain hardwood forests in the LMAV, thus, fills in a data-gap to better understand water fluxes from these unique hardwood wetlands. The availability of highresolution data will help determine the contribution of these unique forested ecosystems in maintaining the water balance in the region. Second, the long-term trends and patterns presented here will help improve water flux models, representative of the region and by extension, the nation. Third, the need is further accentuated by an unprecedented loss of these forests (from 101,000 km2 in the LMAV in 1920s to only 21,000 km2 in 2010s), especially in light of climate change [27]. The loss of these forests is associated with the loss of several ecosystem services, such as habitat for diverse flora and fauna, upland protection from flood and hurricanes, storage of carbon, recreation, and purification of water [28]. The objective of this study was to quantify and characterize diurnal, seasonal, and inter-annual water fluxes in a BHF.
Methods
Site
Data for this study was collected at the RSWMA (Figure 1) in Northeast Louisiana (32.46°N, -91.97°E; elevation 18 m ASL), managed by the Louisiana Department of Wildlife and Fisheries (LDWF). The site is located within the Bayou Lafourche floodplain and is subjected to annual late winter (December-February) to early spring (March-May) flooding. It currently covers an area of 38,213 acres with mature hardwood stands that vary in age from 90-120 years (perscomm Larry Savage, LDWF). The broadleaved deciduous forest canopy consists of co-dominant canopy species overcup oak (Quercus Walter) and water hickory (Carya aquatica (F. Michx.) Elliott), along with other canopy species such as green ash (Fraxinus pennsylvanica Marsh.), and sugarberry (Celtis laevigata Willd.) in the poorly drained soil [5]. In the first bottoms on low ridges, flats and sloughs, American elm (Ulmus americana L.), sweetgum (Liquidamber styraciflua), winged elm (Ulmus alata Michx.), and red maple (Acer rubrum L.) are abundant.
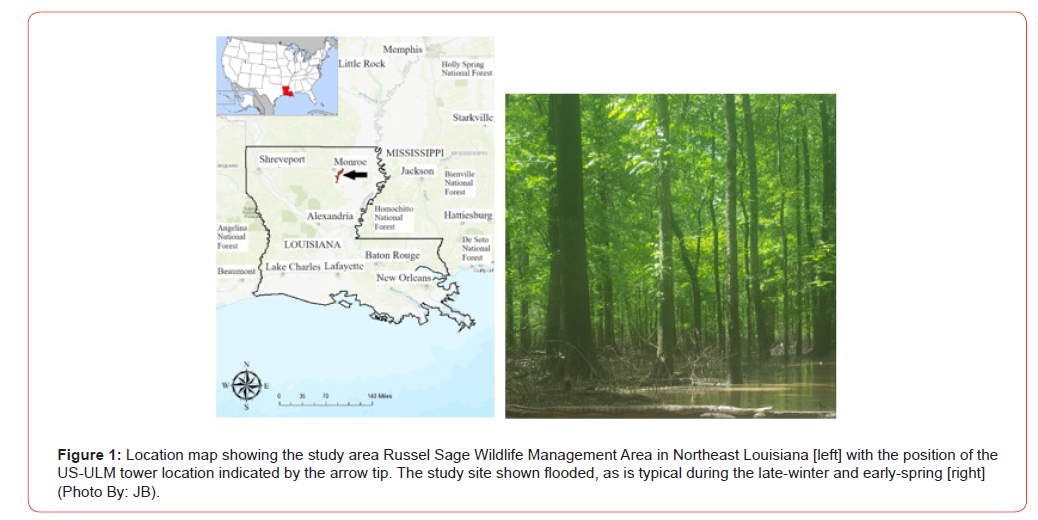
In the newly formed sandbars on river margins, black willow (Salix nigra Marshall), cottonwood (Populus deltoides W. Bartram ex Marshall), river birch (Betula nigra L.), american sycamore (Platanus occidentalis L.) are prominent. The well-drained bottom ridges were dominated by sweetgum and water oak (Quercus nigra L.) characteristic species of BHF of the LMAV. The canopy is relatively flat with a mean tree height of 27m. The Leaf Area Index (LAI) of the forested area, derived from Moderate Resolution Imaging Spectroradiometer (MODIS) instrument-based observations, was below one throughout the winter season, and on average reached a maximum of 6.53 in July. The soil type is Perry Clay, fine-textured sediment that has low permeability and a moderate capacity to hold water [17].
Measurements of above-canopy fluxes
The EC technique was used to measure the amount of water vapor exchanged between the atmosphere and the forest. The wind components, sonic temperature, and gas concentrations were collected at 10 Hz frequency using an open-path IRGASON (Campbell Scientific Inc., USA). The EC system was mounted 12 m above the forest canopy and was directed towards the southwest, prevailing wind direction at the site. The fetch of the tower is 2 km.
Measurements of meteorological, phenological, and hydrological Variables
Other measurements, relevant to land-plant-atmosphere interactions, were obtained from the tower to understand how they affect the hydro-dynamics at the study site. The meteorological measurements include air temperature, precipitation, wind speed and direction, barometric pressure, and relative humidity. Vapor Pressure Deficit (VPD) was calculated as the difference between saturated and actual vapor pressures at the given temperature, based on the relative humidity and air temperature data. A net radiometer (NR-LITE2, Campbell Scientific Inc., USA) was used to measure the difference between the incoming and outgoing radiation at the site. A photosynthetically active radiation (PAR) sensor (LI190SB QUANTUM SENSOR, Campbell Scientific Inc., USA) was used to quantify the photosynthetic photon flux density (PPFD). Precipitation was measured by a tipping bucket rain gauge (TE525, Campbell Scientific Inc., USA).
Data collection, processing, and gap-filling fluxes
All data were acquired using a solid-state data logger (CR3000, Campbell Scientific Inc., USA). The unprocessed data were screened for quality control using LoggerNet, EddyPro, TOVI, and REddyProc R packages [29]. To determine the periods of low mixing, which can lead to underestimation of water and heat fluxes, the frictional velocity (u*) threshold was calculated using the Moving Point Test approach in TOV [30]. Further quality control screening was carried out to remove data outside the u* threshold value (0.4 m/s). Data recorded from 1 January 2014 to 31 December 2021 were used in this analysis. Small gaps (<2 h) due to lower quality data were gap-filled using the Marginal Distribution Sampling Technique [29] using the R package, REddyProc. Meteorological data from a nearby meteorological station (Monroe Airport – MLU) and NASA’s Prediction of Worldwide Energy Resources (POWER) database were used for gap-filling temperature and precipitation data when necessary. However, missing data were not able to be compensated for during long periods (2014 Oct 01 – 2015 Jan 03, 2015 Jun 09 – 2015 Oct 03, 2018 Oct 30 – 2021 Jan 28) due to all data missing. The gap-filled data accounted for less than 20% of the whole EC data. The water losses associated with ET were quantified by the conversion of LE values from (W/m2) to mm/day [10].
Results
Micrometeorology
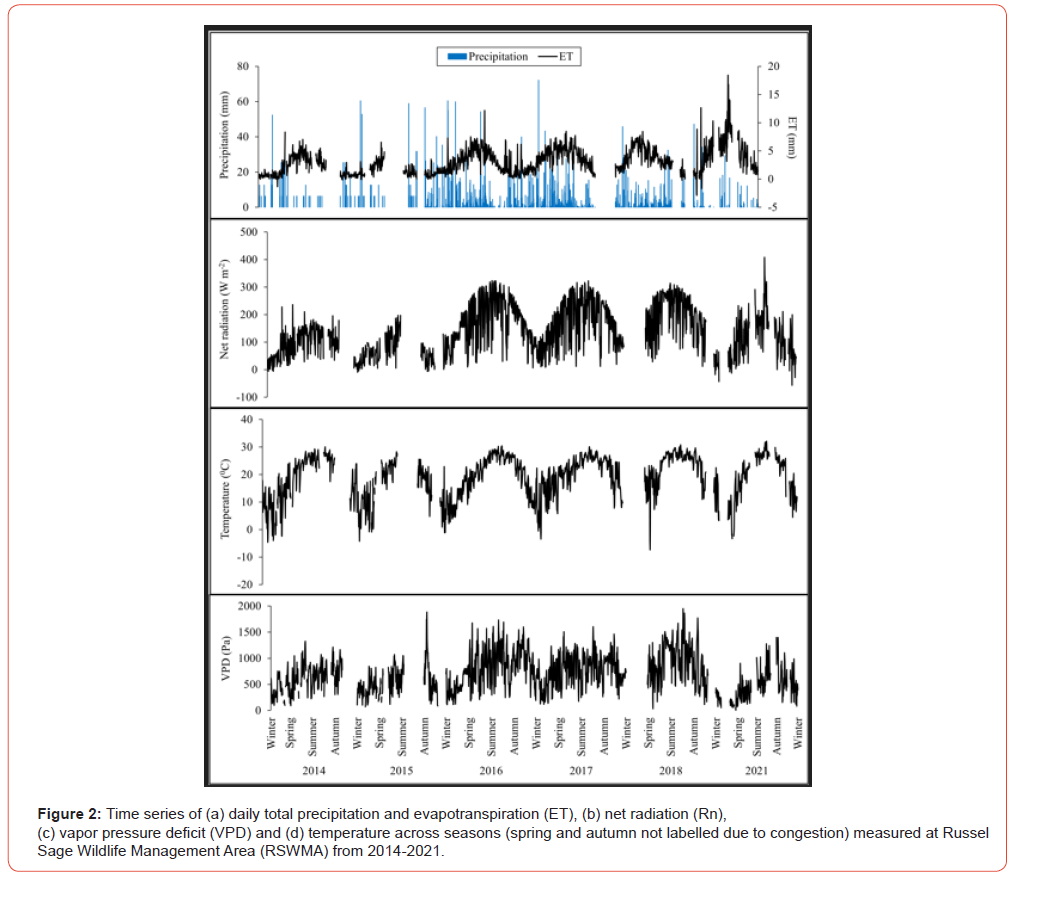
Data for the site were categorized into four seasons (Spring – March to May, Summer – June to August, Fall – September to November, and Winter – December to February). The mean annual precipitation during the study period was comparable to the long-term average (1430 (± 125) (±SD) mm for the study period vs 1386 (± 290) mm for the last 40 years) as retrieved from the meteorological records of 1981 – 2021 using NASA’s POWER database. The mean seasonal precipitation was 763 (± 194) mm for the growing season (March – August) and 667 (± 267) mm for the non-growing season (September – February) at the site. The growing season precipitation ranged from (34 – 70) % of the total annual precipitation. Figure 2 shows the temporal variations of daily ET, precipitation, Rn, temperature, and VPD during the course of the study period. Precipitation showed a strong seasonal pattern with combined maximum precipitation ranging from (53 – 64) % of total annual precipitation only during winter and spring seasons. The site received mean seasonal precipitation of 444 (± 98) mm in spring, 319 (± 136) mm in summer, 261 (± 140) mm in fall, and 405 (± 144) mm in winter. Temperature and VPD showed strong seasonal correspondence with Rn with the highest values observed during summer season and lowest values during winter season. The mean annual air temperature for the study period was 18.54 (± 8.15) 0C which was 0.10C higher than the long-term average.
Evapotranspiration (ET)
Diurnal pattern
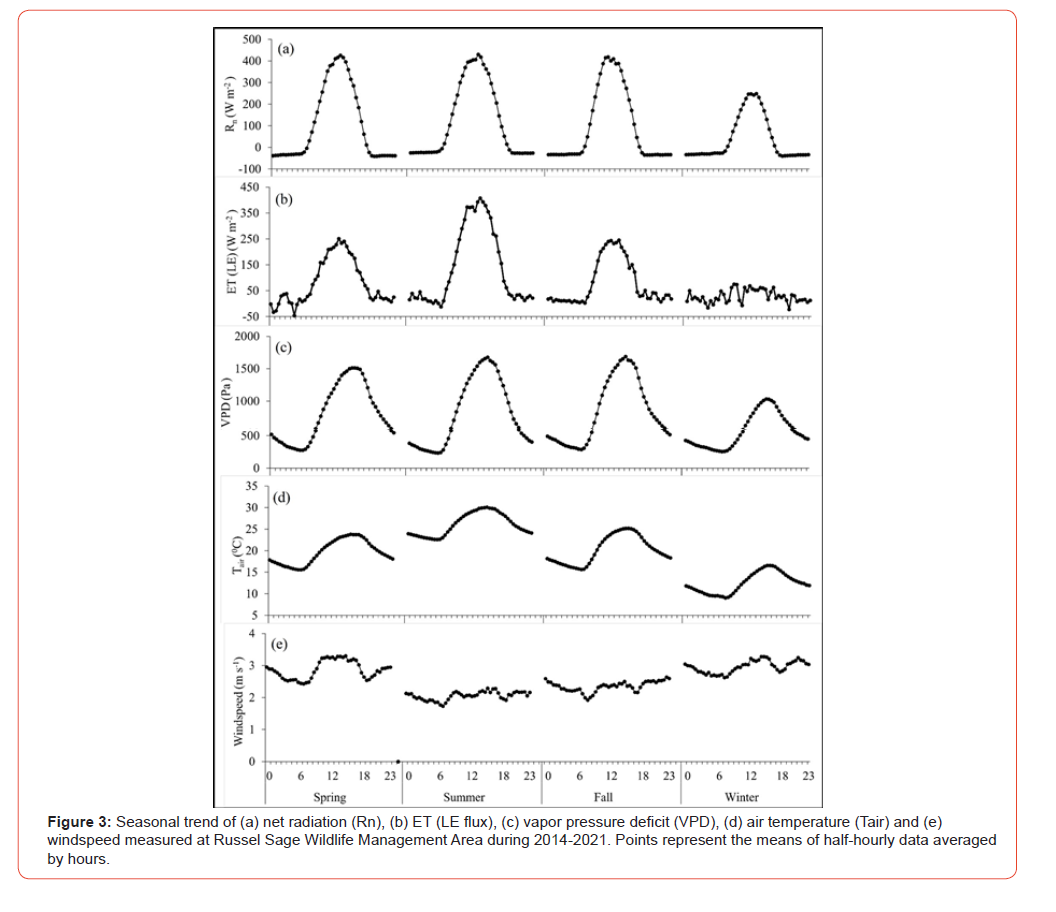
To determine the diurnal pattern, the ET values were averaged by hours to represent the water flux value for the given hour. As shown in Figures 3a and 3b, the overall hourly ET values at our site increased through the morning (0.20 (± 0.03) mm at 05:00 h), peaked around local noon (0.34 (± 0.13) mm at 12:00 h), and declined thereafter (0.07 (± 0.05) mm at 18:00 h). Mostly consistent with this, Rn was the highest with diurnal maximum of 390 (± 171) W m-2 at 12:00 h. During peak daytime, LE and H flux values accounted for about 60% and 39% of total diurnal Rn respectively. This shows a near perfect energy balance closure during noon hours which has implications for the accuracy of EC measurements in this system. The mean nighttime (21:00 – 06:00 h) ET values accounted for about (4 – 21) % of the mean daily values across seasons. The lowest share of about 4% was observed in summer while the maximum of about 21% in winter. We found a strong positive correlation between nighttime ET and VPD (r = 0.65) in summer and a weak negative correlation (r = -0.17) in winter. These values are within the range of those reported by [23] from a mixed hardwood forest in coastal plains of North Carolina.
Seasonal pattern
Seasonal ET values were obtained by averaging daily values over seasons (Figure 2). The mean seasonal ET value for growing season was observed at 757 (± 35) mm, while 396 (± 40) mm for non-growing season. The growing season ET accounted for about (65 – 73) % of total ET. There was a significant difference (p<0.001) in mean ET during the growing and non-growing season. LE flux values accounted for about 80% of Rn in the growing season and about 51% in non- growing season. Similarly, H flux values accounted for about 25% in growing season and 41% in non-growing season. This shows a greater imbalance in seasonal energy balance closure compared to diurnal closure which can be due to substantive energy storage and heat release from the understory components. Spring was the season with the second highest seasonal ET among all the years during the study period. The mean spring ET was 3.19 (± 0.36) mm/day while the seasonal average was 294 (± 34) mm among all years. Similarly, the observed mean ET value was the highest 5.01 (± 0.63) mm/day with seasonal average of 461 (± 58) mm in summer. Like spring, comparative mean ET of 3.19 (± 0.49) mm/day and a seasonal average of 294 (± 46) mm was observed in the autumn albeit with greater variability in daily values. In winter, low mean daily ET of 1.78 (± 0.39) mm/day was observed with a seasonal average of 164 (± 36) mm. Finally, to evaluate differences in seasonal ET, we performed a pairwise t-test by grouping the data into the seasons. Results showed a significant difference (p<0.001) in mean ET between all seasons except for spring-autumn pair, which was not significant.
Inter-annual pattern
The daily ET values were averaged over a year to obtain mean annual ET values for the years. The annual ET values ranged from the lowest 1.57 (± 1.13) mm/day in 2015 to the highest 4.97 (± 3.01) mm/day in 2017. The lowest observed inter-annual mean ET by month was 0.88 (± 0.3) mm/day in December and the highest amounted to 7.78 (± 2.6) mm/day in July. The lower ET in winter months can be attributed to the lower Rn and VPD (Figures 3a and 3d) in conjunction with dormant vegetation. The annual cumulative ET was the lowest 573 mm in 2015 (due to missing data in summer) and the highest 1210 mm in 2017 (year with 170 mm lower precipitation than the 6-year mean and 142 mm lower than the long-term average). The inter-annual mean Rn was 112 (± 79) W/m2.
Discussion
Diurnal pattern
The diurnal variations of ET for all seasons seemed consistent with that of Rn and H for most part of the day. However, a continuous further increase of temperature and VPD until late afternoon (15:00 h) was evident despite decreasing ET and Rn (Figures 3c and 3d). Additionally, the incoming shortwave radiation peaks only at around 13:00 h. This suggests that the heat saturated understory of the forest after around solar noon releases stored heat into the canopy level, thereby increasing the available energy while decreasing the fraction of energy retained from incoming solar radiation, thus, decreasing the Rn. The higher release of radiation from canopy surface into the overlying air in conjunction with decreased ET substantially increase the canopy air temperature and VPD. Furthermore, the results show that BHFs act as heat sink before solar noon and heat source after solar noon, potentially accentuating the role played by these forests in heat and temperature regulation through ET. A further increase in evaporative demand with the rise in temperature and VPD can limit the stomatal conductance [31] and can cause partial stomatal closure [32]. This creates a positive feedback loop by lowering the ET and increasing the VPD until finally the available heat energy diminishes in the late afternoon.
An observed decline in ET against increasing atmospheric evaporative demand can have important implications in regulating the potential stomatal water loss due to the conflux of energy radiation from above and below-canopy especially during latter half of the day. Although during daytime, Rn appears to have a major direct influence on ET, in warm and humid forests like BHFs, nighttime ET contributes a substantive share to the total diurnal ET values. This nighttime share differs seasonally depending on the available energy to evaporate water. The lower nighttime share of only 4% in summer is due to greater daytime ET compared to other seasons. In summer, excess energy stored under the canopy enhances the soil evaporation through the effect of temperature and VPD as observed in strong correlations, especially during nighttime. However, in winter, a negative association of temperature and VPD with ET could be mostly due to condensation of water vapor making the air increasingly drier.
Seasonal pattern
The greater variability of ET in growing season is explained by concomitant increase in Rn and LAI (from below one to 6.53) from winter minimum to a summer maximum in conjunction with rising VPD over the season. Meanwhile, ET exceeded precipitation during summer and autumn while the reverse in winter and spring season. This happens due to soil water recharged during the winter-spring precipitation creating an optimal condition for the developing vegetation to increase ET with available Rn. We used an evaporative index (ratio of ET to precipitation) to characterize the fraction of water lost by ET compared to that received through precipitation. The evaporative index was close to one during growing season (0.99) which decreased to 0.59 in non-growing season. Within growing season, summer has a higher (1.44) index compared to spring (0.66). Higher evaporative index during summer season shows this forest is not water-limited even in the hottest time of the year. Consequently, unusual seasonal precipitation in these seasons can lower seasonal evaporative index with concomitant lowering of Rn, thus can have a big impact on the overall growth of trees in this system. This is further supported by our results with more precipitation resulting in consistently lower growing season ET (up to 16% less cumulative ET in spring of 2016 compared to 2017 with 54% greater precipitation than that of 2017).
Moreover, studies in oak-hickory BHFs [33,34] have shown on a daily scale, periods of extended precipitation can impact ET due to concomitant lowering of VPD during those periods. Thunberg et al. [34] showed a negative short-term effect of precipitation on ET at times not limited by moisture, as observed in our site. With substantive reduction in seasonal ET due to excess precipitation as mentioned earlier, this concept can be extended to seasonal scales as observed in BHF ecosystems, especially during spring and summer, the primary growing periods. This study, along with previous studies on carbon flux at the same site [17] it is seen that prolonged inundation and lower Rn during peak growing season due to increased precipitation/flooding and cloudy conditions can severely affect the rate of transpiration and overall Gross Primary Productivity (GPP). In contrast, studies in tropical ecosystems [35] and coastal BHFs [13] have shown that GPP is usually less affected during stomatal closure due to stronger down-regulation of transpiration rather than photosynthesis. This difference in the response of forest ET and GPP to unusual weather conditions highlights the challenges that need to be addressed to accurately develop ecosystem models to simulate these processes, especially as climate patterns continue to change.
Inter-annual pattern
The lower cumulative annual ET values in years with higher precipitation followed by an increased ET in years with lower precipitation indicate that despite lower precipitation, BHFs are able to maintain consistent annual ET for short periods by utilizing other hydrologic inputs, as shown in the ET studies of hardwood forest site [33] and coastal plain BHFs [13]. The annual evaporative index was the highest 0.92 in 2017 among all years suggesting sufficient plant-available water in the soil to meet atmospheric demand despite periods of below-average rainfall. However, it should be noted that these forests, due to their physiographic location on the floodplains of bayous, precipitation is not the only water source, and during periods of below-average rainfall, subsurface water becomes an important source. This is also supported by the work of [33], that the atmospheric conditions required for comparatively drier conditions (high VPD and Rn in conjunction with lower precipitation) provide for a strong driving force for canopy transpiration and soil evaporation through underground hydraulic redistribution. These interpretations can be further strengthened by the measurement of soil Volumetric Water Content (VWC) and its correlation with the ET losses, one of the limitations of this study. The control of ET by root-based underground mechanisms of soil water access can be further explored with the simultaneous measurement of ground heat flux and soil VWC in this site, where ET may be limited by shallow rooting depth of BHFs. Aguilos et al. [13] reported a similar annual evaporative index from the coastal BHFs of North Carolina, USA. However, the consequences of a couple years of lower precipitation and lower sub-surface recharge of annual ET cannot be generalized over longer periods for a BHF.
Interrelationships among ET and meteorological variables
ET and Rn
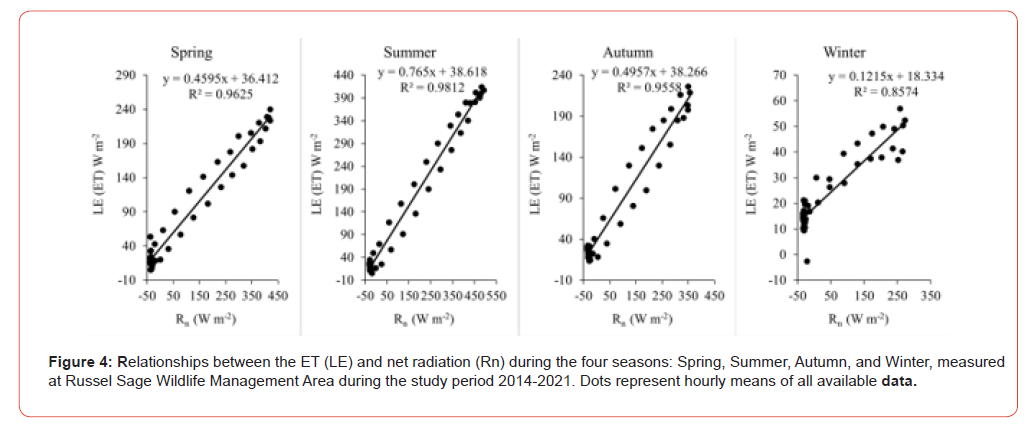
The relationship between the seasonal averages of half-hourly ET and Rn data are presented in Figure 4. The intensity and duration of Rn received by BHFs, except during times of precipitation, is likely the primary driver in determining the rate of ET in these forested wetlands. This is also evident from the 10% lower cumulative ET observed in 2016 than in 2017, the year with 16% more recorded Rn. The strong ET-Rn relationship throughout spring, summer, and fall indicated that ET mostly depends on Rn. Although Rn values were similar for these seasons, summer ET was markedly higher due to higher VPD and temperature in conjunction with fully developed vegetation. The slope of the regression line was nearly equal for spring and autumn (0.46 vs 0.5 respectively), albeit much lower than that of summer (0.76) suggesting the lesser utilization of available energy due to lower LAI in these seasons. Similar to our findings, greater dissipation of Rn to LE in the growing season was also reported by ET studies of wetlands in Florida [35], wetlands in Poland [10], seasonal grass pasture intercropped with maize in tropical climate, Brazil [34], high-latitude boreal forests [35], and coastal plain BHFs in North Carolina, USA [13]. This is indicative that despite the differences in latitude and the type of vegetation, the seasonal dynamics of ET across these several vegetation types show similarities. While Rn is likely the major driving force in these ecosystems, smaller independent contribution of solar radiation was reported in high-latitude boreal forests due to its control on temperature, relative humidity and longwave radiation [35].
ET and Temperature
Solar radiation is a major driver of temperature and contributes to variations in downwelling longwave radiation, impacting the ambient temperature. Temperature can affect the rate of daytime and nighttime ET. In our study, the diurnal ET-temperature relationship before local noon showed a linear fit with proportional increase in ET with temperature. However, after 15:00 h, a nonlinear decrease in ET was observed, as temperature decreases with diminishing Rn. The lower retention of incoming radiation and release of longwave radiation emitted by heat saturated forest understory components further increase air temperature while ET starts declining. This showed a lesser degree of control of ET by air temperature compared to Rn, especially during the latter half of the day. A correlation analysis showed that the rate of ET was significantly correlated to the temperature on a daily (r = 0.69, p<0.001) and seasonal (r = 0.57, p<0.001) scales.
ET and VPD
Since the atmospheric deficit for water promotes the rate of ET, therefore the increase in VPD of the air generally increases the rate of ET given enough soil moisture is present and plants are not stressed. In our study, daily average VPD reached a maximum (1550 Pa) at around 15:00 h while the rate of ET decreased after peaking at 13:00 h, suggesting greater influence of Rn on the rate of ET than VPD. Correlation analysis showed that the rate of ET was significantly correlated to the VPD on a daily (r = 0.78, p<0.001) and seasonal (r = 0.59, p<0.001) scales. Similar to the ET-temperature relationship, the diurnal ET-VPD relationship before local noon showed a good fit with linear increase in ET with VPD. However, after 15:00 h, a non-linear decrease in ET-VPD was observed. Highly positive correlation of VPD with ET suggested that atmospheric demand for water influences the rate of ET, however, this could also be due to strong control and similar variability patterns of Rn on VPD. With a further increase in VPD observed despite decreasing ET after local noon (Figure 3), these results suggest that the rate of ET doesn’t increase linearly in response to increasing VPD, especially after solar noon. These findings are consistent with other studies of inland wetlands of Poland [10] and coastal BHFs of North Carolina [13]. Further, the importance of VPD in determining the rate of ET and hence, Gross Primary Productivity (GPP) of the ecosystem has already been established [17,33,36].
ET and Precipitation
On hourly scale, a weak correlation (rspring = 0.10, rsummer = 0.01, rautumn = 0.13, rwinter = - 0.01, p>0.05 for all) between precipitation and ET was observed. These correlation coefficients changed at daily timescale (rspring = 0.12, rsummer = -0.01, rautumn = 0.15, rwinter = 0.01, p>0.05 for all). Although not significant, these weak correlations suggest precipitation having greater impact on daily timescales compared to hourly timescales with a negative influence in summer. This could be an immediate decline in photosynthetic (transpiration) activity following a precipitation event. This was also supported by lower monthly evaporative index during growing months with high precipitation (1.12 vs 3.01 in May of 2017 and 2018 respectively and 0.81 vs 3.18 in June of 2017 and 2018 respectively, with both months in 2017 receiving nearly double precipitation) suggesting sufficient plant water available to meet the atmospheric demand for water. This is indicative of ET limited by available energy during precipitation events as shown in similar ET studies [35]. This effect was more pronounced at seasonal scales. Spring ET values were impacted more by precipitation (0.43 vs 1.14 in spring 2016 and 2017 respectively, with spring of 2016 receiving nearly double precipitation) than summer ET values. In the non-growing season, the negative effect of precipitation was greater in the autumn and there was a positive correlation between precipitation and ET in winter. This implies differential control of precipitation as a driver of ET over seasons. In spring, with unusually higher precipitation, ET is limited by available energy, reinforcing the greater overall control of Rn in the process. However, these correlations do not imply independent causations and should be interpreted with further validations.
A major impact of precipitation on ET has already been established and/or suggested from various ecosystem studies such as tropical [36], boreal and tundra [34]. Despite the findings that precipitation increases the amount of available soil moisture in the long run, it can negatively affect the hourly and daily ET and GPP by limiting the VPD and available Rn. This finding was further supported by the reports from the same-site by Bloch [17] which showed that 2016 was a year with comparatively higher growing season precipitation, yet the GPP was the lowest compared to other years. Although Baldochhi [39] and Oishi et al. [33] have shown that hardwood trees (e.g., oak-hickory as in this study) can maintain consistent annual ET by altering the time and magnitude of daily and seasonal peak ET, despite periods of unusual precipitation and temperatures; other studies report extended periods of flooding/ precipitation can lead to shorter growing periods, early senescence, and an overall decrease in productivity [17,39,40]. This necessitates a further investigation of seasonal water fluxes for BHFs which can have long-term impacts on the ecosystem productivity and overall dynamics as the unusual climate trend continues.
ET and Windspeed
Windspeed significantly impacts the rate of ET by removing the water vapor from the evaporating surface. Dryer air increases the rate of ET than moist air. At our site, higher windspeed was correlated (rspring = 0.80, p<0.001 and rsummer = 0.42, p<0.001) with increased rate of ET during the growing season. In humid subtropical climates as in this site, windspeed significantly impacts the rate of ET by removing the water vapor from the evaporating surface and increasing turbulence [35,36]. Similarly, Thunberg et al. [35] reported the largest independent contribution of windspeed to ET variability in non-permafrost high-latitude boreal forests [41- 46]. This effect is more apparent in the forested wetland sites with higher humidity such as mid-latitude wetlands and bottomland hardwoods. Significant daily, seasonal, and inter-annual variations in the magnitude and patterns of ET as characterized in this study are important in better understanding water fluxes in these forest [47-51], which can have implications for strategic planning and management of regional water budget models.
These findings will help in strengthening regional and national water flux models by filling the gap and highlighting the importance of water balance in maintaining sustainable BHF ecosystem [52- 61]. Since, ET is positively correlated with the GPP in these midlatitude forests [35] and timely water availability is an important determinant of wetland forest ecosystem productivity [35]; the timing and duration of water influx in a BHF ecosystem can impact carbon sequestration capabilities considering climate change scenarios [62-66]. Further investigation of the role of key drivers in the seasonal ET fluxes is needed to accurately assess their independent contribution to variability in ET for these bottomland hardwood ecosystems [67-71]. Perhaps, a structural modelling approach focused on path analysis would enable us to further fine-tune the process-modeling by partitioning the independent contributions of the key drivers of ET. This can have implications for process-driven management strategies that can be helpful in better conservation of these critical but poorly understood ecosystems.
Conclusions
Based on 6 years of monitoring water flux values in a Bottomland Hardwood Forest in the Lower Mississippi Alluvial Valley using the Eddy Covariance method, we conclude that the ET values in growing season are significantly higher compared to those in non-growing season. Annual ET values were more resilient to the changes in precipitation patterns across years. Seasonal values, which could be affected due to the abnormal changes in meteorological conditions, however, can have a big impact on the forest productivity especially for deciduous forests with limited growing period in a year. Net radiation influenced ET the most while temperature, VPD, precipitation, and windspeed play an important role in determining the daily and seasonal values. The incorporation of these findings in current regional and national water flux models can inform better decision making for hydrologic management practices in the region. As this study is a first attempt to understand high-resolution water fluxes in a bottomland hardwood ecosystem representative of the region, we presume that these findings will contribute to gap-fill and develop more accurate water flux models at both regional and national scales. With a global change in climate and altered precipitation patterns, the conservation of bottomland hardwoods for sustainable ecosystem balance has become crucial more than ever in the coming decades.
Data Availability Statement
Data will be made available through the AmeriFlux website.
Acknowledgement
This study was funded by the United States Geological Survey (USGS) [G21AC10226, 2021] awarded to JB. The authors acknowledge contributions by members of Plant Ecology Lab, University of Louisiana at Monroe.
Conflict of Interest
The authors declare no conflict of interest.
References
- King SL, Keim RF (2019) Hydrologic modifications challenge bottomland hardwood forest management. J For 117(5): 504-514.
- Jenkins WA, Murray BC, Kramer RA, Faulkner SP (2010) Valuing ecosystem services from wetlands restoration in the Mississippi Alluvial Valley. Ecol Econ 69(5): 1051-1061.
- Capon SJ, Chambers LE, MacNally R, Naiman RJ, Davies P, et al. (2013) Riparian ecosystems in the 21st century: hotspots for climate change adaptation?. Ecosyst 16: 359-381.
- Wharton CH (1982) The ecology of bottomland hardwood swamps of the Southeast: a community profile. Lafayette (LA, USA). US Fish and Wildlife.
- Reid ML (2014) A Quarter Century of Plant Succession in a Bottomland Hardwood Forest in Northeastern Louisiana [master’s thesis]. Monroe (LA): University of Louisiana Monroe.
- Ward JV (1989) The four-dimensional nature of lotic ecosystems. J North Am Benthol Soc 8(1): 2-8.
- Hodges JD (1997) Development and ecology of bottomland hardwood sites. For Ecol Manag 90(23): 117-125.
- Lott RB, Hunt RJ (2001) Estimating evapotranspiration in natural and constructed wetlands. Wetlands 21(4): 614-628.
- Abtew W, Melesse A (2012) Evaporation and evapotranspiration: measurements and estimations. Berlin (Germany): SSBM.
- Siedlecki M, Pawlak W, Fortuniak K, Zieliński M (2016) Wetland evapotranspiration: Eddy covariance measurement in the Biebrza valley, Poland. Wetlands 36(6): 1055-1067.
- Pauliukonis N, Schneider R (2001) Temporal patterns in evapotranspiration from lysimeters with three common wetland plant species in the eastern United States. Aquat Bot 71(1): 35-46.
- Acreman MC, Harding RJ, Lloyd CR, McNeil DD (2003) Evaporation characteristics of wetlands: experience from a wet grassland and a reedbed using eddy correlation measurements. HESS 7(1): 11-21.
- Aguilos M, Sun G, Noormets A, Domec JC, McNulty S, et al. (2021) Effects of land-use change and drought on decadal evapotranspiration and water balance of natural and managed forested wetlands along the southeastern US lower coastal plain. AFM 303: 108-381.
- Burba GG, Verma SB, Kim J (1999) Energy fluxes of an open water area in a mid-latitude prairie wetland. Boundary-Layer Meteorol 91(3): 495-504.
- Kellner E (2001) Surface energy fluxes and control of evapotranspiration from a Swedish Sphagnum mire. AFM 110(2): 101-123.
- Peacock CE, Hess TM (2004) Estimating evapotranspiration from a reed bed using the Bowen ratio energy balance method. Hydrol Process 18(2): 247-260.
- Bloch MB (2021) Characterization of CO2 fluxes over Bottomland Hardwood Forests in Northeast Louisiana [master’s thesis]. Monroe (LA): University of Louisiana Monroe.
- Kurbatova J, Arneth A, Vygodskaya NN, Kolle O, Varlargin AV, et al. (2002) Comparative ecosystem–atmosphere exchange of energy and mass in a European Russian and a central Siberian bog I. Interseasonal and interannual variability of energy and latent heat fluxes during the snow free period. Tellus B: Chem Phys Meteorol 54(5): 497-513.
- Gasca Tucker DL, Acreman MC, Agnew CT, Thompson JR (2007) Estimating evaporation from a wet grassland. HESS 11(1): 270-282.
- Goulden ML, Litvak M, Miller SD (2007) Factors that control Typha marsh evapotranspiration. Aquat Bot 86(2): 97-106.
- Dawson TE, Burgess SS, Tu KP, Oliveira RS, Santiago LS, et al. (2007) Nighttime transpiration in woody plants from contrasting ecosystems. Tree Physiol 27(4): 561-575.
- Fisher JB, Baldocchi D, Misson L, Dawson TE, Goldstein AH (2007) What the towers don't see at night: nocturnal sap flow in trees and shrubs at two AmeriFlux sites in California. Tree Physiol 27(4): 597-610.
- Oishi AC, Oren R, Stoy PC (2008) Estimating components of forest evapotranspiration: a footprint approach for scaling sap flux measurements. AFM 148(11): 1719-1732.
- Li Y, Zhou L, Xu Z, Zhou G (2009) Comparison of water vapor, heat and energy exchanges over agricultural and wetland ecosystems. Hydrol Process 23(14): 2069-2080.
- Sánchez Carrillo S, Angeler DG, Sánchez Andrés R, Alvarez Cobelas M, Garatuza Payán J (2004) Evapotranspiration in semi-arid wetlands: relationships between inundation and the macrophyte-cover: open-water ratio. Adv Water Resour 27(6): 643-655.
- Drexler JZ, Anderson FE, Snyder RL (2008) Evapotranspiration rates and crop coefficients for a restored marsh in the Sacramento–San Joaquin Delta, California, USA. Hydrol Process 22(6): 725-735.
- Reid ML, Allen SR, Bhattacharjee J (2014) Patterns of spatial distribution and seed dispersal among bottomland hardwood tree species. Castanea 79(4): 255-265.
- Schmidt JP, Moore R, Alber M (2014) Integrating ecosystem services and local government finances into land use planning: A case study from coastal Georgia. Landsc Urban Plan 122: 56-67.
- Reichstein M, Falge E, Baldocchi D, Papale D, Aubinet M, et al. (2005) On the separation of net ecosystem exchange into assimilation and ecosystem respiration: review and improved algorithm. Glob Change Biol 11(9): 1424-1439.
- Gazal RM, Kubiske ME, Connor KF (2009) Leaf gas exchange of mature bottomland oak trees. US Dept of Ag. Forest Service. Southern Research Station.
- Li Z, Zhang Y, Wang S, Yuan G, Yang Y, et al. (2010) Evapotranspiration of a tropical rain forest in Xishuangbanna, southwest China. Hydrol Process 24(17): 2405-2416.
- Oishi AC, Oren R, Novick KA, Palmroth S, Katul GG (2010) Interannual invariability of forest evapotranspiration and its consequences to water flow downstream. Ecosyst 13(3): 421-436.
- Machado CB, Lima JRDS, Antonino AC, Souza ESD, Souza R, et al. (2016) Daily and seasonal patterns of CO2 fluxes and evapotranspiration in maize-grass intercropping. Rev Bras de Eng Agricola e Ambient 20(9): 777-782.
- Thunberg SM, Walsh JE, Euskirchen ES, Redilla K, Rocha AV (2021) Surface moisture budget of tundra and boreal ecosystems in Alaska: Variations and drivers. Polar Science 1(29): 100685.
- Maréchaux I, Bonal D, Bartlett MK, Burban B, Coste S, et al. (2018) Dry‐season decline in tree sap flux is correlated with leaf turgor loss point in a tropical rainforest. Funct Ecol 32(10): 2285-2297.
- Wu CL, Shukla S (2014) Eddy covariance‐based evapotranspiration for a subtropical wetland. Hydrol Process 28(24): 5879-5896.
- Bonan G (2016) Ecological climatology: concepts and applications. Cambridge University Press, New York (NY).
- Baldocchi D (1997) Measuring and modelling carbon dioxide and water vapor exchange over a temperate broad‐leaved forest during the 1995 summer drought. Plant Cell Environ 20(9): 1108-1122.
- Munné Bosch S, Alegre L (2004) Die and let live; leaf senescence contributes to plant survival under drought stress. Funct Plant Biol 31(3): 203-216.
- Vander Mijnsbrugge K, Turcsán A, Maes J, Duchêne N, Meeus S, et al. (2016) Repeated summer drought and re-watering during the first growing year of oak (Quercus petraea) delay autumn senescence and bud burst in the following spring. Front Plant Sci 7: 419.
- Alavi N, Warland JS, Berg AA (2006) Filling gaps in evapotranspiration measurements for water budget studies: Evaluation of a Kalman filtering approach. AFM 141(1): 57-66.
- Baldocchi D (2003) Assessing the eddy covariance technique for evaluating carbon dioxide exchange rates of ecosystems: past, present and future. Glob Chang Biol 9(4): 479-492.
- Baldocchi D, Ryu Y (2011) A synthesis of forest evaporation fluxes–from days to years–as measured with eddy covariance. Forest hydrology and biogeochemistry: synthesis of past research and future directions. Berlin (Germany): SSBM (216): 101-116.
- Baldocchi D, Falge E, Gu L, Olson R, Hollinger D, et al. (2001) FLUXNET: A new tool to study the temporal and spatial variability of ecosystem-scale carbon dioxide, water vapor, and energy flux densities. BAMS 82(11): 2415-2434.
- Barr AG, Black TA, Hogg EH, Griffis TJ, Morgenstern K, et al. (2007) Climatic controls on the carbon and water balances of a boreal aspen forest, 1994–2003. Glob Chang Biol 13(3): 561-576.
- Bidlake WR (2000) Evapotranspiration from a Bulrush‐dominated wetland in the Klamath Basin, Oregon 1. JAWRA 36(6): 1309-1320.
- Burba GG, Verma SB (2005) Seasonal and interannual variability in evapotranspiration of native tallgrass prairie and cultivated wheat ecosystems. AFM 135(1-4): 190-201.
- Burba G, Anderson D (2010) A brief practical guide to eddy covariance flux measurements: principles and workflow examples for scientific and industrial applications. Li-Cor Biosciences, Nebraska USA.
- Burba G (2013) Eddy covariance method for scientific, industrial, agricultural and regulatory applications: A field book on measuring ecosystem gas exchange and areal emission rates. Li-Cor Biosciences, Nebraska USA.
- Campbell DI, Williamson JL (1997) Evaporation from a raised peat bog. J Hydrol 193(1-4): 142-160.
- Collalti A, Trotta C, Keenan TF, Ibrom A, Bond Lamberty B, et al. (2018) Thinning can reduce losses in carbon use efficiency and carbon stocks in managed forests under warmer climate. J Adv Model Earth Syst 10(10): 2427-2452.
- Drexler JZ, Snyder RL, Spano D, Paw UKT (2004) A review of models and micrometeorological methods used to estimate wetland evapotranspiration. Hydrol Process 18(11): 2071-2101.
- Finnigan JJ, Clement R, Malhi Y, Leuning R, Cleugh HA (2003) A re-evaluation of long-term flux measurement techniques part I: averaging and coordinate rotation. Boundary-Layer Meteorol 107(1): 1-48.
- Herbst M, Kappen L (1999) The ratio of transpiration versus evaporation in a reed belt as influenced by weather conditions. Aquat Bot 63(2): 113-125.
- Jacobs JM, Mergelsberg SL, Lopera AF, Myers DA (2002) Evapotranspiration from a wet prairie wetland under drought conditions: Paynes Prairie Preserve, Florida, USA. Wetlands 22(2): 374-385.
- Keenan TF, Prentice IC, Canadell JG, Williams CA, Wang H, et al. (2016) Recent pause in the growth rate of atmospheric CO2 due to enhanced terrestrial carbon uptake. Nat Commun 7(1): 13428.
- Kosugi Y, Takanashi S, Tani M, Ohkubo S, Matsuo N, et al. (2012) Effect of inter-annual climate variability on evapotranspiration and canopy CO2 exchange of a tropical rainforest in Peninsular Malaysia. J For Res 17(3): 227-240.
- Kucharik CJ, Barford CC, El Maayar M, Wofsy SC, Monson RK, et al. (2006) A multiyear evaluation of a Dynamic Global Vegetation Model at three AmeriFlux forest sites: Vegetation structure, phenology, soil temperature, and CO2 and H2O vapor exchange. Ecol Modell 196(1-2): 1-31.
- Mao LM, Bergman MJ, Tai CC (2002) Evapotranspiration measurement and estimation of three wetland environments in the upper St. Johns River basin, Florida 1. JAWRA 38(5): 1271- 1285.
- Papale D, Reichstein M, Aubinet M, Canfora E, Bernhofer C, et al. (2006) Towards a standardized processing of Net Ecosystem Exchange measured with eddy covariance technique: algorithms and uncertainty estimation. BG 3(4): 571-583.
- Potter NJ, Zhang L (2009) Interannual variability of catchment water balance in Australia. J Hydrol 369(1-2): 120-129.
- (2022) Prediction of Worldwide Energy Resource, National Aeronautics Space Administration (NASA). [accessed on: 15 December, 2022].
- Přibáň K, Ondok JP (1985) Heat balance components and evapotranspiration from a sedge-grass marsh. Folia Geobot 20: 41-56.
- RStudio Team (2021.09.0). RStudio: Integrated Development for R. RStudio, PBC, Boston, MA URL http://www.rstudio.com/.
- Schäfer KV, Oren R, Lai CT, Katul GG (2002) Hydrologic balance in an intact temperate forest ecosystem under ambient and elevated atmospheric CO2 Glob Change Biol 8(9): 895-911.
- Soucha C, Wolfe CP, Grimmtind CSB (1996) Wetland evaporation and energy partitioning: Indiana dunes national lakeshore. J Hydrol 184(3-4): 189-208.
- Souch CA, Stephens W (1998) Growth, productivity and water use in three hybrid poplar clones. Tree Physiol 18(12): 829-835.
- Van Der Horst SV, Pitman AJ, De Kauwe MG, Ukkola A, Abramowitz G, et al. (2019) How representative are FLUXNET measurements of surface fluxes during temperature extremes? BG 16(8): 1829-1844.
- Webb EK, Pearman GI, Leuning R (1980) Correction of flux measurements for density effects due to heat and water vapor transfer. Q J R Meteorol 106(447): 85-100.
- Wessel DA, Rouse WR (1994) Modelling evaporation from wetland tundra. Boundary Layer Meteorol 68: 109-130.
- Zhou L, Zhou G (2009) Measurement and modelling of evapotranspiration over a reed (Phragmites australis) marsh in Northeast China. J Hydrol 372(1-4): 41-47.
-

This work is licensed under a Creative Commons Attribution-NonCommercial 4.0 International License.