 Case Report
Hydrology Report of Sambhar Lake: A Safe Haven Past Disaster Recovery
Monali Sen, Rajasthan State Wetland Authority, India.
Received Date:July 15, 2024; Published Date:July 29, 2024
Abstract
Sambhar Lake is one of the two Ramsar sites in Rajasthan-the other one is the Keoladeo National Bird Sanctuary at Bharatpur - sites identified as ‘Wetlands of International Importance’ listed under the Ramsar Convention of 1971. Sambhar Lake was designated as a Ramsar site on March 23, 1990, due to its biological and biotic importance and in particular because it is a wintering area for tens of thousands of flamingos, pelicans, and other migratory birds from Northern Asia. Sambhar Lake is considered ecologically significant due to its saline nature and unique flora and fauna adapted to extreme salinity. It supports various bird species, including flamingos, pelicans, storks, and many other birds. The lake serves as a critical wintering ground and stopover site for migratory waterfowl and wading birds that travel along the Central Asian Flyway. Thousands of migratory birds depend on the lake’s resources during their journey, making it a vital habitat for these species. The present study is aimed toward the hydrological modeling of the Lake to understand any major possible change anticipated shortly that may pose a threat to wetland health and consecutively to the migratory birds.
Keywords:Sambhar lake; Salinity; Rainfall; Hydrology
Introduction
The Sambhar Lake (Wetland) is distinct in India’s natural landscape, known for its high salinity and diverse flora and fauna adapted to extreme conditions. It has attracted attention for its exceptional hydrological characteristics and ecological significance. Its location in the arid state of Rajasthan, India, adds to its uniqueness, as it serves as a critical habitat for numerous flora and fauna species specially adapted to extreme salinity levels. The lake’s historical, ecological, and geological significance makes it a captivating subject for scientific inquiry.
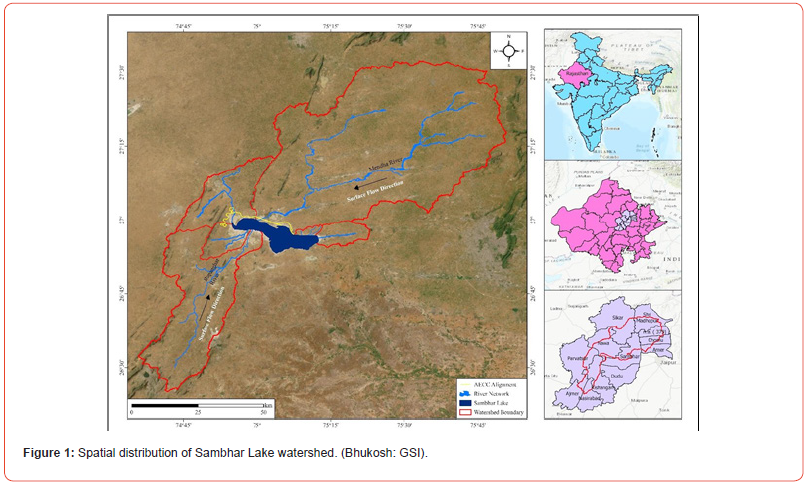
Sambhar Lake is the largest inland saltwater lake in India and covers approximately 152.26 km2 (maximum water spread area during 1996). The lake is about 80 kilometers southwest of Rajasthan’s state capital (Figure 1). The Sambhar Lake is shallow and experiences significant water level and surface area fluctuations throughout the year. During the monsoon season, the lake receives rainfall and runoff from the surrounding hills, causing it to expand and form a vast water body. However, the lake dries in the dry season, leaving behind a white salt crust. Sambhar Lake has significant ecological importance as it is a vital habitat for various bird species, including resident and migratory birds. It is recognized as a Ramsar site, indicating its international importance for wetland conservation and biodiversity. The lake has also been a traditional source of salt production in the region for centuries.
Sambhar Lake drew major global attention in 2019 when mass mortality of migratory birds was reported due to Avian Botulism (Sen & Singh, 2023). The cause of the outbreak was due to a change in water characteristics reported that year due to excess rainfall, whereby the optimum salinity and organic elements level were affected. The present study is an effort made to analyze the hydrology of Sambhar Lake for the past decade to understand the possibility of any future risks occurring due to changes in wetland health.
The study has considered various edaphic factors like precipitation and changes in water levels (Jain et al. 2001).
By using hydrological modeling, this research investigates potential alterations in the lake’s water dynamics, flow patterns, and overall hydrological equilibrium in recent times.
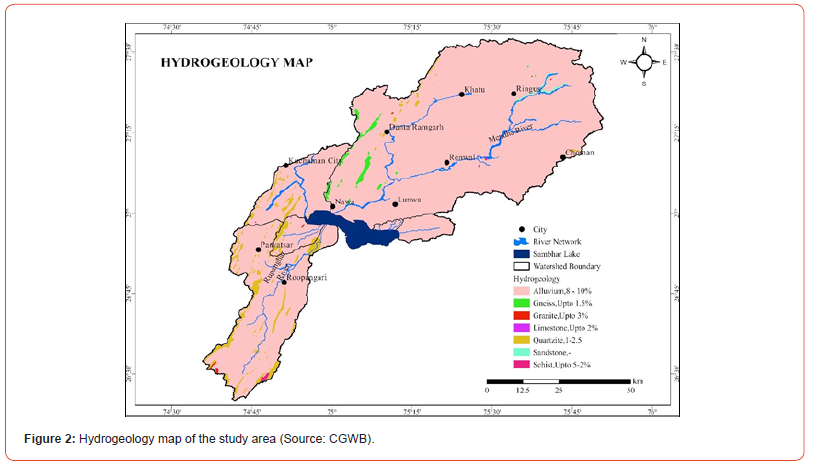
The hydrogeological framework of the study area is mainly controlled by geological settings, intensity and distribution of rainfall patterns, and the degree of primary and secondary structures in the prevailing geological formations for the storage and movement of the groundwater. The major aquifers in the study area are the older alluvium and aeolian alluvium, with a yield of 8% to 10% occurring under the semi-confined condition (Figure 2).
The objective of this study is to assess the changes in the inflow under the modified hydrological regime, impact under high flow conditions, and ecological modifications, if any.
Case Presentation
The present study uses historical remote sensing, precipitation, and temperature data to identify the water spread area of the lake. It prepares a water spread area for the Sambhar Lake boundary vis-àvis the location of the railway tracks. Remote sensing data has been used from 1991 to 2023 to understand the water-spread area of the lake. To establish the hydrological model, below input parameters have been considered during the present study (Table 1).
Table 1:Input Datasets and Sources.

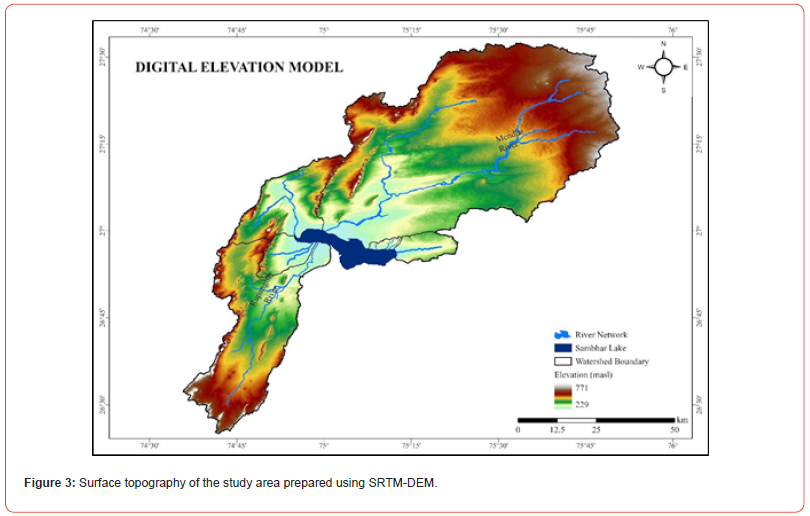
A Digital Elevation Model (DEM) of 30 m resolution (Figure 3) represents surface topography. The DEM has been downscaled to 10 m to maintain the same spatial resolution of all the input datasets.
Groundwater always remains under the influence of timedependent recharging and discharging factors. The input to the groundwater system includes rainfall, seepage from reservoirs, lakes, ponds, rivers, and irrigation. The output from the groundwater system includes groundwater withdrawal, natural seepage to rivers and sea, evaporation from the shallow water table, and transpiration through vegetation. The input and output of the groundwater system influence the water levels prevailing in each area. Due to this continuous influence, water levels of the aquifer system fluctuate, and the range depends on the period of influence.
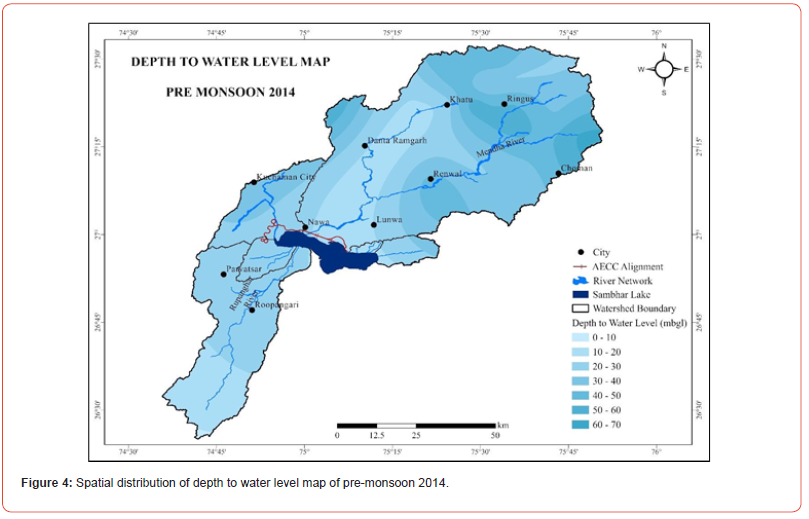
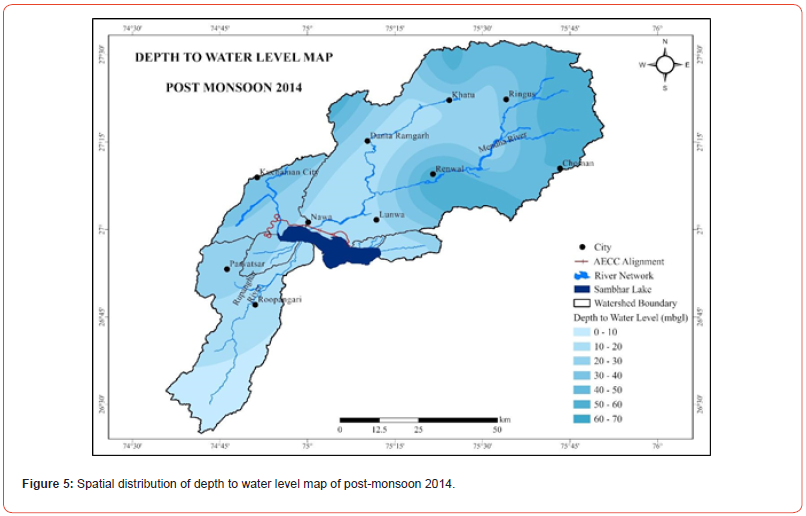
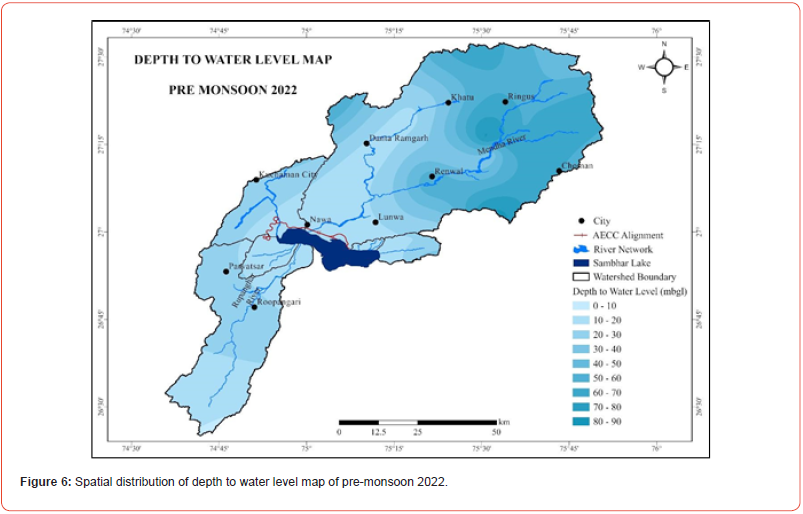
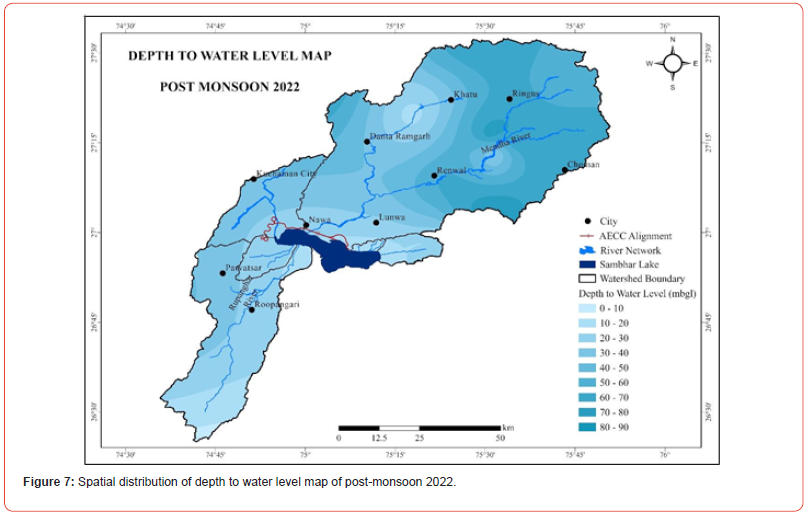
To better understand the hydrogeological scenario of the study area, an approach has been made to decipher the orientation of the groundwater in the area under the water table configuration. To undertake the same, a pre- and post-monsoon depth-to-water level map of the study area has been prepared from the Central Ground Water Board (CGWB) monitoring wells around the Sambhar Lake region for 2014 and 2022 (Figure 4 to Figure 7). Water table elevation of the area above means sea level is derived from the CGWB observation wells and the same has been used to generate the water table elevation contours.
During pre-monsoon 2014, the depth to water level for the study area ranges between 9.09 m bgl (meter below ground levels) and 63.58 m bgl. The higher depth to water level is observed along the northern parts, while the shallower depth to water level is observed along the southern border of the study area. During postmonsoon 2014, the depth to water level for the study area ranges between 3.76 m bgl and 60.38 m bgl. The higher depth to water level is observed along the northern and some central parts, while the shallower depth to water level is observed along the southern part of the study area. Upon comparing the pre-and post-monsoon 2014 depth to water level data, it is clear that the groundwater level increases along the southern part of the study area, while the northern parts show a decline in the groundwater level.
During pre-monsoon 2022, the depth to water level for the study area ranges between 8.28 m bgl and 83.67 m bgl. The higher depth to water level is observed along the northern and centraleastern parts, while shallower depth to water level is observed along the southern border. Upon comparing the post-monsoon 2014 and pre-monsoon 2022, a decline in groundwater level is observed along the northern, central eastern, and southern parts. During post-monsoon 2022, the depth to water level for the study area ranges between 6.78 m bgl and 81.39 m bgl. The higher depth to water level is observed along the northern and central-eastern parts, while shallower depth to water level is observed along the southern border of the study area. From pre- and post-monsoon 2022, it is clear that the study area’s northern part, central part, and some southwestern borders show a decline in the groundwater level. Similarly, a reduction in groundwater level is observed along the northern part, central part, and some south-western borders of the study area during pre-monsoon 2014 and post-monsoon 2022.
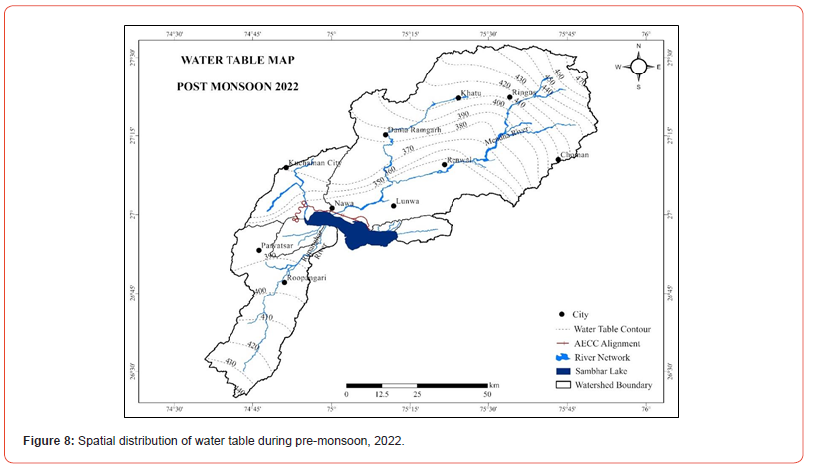
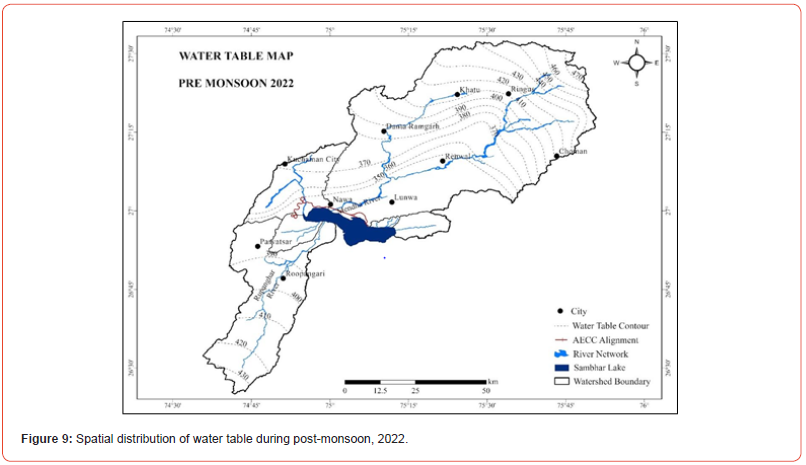
The water table map of pre- and post-monsoon 2022 has been prepared to understand the groundwater flow in the study area (Figure 8 and Figure 9). The pre-and post-monsoon 2022 water table depicts the groundwater table ranges between 350 m amsl to 470 m amsl. The spatial pattern of the water table contour map indicates that groundwater flows towards the Sambhar Lake from north to south in the Mendha River catchment and south to north in the Rupangar River catchment.
The present study collected rainfall data from the Indian Meteorological Department (IMD) Pune from 2010 to 2022.
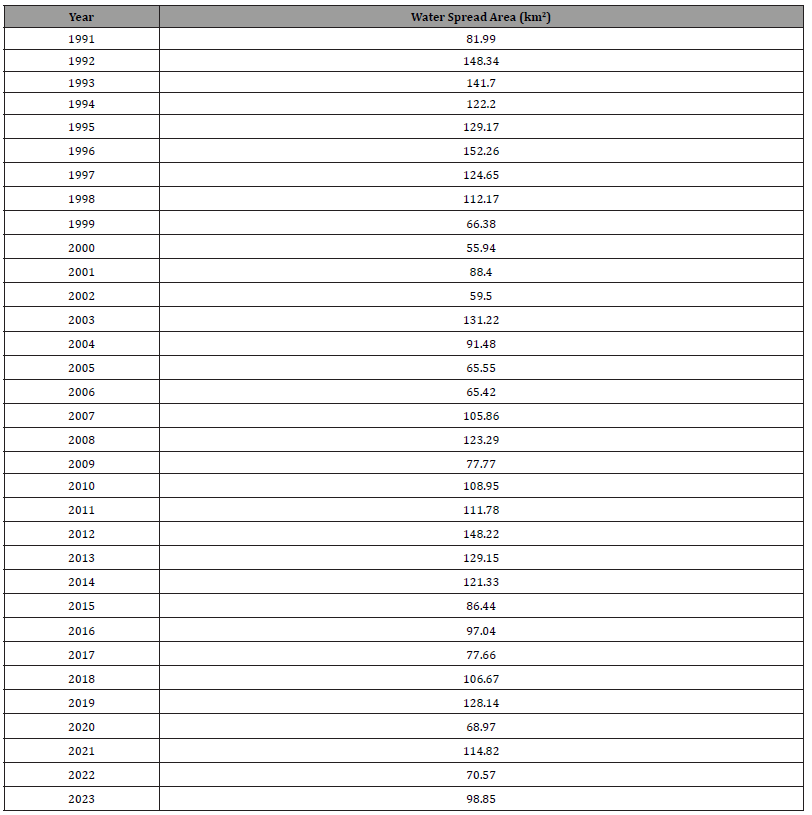
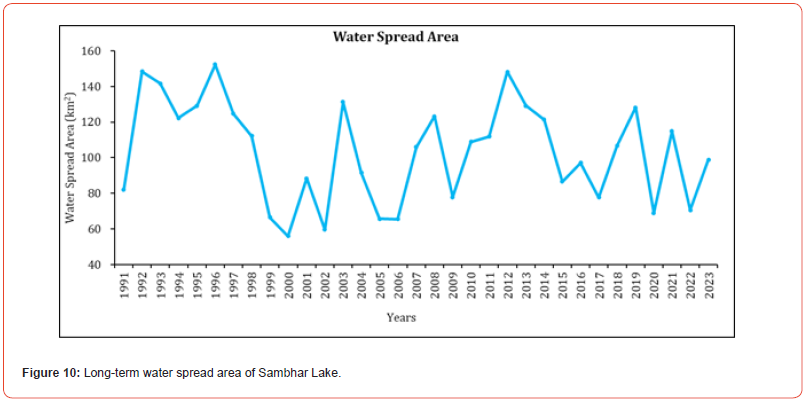
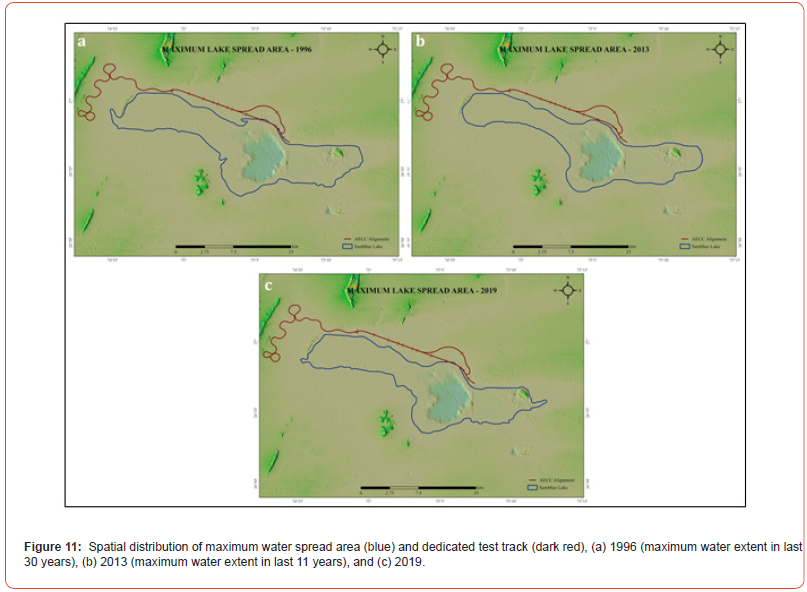
The area of the water extent and the maximum water spread area have been assessed (Figure 10; Table 2). The maximum water spread area was 152.26 km2 in 1996, the minimum water extent area was 55.94 km2 in 2000 and the average water extent area was 100.2778 km2.
Table 2:Summary of Sambhar Lake water spread area.
Discussion
The present report shows a complete assessment of the hydrological study to demonstrate the historical scale submergence of the wetland.
The annual surface runoff has been estimated from 2002 to 2022. The minimum surface runoff was about 377.10 x 10⁶ m3 in 2002, and the maximum was 2666.54 x 106 m3 in 2022 for the Mendha River basin. The minimum surface runoff for the Rupangarh River basin was about 114.64 x 10⁶ m3 in 2002, and the maximum was 763.68 x 10⁶ m3 in 1996. Khardia River’s minimum surface runoff was approximately 53.95 x 10⁶ m3 in 2002, and the maximum was 266.42 x 10⁶ m3 in 2019. Khandel River’s minimum surface runoff was about 0.32 x 10⁶ m3 in 2007, and the maximum was 74.53 x 10⁶ m3 in 2021. Overall, the Mendha River receives more runoff than the other three rivers in the study area.
The present study shows peak discharge of approximately 1591 m3/s for a 25-year return period, 1943 m3/s for a 50-year return period, and 2301 m3/s for 100-year return periods. The outcome from the present study indicates that the water spread area of Sambhar Lake (Wetland) is showing a decreasing trend in the study area. The maximum water spread area was 152.26 km2 in 1996; the minimum water extent area was 55.94 km2 in 2000.
The spatial pattern of depth to water level ranges from 9.09 to 63.58 m bgl during 2014 and 8.28 to 83.67 m bgl during 2022, indicating changes in groundwater levels. The seasonal variability in depth to water levels has also been observed during the study period. The spatial distribution of the water table map of pre- and post-monsoon for 2022 has been prepared to understand the groundwater flow pattern. The groundwater flows towards the Sambhar Lake from north to south in the Mendha River catchment and south to north in the Rupanghar River catchment.
Historical water spread areas were mapped using remote sensing and GIS techniques, covering the period from 1990 to 2023. The largest water extent observed was approximately 152.26 square kilometers in 1996, while the smallest recorded area was 55.94 square kilometers in 2000, with an average water extent of approximately 100.2778 square kilometers (Figure 11).
The modeling outcomes indicate that, within these projected timeframes, the maximum floodwater depth is estimated to be around 1.5 meters, with certain locations experiencing depths of less than 2 meters. These outcomes of hydrological modeling reveal that changes in water level will have a minimal impact on the wetland’s hydrological dynamics.
It can be safely said that the sudden change in water level was a one-time disaster and there is no such immediate risk for the same as far as Lake hydrology is concerned.
Acknowledgment
The analysis done by digital services provided by Geo Climate Risk Solutions Pvt Ltd, the author acknowledges their contribution to the same.
Conflict of Interests
The author declares that no financial or conflict of interest exists.
References
- Bhukosh, GSI, https://bhukos.gsi.gov.in/Bhukosh/MapViewer.aspx.
- CGWB (2017) Aquifer Mapping and Ground Water Management Plan, Jaipur District, Rajasthan, Central Ground Water Board, Ministry of Water Resources. River Development and Ganga Rejuvenation, Government of India, Western Region, Jaipur.
- CGWB (2017) Aquifer Mapping and Ground Water Management Plan, Sikar District, Rajasthan, Central Ground Water Board, Ministry of Water Resources. River Development and Ganga Rejuvenation, Government of India, Western Region, Jaipur.
- CGWB (2017) Aquifer Mapping and Ground Water Management Plan, Nagaur District, Rajasthan, Central Ground Water Board, Ministry of Water Resources. River Development and Ganga Rejuvenation, Government of India, Western Region, Jaipur.
- CGWB (2017) Aquifer Mapping and Ground Water Management Plan, Ajmer District, Rajasthan, Central Ground Water Board, Ministry of Water Resources. River Development and Ganga Rejuvenation, Government of India, Western Region, Jaipur.
- Jain SK, Kumar S, Varghese J (2001) Estimation of soil erosion for a Himalayan watershed using GIS technique. Water Resources Management 15:41-54.
- Monali Sen, Kavita Singh (2023) Avian botulism mass mortality from Sambhar Salt Lake, Rajasthan, India. Current Science 124(4): 403-406.
-
Monali Sen*. Hydrology Report of Sambhar Lake: A Safe Haven Past Disaster Recovery. Adv in Hydro & Meteorol. 2(1): 2024. AHM. MS.ID.000526.
-
Hydrology; Sambhar Lake; Migratory birds; Flora; Fauna; Landscape; Rainfall; Saltwater; Biodiversity; Groundwater; Temperature; Ponds: Irrigation
-

This work is licensed under a Creative Commons Attribution-NonCommercial 4.0 International License.


