 Case Report
Frontal Structure of the Explosive Extratropical Cyclone Xola Based on ERA5 and Observations
Margarida Belo Pereira* and Paulo Pinto
Department of Meteorology and Geophysics, Portuguese Institute of the Sea and Atmosphere IP, Rua C do Aeroporto
Margarida Belo Pereira, Department of Meteorology and Geophysics, Portuguese Institute of the Sea and Atmosphere IP, Rua C do Aeroporto.
Received Date:April 04, 2025; Published Date:July 02, 2025
Abstract
On 23 December 2009, the rapidly developing extratropical cyclone Xola hit mainland Portugal. As Xola approached the Iberian coast, satellite images revealed several features typical of Shapiro-Keyser (S-K) cyclones, such as a prominent cloud head and a dry slot, highlighted by the satellite images. As previously documented, this extratropical cyclone caused damaging winds in two distinct regions of mainland Portugal. The present article analyses the frontal structure of this depression. The frontal zones are identified using the potential temperature, the equivalent potential temperature and the thermal frontal parameter derived from the ERA5 reanalysis. This assessment was also complemented with satellite data and surface observations. In addition, this article establishes the link between frontal zones and precipitation patterns. This assessment provides evidence that Xola developed a split cold front structure, which is favored when the dry intrusion overtakes the warm conveyor belt, producing an upper cold front (or moisture front) several kilometers ahead of the cold front at the surface. In the southern region of mainland Portugal, this humidity front favoured the development of a cumulonimbus line, which caused heavy showers, with hourly rainfall of more than 25 mm. By contrast, in the northern region of mainland Portugal, the Xola depression was responsible for only light precipitation, mainly due to the passage of the cloud head.
Keywords:Extratropical cyclone; Heavy precipitation; Frontal systems; Cold front; ERA5, Portugal; Convective clouds
Introduction
Extratropical cyclones, and in particular explosive cyclones, are known to cause damaging winds [1]. These strong winds can occur associated with three low-level jets: the warm conveyor belt (WCB), the cold conveyor belt (CCB), and the sting jet [2]. Previous studies showed that the most damaging winds are associated with the sting jet, which is located on the rear, equatorward flank of rapidly developing storms [3]. However, not all extra-tropical cyclones give rise to sting jets. Various studies [2, 3] have shown that sting jets are associated with Shapiro–Keyser cyclones [4]. Along their life cycle, these cyclones exhibit a frontal fracture (stage II), when the cold front loses contact with the warm front, and a frontal T-bone (stage III), when the cold and warm fronts are nearly perpendicular [4]. Browing et al [5] showed that the frontal fracture and dry intrusion are caused by the descent of upper-level tropospheric and lower stratospheric cold and dry air into the middle and low tropospher ic levels within a developing tropopause fold. This dry intrusion, which plays a key role in the life cycle of the extratropical cyclones, is identified as a dry slot in water vapor satellite images. At stage III of S-K model, an extensive cloud wrapping around the poleward side of the cyclone core, defined as the cloud head, becomes well defined. Finally, at stage IV, the cold air in the dry slot encircles the cyclone centre, leading to the warm seclusion, when warm air is surrounded by the tail of the bent-back front and the associated tip of the cloud head [4].
Precipitation patterns associated with extratropical cyclones are strongly influenced by their frontal structure. In particular, when the dry intrusion overruns a surface cold front (SCF) it creates a split cold front structure, where an upper cold front (UCF) forms at the leading edge of the dry intrusion, several kilometres ahead of the SCF [6, 7]. The region between the SCF and the UCF, known as the shallow moist zone, is characterized by cloudless or/ and shallow cloud areas and light precipitation. On the other hand, squall lines commonly develop along the UCF [7]. As behind the UCF, the relative humidity decreases abruptly, UCF is often named humidity front [6].
On 23 December 2009, the rapidly developing extratropical cyclone Xola struck mainland Portugal, causing damaging winds north of Lisbon and in southern Portugal. In the southern region, the damaging winds were caused by a bow echo embedded in a squall line [8]. This previous study described the life cycle of the depression, focusing on the mesoscale phenomena that caused the damaging winds in Portugal, in particular the sting jet. The present article analyzes the frontal structure of extratropical cyclone Xola, using ERA5 [9] reanalysis data and observational data, trying to establish a link with precipitation patterns.
The Frontal Structure
Since the 60s to nowadays, the thermal front parameter (TFP) has been used to diagnose atmospheric fronts [10, 11]. This parameter is a directional derivative that evaluates changes in the gradient of a pertinent thermodynamic variable, in the direction of the gradient [10]. In general, the thermodynamic variable chosen is the potential temperature (θ) or equivalent potential temperature (θe) at 850 hPa [11]. In the present study, the TFP is derived from the ERA5 data. The version using θ is referred to as TFP and and the one using θe is denoted TFPe. Often, the front is placed where the TFP (or TFPe) exceeds a certain threshold [11].
At 0100UTC on 23 December 2009, the ERA5 winds at 850hPa show a cyclonic circulation to the west of the Iberian Peninsula, with maximum wind speeds exceeding 70kt. The potential temperature shows a wide warm sector (θ>296K) over the eastern Atlantic to the southwest of the Iberian Peninsula. TFP shows two longitudinal maxima associated with two warm fronts, one crossing northern Portugal and other elongating from the depression center to southern Iberia (Figure 1). The first (named WFo) will dissipate in the next few hours and the second (named WFn) will strengthen on its path towards the Iberian Peninsula. In south region of mainland Portugal, ahead of the warm front several stations registered heavy precipitation. West of 12°W, a cold front is also visible on TFP (Figure 1).
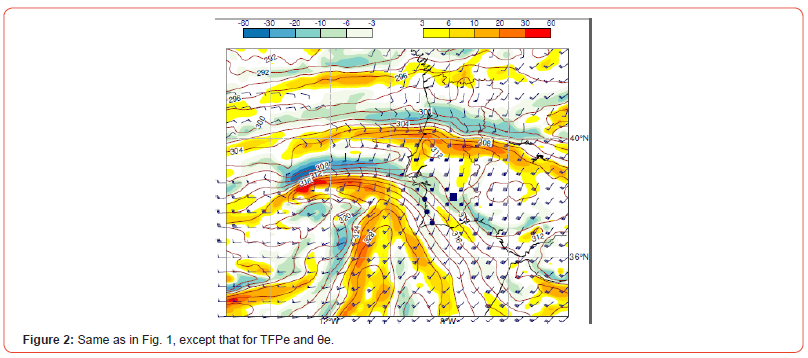
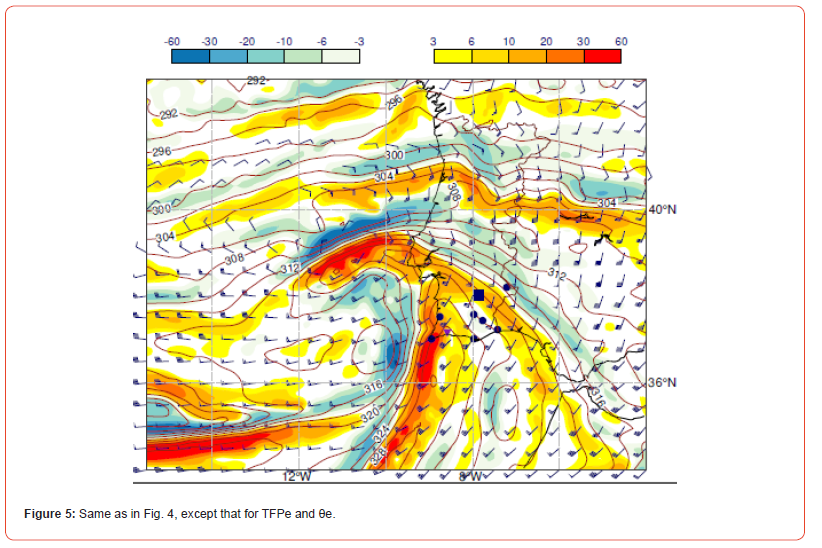
The warm fronts mentioned above are also marked in the TFPe (Figure 2). However, the TFPe highlighted two other areas of strong baroclinicity to the southwest of the Iberian Peninsula, which reflects sharp contrasts in θe. These differences between TFP and TFPe in these areas are explained by large gradients in the humidity field.
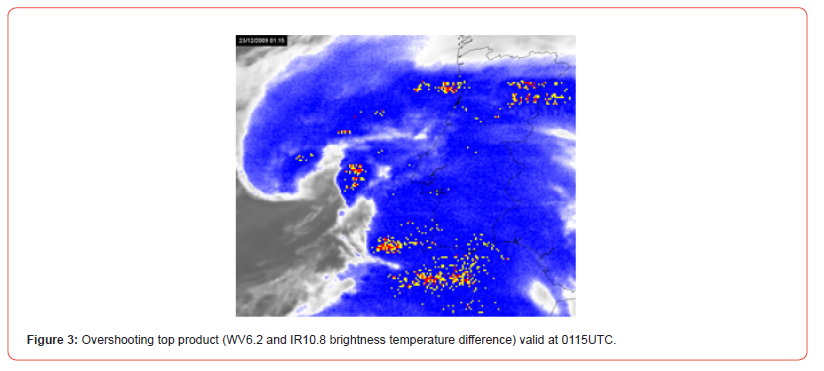
At 0115UTC, the cloud head and the dry intrusion are clearly visible on the satellite image. Ahead of the dry slot, an area of convective clouds is also evident, highlighted by the overshooting (yellow and red areas). Two other areas of convective clouds are discernible in the north of mainland Portugal and to the south and southwest of Portugal (Figure 3).
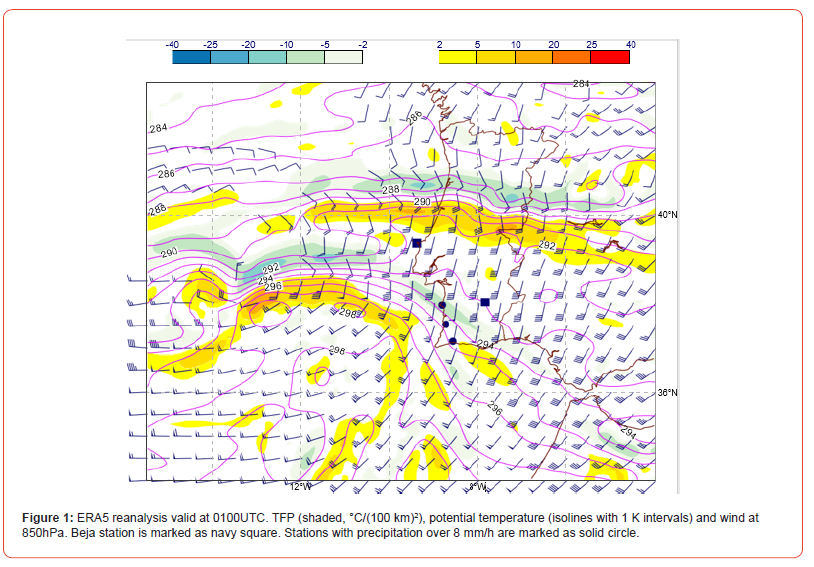
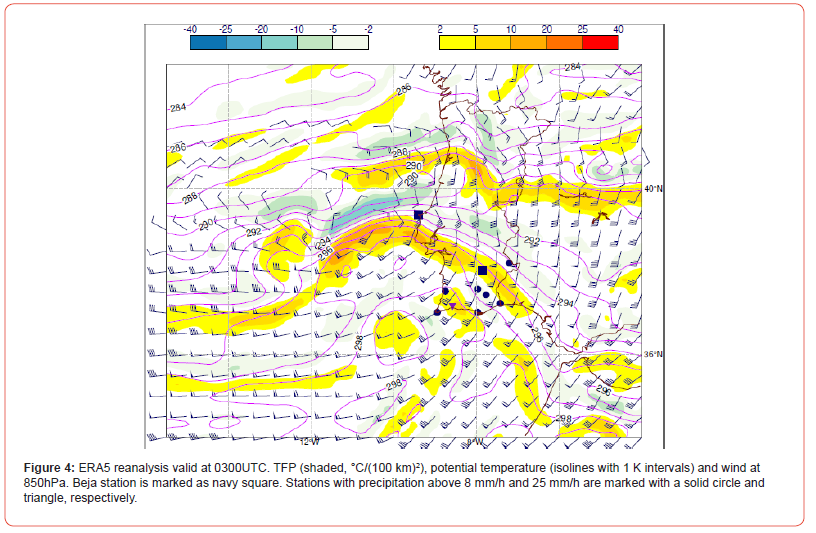
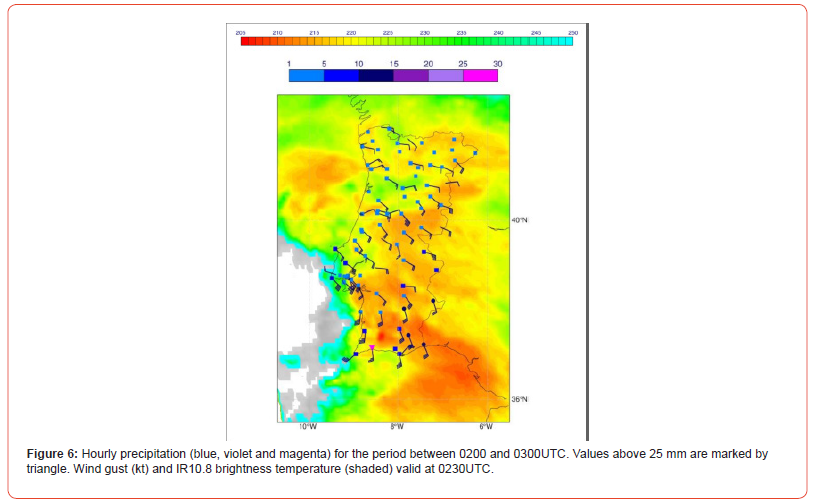
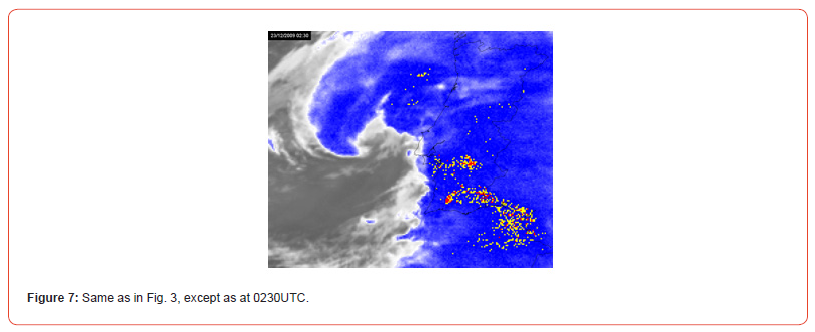
In the following two hours, the warm front WFn crosses southern Portugal (Figure 4 and 5), traversing Beja station (location in Figure 4), and the IR10.8 brightness temperature reveals very cold cloud tops (<215K) in the region at 0230UTC (Figure 6), suggesting the presence of deep convection, which is confirmed by the overshooting product (Figure 7) and by the heavy precipitation registered in the stations (Figure 6). The highest observed value (25.7 mm) was caused by a bow-echo, which caused also damaging winds, as documented in [8].
t is worthwhile mention that, at 0300UTC, south of 39°N, TFPe display a strong dipole with high positive values near the coast of the southwestern part of mainland Portugal, and negative values behind, in the area of lower θe, suggesting the presence of a cold front (Figure 5). This signature is also noticeable in the upper levels (not shown). However, this signature is not visible on TFP and θ (Figure 4). In addition, west of 12°W, the pattern of TFP and θ in low levels (925 and 850hPa) suggest the presence of a cold front nearly 150km to west of the cold front depicted in Figure 5. This configuration resembles the structure of a split cold front, where the upper cold front (or humidity front) develops in the warm sector, several kilometres ahead of SCF [6, 7].
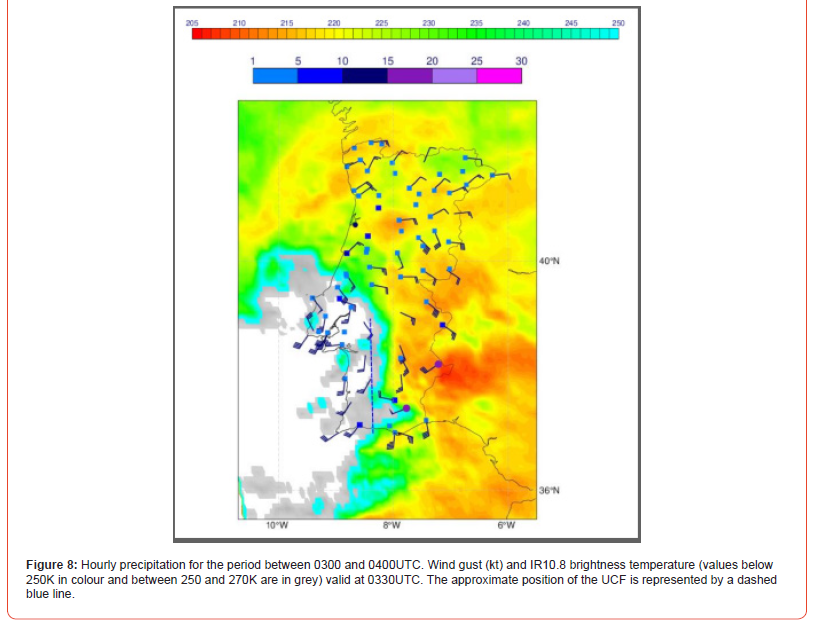
At 0230UTC, the warm front is identifiable by the shift between easterly winds (with gusts of 20kt) and southerly winds with gusts between 30 and 40kt, in the southern region of mainland Portugal (Figure 6). Over the next hour, the centre of the Xola depression approached mainland Portugal and ahead of the cloud head, the wind turned from southeast to southwest, with gusts of 40kt (compare Figure 6 and Figure 8). In the southern region, convective clouds can be seen inland and shallow clouds or clear sky prevail on the coast. This contrast, also apparent in the wind direction, signals the humidity front (Figure 8).
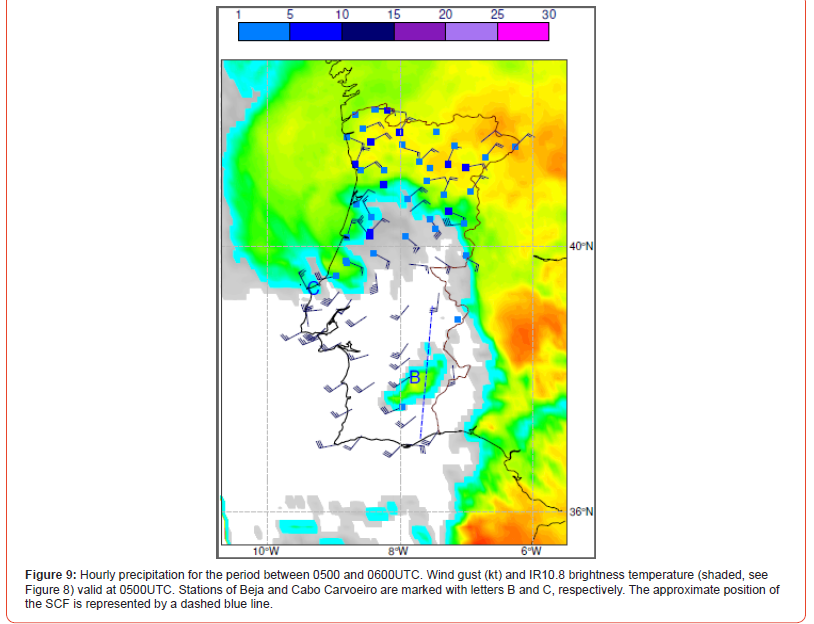
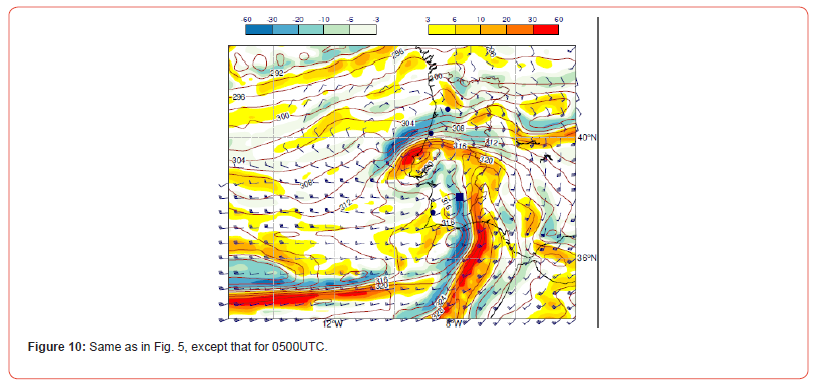
Over the next 50 minutes, the Xola depression reached its minimum mean sea level pressure (MSLP), 969.4 hPa, and at 0450UTC the stations recorded the maximum gust of wind, 39 ms-1 (80kt), coinciding with the passage of the tip of the cloud head, as documented in [8], which was associated with a sting jet. At 0500UTC, the dissipating cloud head is causing light precipitation in the northwest region of mainland Portugal, in addition, at that time, the strongest gust (65kt) is registered at Cabo Carvoeiro (see location in Figure 9) and the centre of the depression is clearly identifiable by the cyclonic circulation to the northeast of Cabo Carvoeiro (Figure 9). At this time, according to ERA5, the depression centre is slightly to the west of Cabo Carvoeiro and a warm seclusion centred over Cabo Carvoeiro is apparent (Figure 10). Thus, the depression centre represented by ERA5 is displaced nearly 200km to southwest relatively to the observations.
At 0500UTC, in the southern region, close to the Spanish border, the SCF is identifiable by the shift from south-westerly winds ahead of the SCF to westerly winds behind (Figure 9). It is interesting to note that, to the west and along the SCF, shallow clouds (with warmer tops) and cloud-free areas are visible, favoured by the dry intrusion (white area in Figure 9), contrasting with deep convective clouds embedded in a cloud band just ahead of the humidity front.
Conclusion
On 23 December 2009, the rapidly developing extratropical cyclone Xola hit mainland Portugal, causing damaging winds. The strongest winds were associated with a sting jet, near the hooked tip of the cloud head [8]. The present study complements the previous study by Pinto and Belo-Pereira [8] and it corroborates that the heavy rainfall registered in southern Portugal occurred in the warm sector, due to a squall line developed ahead of an upper cold front (or humidity front).
Finally, it shows that ERA5 misrepresents Xola’s trajectory over the west of the Iberian Peninsula, placing the depression centre nearly 200 km southwest of the position indicated by the observations.
Acknowledgement
None.
Conflicts of Interest
None.
References
- T Hewson, U Neu (2015) Cyclones, windstorms and the IMILAST project. Tellus A p. 67A.
- P Clark, S Gray (2018) Sting jets in extratropical cyclones: A review. Q J R Meteorol Soc 144: 943-969.
- N Hart, S Gray, P Clark (2017) Sting-Jet Windstorms over the North Atlantic: Climatology and Contribution to Extreme Wind Risk. J Clim 30: 5455-5471.
- MA Shapiro, D Keyser (1990) Fronts, Jet Streams and the Tropopause in Extratropical Cyclones. The Erik Palmén Memorial Volume, Boston, MA, USA. American Meteorological Society pp.167-191.
- KA Browning, SP Ballard, CS Davitt (1997) High-Resolution Analysis of Frontal Fracture. Mon Weather Rev 125: 1212-1230.
- KA Browning, GA Monk (1982) A Simple Model for the Synoptic Analysis of Cold Fronts. Q J R Meteorol Soc 108: 435-452.
- KA Browning (1986) Conceptual Models of Precipitation Systems. Weather Forecast 1: 23-41.
- P Pinto, M Belo-Pereira (2020) Damaging Convective and Non-Convective Winds in Southwestern Iberia during Windstorm Xola. Atmosphere 11: 692.
- H Hersbach, B Bell, P Berrisford, S Hirahara, A Horányi, et al. (2020) The ERA5 global reanalysis. Quarterly Journal of the Royal Meteorological Society 146(730): 1999-2049.
- LC Clarke, R Renard (1966) The U. S. Navy Numerical Frontal Analysis Scheme: Further Development and a Limited Evaluation. J Appl Meteorol 5: 764-777.
- F Soster, R Parfitt (2022) On Objective Identification of Atmospheric Fronts and Frontal Precipitation in Reanalysis Datasets. J Climate 35: 4513-4534.
-
Margarida Belo Pereira * and Paulo Pinto. Frontal Structure of the Explosive Extratropical Cyclone Xola Based on ERA5 and Observations. Adv in Hydro & Meteorol. 3(1): 2025. AHM.MS.ID.000555.
-
Extratropical cyclone, Temperature, Precipitation, Cold conveyor belt (CCB), Surface cold front (SCF), Thermodynamic, Satellite, Dipole, Sky, Sea level pressure, Winds, Tropospheric
-

This work is licensed under a Creative Commons Attribution-NonCommercial 4.0 International License.


