 Mini Review
Effect of Climate Change on Annual Rainfall Pattern in Bilbao
María Urrestizala1*, Natalia Alegría1, Igor Peñalva1 and Charles Pinto2
1Energy Engineering Department, Faculty of Engineering, University of the Basque Country, Spain
2Department of Mechanical Engineering, Faculty of Engineering, University of the Basque Country, Spain
María Urrestizala, Energy Engineering Department, Faculty of Engineering, University of the Basque Country, Spain.
Received Date:February 17, 2023; Published Date:February 23, 2023
Introduction
Climate change is increasingly present in our daily concerns, and this has been increased by the negative perception of the current meteorological situation, which is often described as the worst in history. However, it is well known that the analysis of meteorology, and specifically of rainfall, should not be carried out over such short periods of time. In fact, the conclusions obtained in this way may differ considerably from the exhaustive analysis carried out with series of at least 100 years [1].
For this reason, and after collecting data on rainfall in Bilbao, a city located in the north of the Iberian Peninsula from 1871 to 2021 (150 years in total), these data have been analyzed.
Analysis
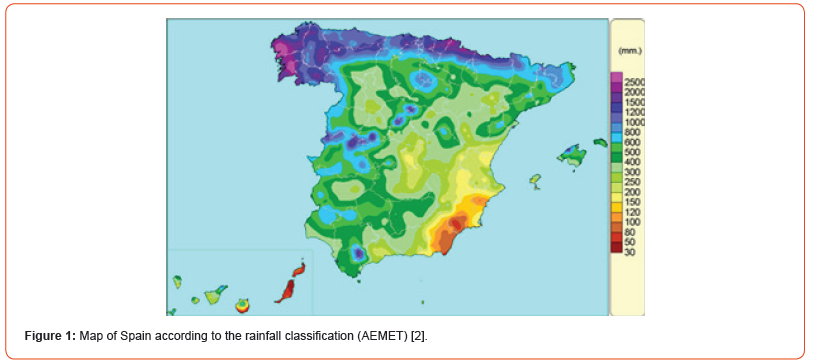
Bilbao is a city located in the north of Spain, 15 km from the Cantabrian coast. As it can be seen on Figure 1, it has a Cantabrian climate, so rainfall is abundant, with an annual rainfall of 1000- 1200 mm (Figure 1).

However, in recent years it has become commonplace to read opinions adverse to these facts, so, in order to check whether this situation is still correct, an analysis has been carried out on the basis of the monthly rainfall data over the 150 years mentioned above, thanks to the data provided by Bilbao Bizkaia Water Consortium [3]. For this purpose, the paper was subdivided into two parts.
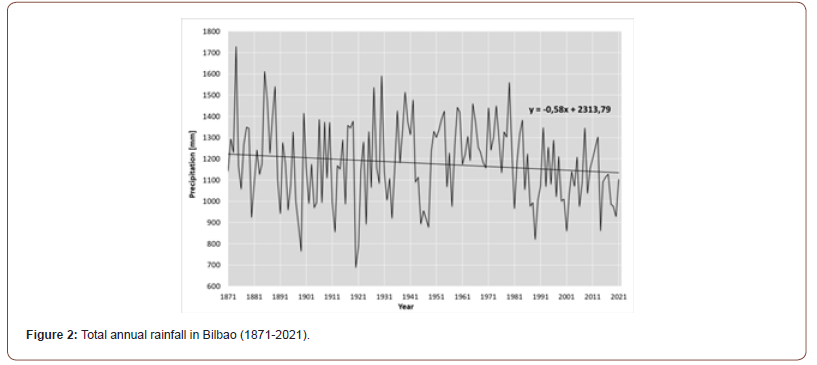
On the one hand, the total annual sum of precipitation was plotted chronologically, and its linear adjustment was calculated (see Figure 2).

Thanks to this graph, different information can be observed. Among other points, it should be noted that the trend line is negative. However, in terms of its value, the slope hardly amounts to 0.58 mm/year, which is practically negligible. It would therefore be incorrect to state that it is raining less and less each year. In fact, such a small slope could be caused by cyclical components. Moreover, looking at the inter-annual variation, it can be seen that in recent years there has been more stability. When looking at the first half of the graph, it is easy to see that there are many more extreme peaks, both maximums and minimums, so the balance was much smaller and the trends more unexpected.
On the other hand, it has been checked whether the recorded data conform to a normal distribution, both in the frequency histogram and in the cumulative frequency histogram (see Figure 3).

Taking this representation into account, it can be observed that the maximum of the distribution is still around 1150 mm. Furthermore, considering a larger range, it can be stated that the total rainfall is in the range of 1050-1250 with a frequency of 50 %, and in the range of 950-1350 mm with a frequency of 70 %. Therefore, if annual rainfall were decreasing, this curve would be shifted to the left year by year.
Conclusion
After this analysis, it can be concluded that, at least to date, a very different pattern of total annual rainfall is not observed in Bilbao, and that total rainfall continues being around 1000 1200 mm/year in spite of the climatic change. The slope of the trend line is negligible, and the normal distribution fits the analyzed data adequately, with the maximum point at 1150 mm.
As future studies, it is proposed to examine the intra-annual variation, which could be affected even though the total quantities remain the same, in order to observe whether the trends are more extreme, and rainfall is concentrated in much shorter periods.
Acknowledgement
The authors would like to thank the Water Hall “CABB” (The Bilbao Bizkaia Water Consortium (CABB, in Spanish), a Business Hall located at the Faculty of Engineering, Bilbao, where data to make this revision related to energetic generation along the water supply system of Greater Bilbao were available.
Conflict of Interest
No conflict of interest.
References
- Aguirre Jaime A (1994) Introduction to the treatment of time series, Madrid, Spain, Ediciones Diaz de Santos.
- (AEMET) Agencia Estatal de Meteorología aemet.
- (CABB) Consorcio de Aguas Bilbao Bizkaia CABB.
-
María Urrestizala*, Natalia Alegría, Igor Peñalva and Charles Pinto. Effect of Climate Change on Annual Rainfall Pattern in Bilbao. Adv in Hydro & Meteorol. 1(3): 2022. AHM.MS.ID.000514.
-
Climate change, Rainfall, Meteorological situation, Annual Rainfall Pattern, Rainfall data
-

This work is licensed under a Creative Commons Attribution-NonCommercial 4.0 International License.


