 Research Article
A Short Communication on Flood Hazard Mapping in Japan
Guangwei Huang*
Sophia University, 7-1, Kioicho, Chiyoda-ku, Tokyo, 102-8554, Japan
Guangwei Huang, Sophia University, 7-1, Kioicho, Chiyoda-ku, Tokyo, 102-8554, Japan.
Received Date:July 24, 2024; Published Date:August 02, 2024
Introduction
Flooding has been affecting our life since ancient time [1]. With rapid urbanization and climate change in recent decades, flood risk management is gaining more importance than ever before.
A powerful tool in flood risk analysis and management is flood hazard mapping (FHM), which has undergone significant development in terms of method and application to provide engineers, policymakers and stakeholders with accurate prediction and identification of flood-prone or susceptible areas. [2] reviewed modelling approach es in FHM. [3] presented a thorough and current review of the physically-based, empirical, and physical modelling methods in FHM. [4] provided another review aimed at helping modelers and practitioners to select the most suitable flood hazard assessment method for the case study of interest.
In Japan, the amendment of the Flood Control Act in 2001 obliged municipalities to prepare flood HMs. At present, 98% of municipalities have prepared flood hazard maps [5]. Differently from flood hazard maps in other countries, there are several types of flood hazard mapping in Japan, which is little known to the world out of Japan. The present study presents a briefing on three types of flood hazard mapping in Japan.
Flood Hazard Mapping
Flood hazard maps identify areas of potential flooding. Three types of flood hazard maps used in Japan are explained below.
Design-rainfall based flood hazard map
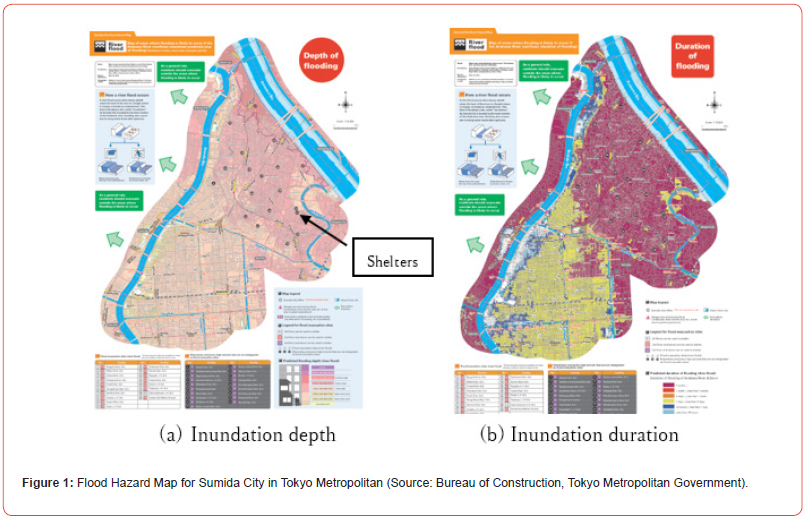
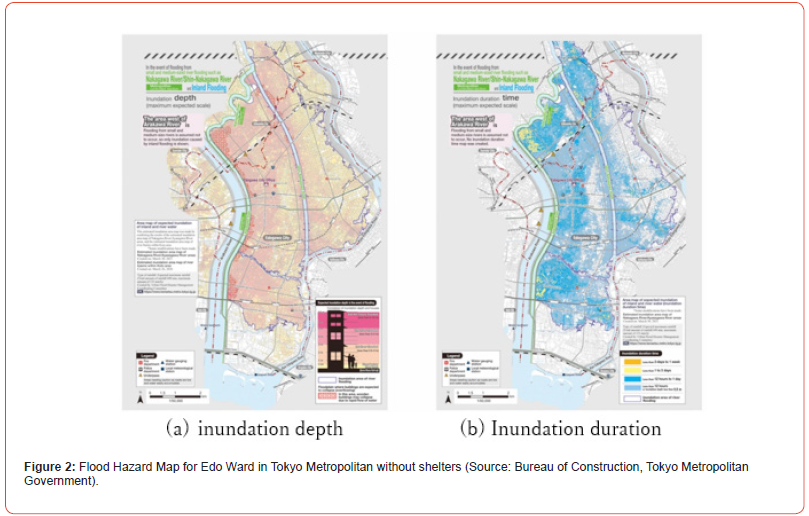
From 2000 to 2015, municipalities were engaged in making flood hazard map based on design rainfall. The design rainfall can have a return period of 50, 100 or 200 years depending on the importance of a river course. By 2012, more than 90% of municipalities completed their flood hazard mapping. Figure 1 is a flood hazard map for Sumida City in Tokyo Metropolitan. It contains potential inundation depth distribution, evacuation shelters (Fig.1(a)), and inundation duration (Fig. 1(b)). However, as shown in Fig. 2, some municipality does not include emergency shelter locations in flood hazard map. Instead, information such as addresses of shelters, flood warning system and brie explanations of flood mechanism are distributed to residents together with maps. Therefore, flood hazard map in Japan may be renamed as flood hazard pamphlet or book.
The worst-case mapping
In response to climate change, the Flood Control Act of Japan was amended again in 2015, stipulating the need to prepare flood hazard map for the largest possible rainfall (worst case).
Based on rainfall patterns, the whole Japan is divided into 15 regions, and Depth Area-Duration (DAD) analysis is performed using recorded maximum rainfall in each region. Then, the worstcase flood hazard map was developed using the largest possible rainfall as input to conduce flood inundation simulation. Indeed, the average basin rainfall estimated from DAD analysis exceed or equivalent to 1000-year return period event [6].
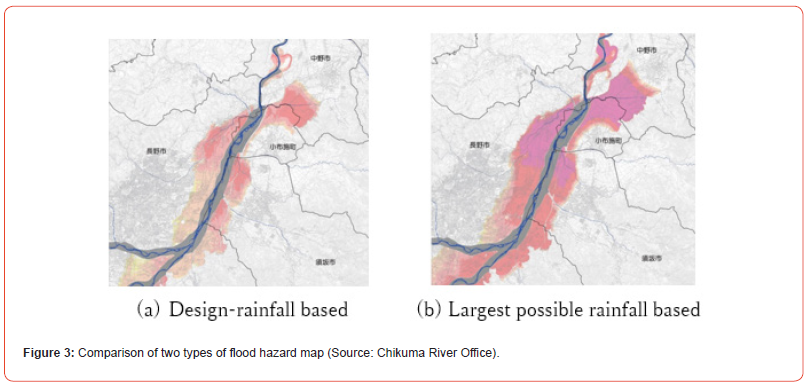
By now, mapping completion rates for design-rainfall and the largest expected rainfall scenarios are 98% and 83%, respectively.
House damage-focused hazard map
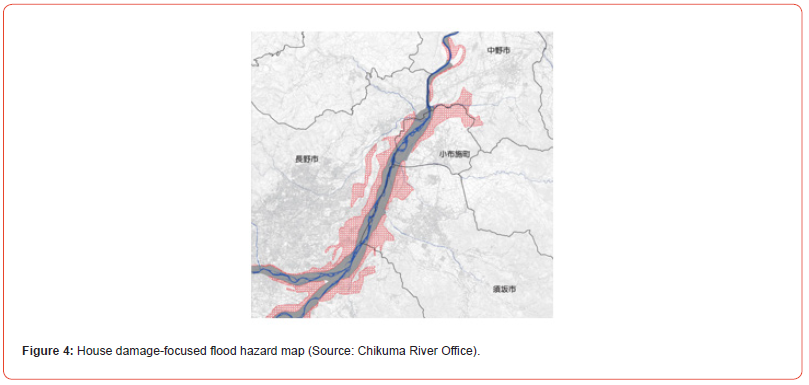
Another type of flood hazard map shows areas where houses are expected to collapse or severely damaged. As shown in Fig. 4, it identifies the red zones of an inundated area. Since there many wooden houses along rivers in Japan, house-damage oriented flood hazard map helps administration to make an effective emergency response plan and can also raise the awareness of residents. It is a unique attribute of flood hazard mapping in Japan.
Conclusion
The current flood hazard mapping in Japan can be characterized as extreme scenario-centered. The consideration of extreme rainfall and extreme damage zone is an innovation in flood risk management and makes flood hazard mapping in Japan a good model for other countries to apply and it also serves as a platform for further improvement.
Acknowledgement
None.
Conflict of interests
No Conflict of Interest.
Funding
None.
References
- Huang GA (2014) Comparative Study on Flood Management in China and Japan. Water 6: 2821-2829.
- Teng J, Jakeman AJ, Vaze J, Croke BFW, Dutta D, et al. (2017) Flood inundation modelling: A review of methods, recent advances and uncertainty analysis. Environmental Modelling & Software 90: 201-216.
- Rofiat Bunmi Mudashiru, Nuridah Sabtu, Ismail Abustan, Waheed Balogun, (2021) Flood hazard mapping methods: A review. Journal of Hydrology 603, Part A.
- Maranzoni A, D'Oria M, Rizzo, C (2023) Quantitative flood hazard assessment methods: A review. Journal of Flood Risk Management 16(1): e12855.
- Cabinet Office (2018). White Paper on Disaster Management.
- Chikuma River Office.
- Tokyo Metropolitan.
-
Guangwei Huang*. A Short Communication on Flood Hazard Mapping in Japan. Adv in Hydro & Meteorol. 2(1): 2024. AHM. MS.ID.000527.
-
Flooding; Rapid urbanization; Climate change; Flood; Rainfall; River; Depth Area-Duration (DAD); House damage
-

This work is licensed under a Creative Commons Attribution-NonCommercial 4.0 International License.


