 Research Article
Identification of Disulfidptosis-Related Subtypes, Prognosis Model and Cerna Network in Breast Cancer
The Third Affiliated Hospital, Southern Medical University.
Received Date: September 14, 2024; Published Date: October 02, 2024
Abstract
Background: In females, breast cancer (BRCA) has the greatest incidence rate and the second-highest fatality rate after lung cancer and has a poor treatment and prognosis. Disulfidptosis is a new cell death modality that may be critically involved in cancer activities, but its role in BRCA is still a gap.
Methods: A consensus clustering method was used for typing studies based on two datasets, TCGA-BRCA and GSE42568. The prognosis model was constructed via Cox and LASSO algorithms. CIBERSORT and ESTIMATE algorithms performed immune infiltration analysis. The decision tree (DT) algorithm was used to select the disulfidptosis-related characteristic lncRNAs (DRCLs), and a ceRNA regulatory network was constructed.
Results: We obtained three different patterns of typing associated with BRCA, disulfidptosis-related genes (DRGs) typing, differentially expressed genes (DEGs) typing, and immunophenotyping, respectively. A disulfidptosis-related prognosis model was then constructed based on ten disulfidptosis-related lncRNAs (DRLs), and risk score = (-0.4947) * EXOC3-AS1 + (-1.2248) * LINC00115 + (0.2774) * SNHG15 + (1.1798) * RASGRP3- AS1 + (1.4346) * AC108693.2 + (0.6718) * AC016065.1 + (-1.9370) * AL157756.1 + (0.8004) * YTHDF3-AS1 + (-2.2129) * AL139124.1 + (-0.4878) * AL121832.2. And the model had good predictive performance in BRCA. Finally, we identified two key DRCLs, LINC00115 and SNHG15, combined with the DT algorithm. Online databases predicted the miRNA and mRNA targets downstream of LINC00115 and SNHG15, and two disulfidptosisrelated ceRNA networks were constructed.
Conclusions: Our results are the first to confirm the role of disulfidptosis in the development of BRCA. Disulfidptosis involves molecular typing, prognosis, and ceRNA network regulation in breast cancer. These will help further our understanding of disulfidptosis and provide new directions for improving BRCA prognosis and immunotherapy.
Keywords: Disulfidptosis; breast cancer; subtypes; prognosis model; ceRNA
Introduction
In females, breast cancer is the most common cancer with the highest incidence. In addition, breast cancer is the second leading cause of cancer death among women [1]. At present, the treatment of breast cancer includes surgery, chemotherapy, biologically targeted therapy, and other treatments. However, the resistance of some patients continuously increases after treatment, and the recurrence rate is also high, making maintaining the long-term survival of patients a significant challenge. According to a statistical study from 2022, the mortality pattern reflects the incidence trend and the mortality rate of breast cancer has declined more slowly in recent years, which indicates that the progress of breast cancer research has been stagnant [2]. The latest statistics from 2023 suggest that although the mortality rate of breast cancer patients is decreasing year by year, the increasing incidence rate may attenuate future progress [3]. Therefore, both the therapeutic efficacy and prognosis of BRCA are not ideal. New biomarkers for immunotherapy and the prognosis of BRCA are urgently needed to improve the treatment and prognosis of BRCA patients.
A recent study [4] has defined a new way of cell death modality, disulfidptosis, which is distinct from necrosis, besides cuproptosis, and may provide a new strategy for cancer therapy. This study demonstrates that tumor cells usually require the high expression of the SLC7A11 at post-transcription level, taking up more cystine to synthesize glutathione to balance the oxidative effects due to their highly active metabolic actions. But ingested cystine must be promptly reduced to cysteine to eliminate cysteine toxicity. Otherwise, the over-accumulated cystine may cause tumor cell death. They reported [5] that clinical studies found that metabolic therapy via glucose transporter inhibitors could trigger a disulfide fatty liver and inhibit cancer growth. In addition, many previous studies [6-8] have shown that disulfides play a significant regulatory role in immune cell recognition, tumor cell activity, and drug resistance in BRCA. Although there have been many previous studies exploring the mechanism of disulfide in breast cancer, it is worth noting that there have not been any studies on the mechanism of disulfidptosis in breast cancer.
Since breast cancer is a heterogeneous disease, tumor typing has crucial implications for achieving better clinical outcomes [9]. A study [10] identified nine breast cancer prognosis-related subtypes using the consensus clustering method based on DNA methylation patterns. Consensus clustering analysis identified three immune infiltration ways with different prognostic and biological features based on ICI patterns [11]. However, no studies have proposed a breast cancer-associated subtype under the disulfidptosis mechanism. LncRNA is a functional regulator that mediates multiple mechanisms and plays critical regulatory roles in various types of cancer growth [12]. For instance, it was found that lncRNA RP11-551L14.4 could inhibit the malignant development of BRCA by inhibiting the expression of miRNA miR-4472 [13]. A study also constructed a prognosis model through six genomic instabilityassociated lncRNAs, which could provide survival prediction for breast cancer patients [14]. Under the mechanism of disulfidptosis, the role of lncRNA in processes such as breast carcinogenesis and metastasis is still a gap. LncRNA TINCR weakens the efficacy of immunotherapy against BRCA via sponging DNMT1 and downregulating MiR-199a-5p through the STAT1-TINCR-USP20- PD-L1 axis [15]. The lncRNA BC069792 functions as a tumor suppressor gene by targeting KCNQ4 in BRCA, which can be done as a new diagnostic indicator and therapeutic target for BRCA [16]. However, the regulatory mechanism of the ceRNA network associated with disulfidptosis in BRCA remains unclear.
In summary, to explore the role of disulfidptosis in BRCA occurrence and development, three modular analyses were mainly performed in this study. First, we used the consensus clustering method to identify disulfidptosis-related subtypes in breast cancer based on three distinct patterns. Next, machine learning methods constructed a breast cancer prognosis model based on 10 DRLs. Finally, the DT algorithm was used to screen the DRCLs, the downstream miRNAs and mRNAs were screened through online databases, and a ceRNA regulatory network was constructed. It is incredibly novel that the contents of this study have never been reported before concerning each other. Our findings will provide academic help in understanding the mechanism of disulfidptosis in BRCA and offer new theoretical support for the prognosis and immunotherapy of BRCA.
Materials and Methods
Source and Preprocessing of Data
Two datasets, TCGA-BRCA and GSE42568, were used in this study. Among them, TCGA-BRCA datasets and clinical data were retrieved from the Cancer Genome Atlas (TCGA) database (https:// portal.gdc.cancer.gov/), totaling 1231 samples, containing 113 normal breast samples and 1118 tumor breast samples. After data in TCGA-BRCA were normalized to fragments per kilobase million (FPKM), the mRNA and lncRNA expression matrices were extracted. GSE42568 gene expression profiles were retrieved from Gene Expression Omnibus (GEO) database (https://www.ncbi.nlm. nih.gov/geo/). This dataset has 121 breast samples, including 17 normal and 104 tumor samples. GSE42568 is from the GPL570 platform, and probe IDs for all genes were converted to gene names with reference to the platform file. After excluding normal samples of TCGA-BRCA and GSE42568, all tumor samples were merged via the “combat” method in the sva (v3.42.0) R package. The merged gene expression matrix normalized the data by the limma (v3.50.3) R package.
Acquisition of Disulfidptosis-Related Genes and Identification of Subtypes
According to the study [4], there are ten disulfidptosisrelated genes (DRGs), namely SLC7A11, SLC3A2, RPN1, NCKAP1, NUBPL, NDUFA11, LRPPRC, OXSM, NDUFS1 and GYS1. Using the Consensusclusterplus (v1.58.0) R package, consensus unsupervised clustering analysis was carried out, and classify patients into two subtypes according to the expression levels of DRGs. Correlations within groups increased after clustering, whereas correlations between groups decreased. Differences in the enrichment of KEGG pathways between the two subtypes were analyzed by GSVA and presented as heatmaps. In addition, ssGSEA analysis was performed to demonstrate which immune cells were differentially expressed in the two subtypes using boxplots. Then, principal component analysis (PCA) was performed according to the expression levels of DRGs. Finally, the difference in DRGs between the two subtypes was obtained by differential analysis, and the survival curves of the two subtypes were obtained by survival analysis.
Identification of Differential Genes in Different DRGs Subtypes, Consensus Clustering Analysis
First, we identified genes that were differentially expressed in the two subtypes of DRGs, and the genes with P < 0.05 and |logFC| > 1.5 were regarded as differentially expressed genes (DEGs) of the two subtypes of DRGs. Through consensus clustering analysis, patients were divided into two subtypes based on the expression levels of DEGs. Then, the differential expression of 10 DRGs on these two subtypes was exhibited by boxplots. Finally, GSVA, ssGSEA, and PCA were performed for these two subtypes of DEGs using the same analysis steps as in the previous section.
Analysis of Disulfidptosis-Related mRNA-lncRNA Co- Expression and Construction of A Prognosis Model
Through co-expression analysis, using P < 0.05 and correlation coefficient |R| > 0.3 as the selecting criterion, we then obtained the disulfidptosis-related lncRNAs (DRLs) co-expressed with DRGs. We subsequently merged the expression profiles of these DRLs and patients’ survival information for subsequent analyses. The DRLs associated with the prognosis of BRCA patients were obtained using univariate Cox regression analysis. After several trials, we randomly split these DRLs in a 4:1 ratio into training and test sets and adopted the LASSO regression algorithm to compress the features to avoid overfitting. Finally, multivariate Cox regression analysis was performed on the training set to construct a disulfidptosisrelated prognosis model based on the ten prognostically valuable DRLs. The risk score for DRLs was reckoned via this formula:
In the formula, DRL_Ci, DRL_Ei and N represent the regression coefficient of each DRL in the multivariate Cox regression analysis, the expression value of each DRL, and the total number of prognosisrelated DRLs, respectively. The median risk score was used to classify patients into high- and low-risk groups. We then evaluated the predictive value of the model by Kaplan-Meier survival curves and scatter plots. Univariate Cox and multivariate Cox regression analyses were used to identify whether these models and other Clinical traits were independent prognostic factors.
Drug sensitivity Analysis
The half maximal inhibitory concentration (IC50) of some anti- BRCA drugs was reckoned using the prophetic (V0.5) software package, set at P < 0.001 as the screening threshold, which excavates potential sensitive medicines for breast cancer patients. Differential expressions of drug sensitivity between high and low-risk groups was presented as boxplots by the Wilcoxon rank-sum test.
Immune Infiltration Analysis and Immunophenotyping
The relative proportions of 22 immune cells in each sample were calculated using the CIBERSORT algorithm. According to the results of immune infiltration analysis, the correlation between immune cells and risk score was explored, exhibited via scatter plots. The correlation between immune cells and 10 DRLs is presented as a heatmap. Each sample’s tumor microenvironment (TME) score was evaluated using the ESTIMATE algorithm. Then the expression differences in the stromal score, immune score, and estimate score between patients in high- and low-risk groups were explored. Obtain two immune subtypes via consensus clustering analysis. Differential analysis was then performed according to the expressed amount of DRGs and immune cells in the two subtypes, both visualized via boxplots. Finally, GSVA and ssGSEA were analyzed on these two immune subtypes.
Identification of Disulfidptosis-Related Characteristic lncRNAs
Decision tree (DT), a commonly used machine learning algorithm in data mining, fits high-dimensional data, can alleviate overfitting globally, and generate local optimal solutions for the model. Feature selection was performed on 178 previously obtained DRLs using the DT algorithm to select the disulfidptosis-related characteristic lncRNAs (DRCLs). We set overall > 3.5 as the screening threshold, where overall is the importance score. By taking the intersection of lncRNAs screened out by the DT algorithm and the above ten lncRNAs used to construct the prognosis model, we finally screened out 2 DRCLs.
Construction of ceRNA Regulatory Network
After identifying 2 DRCLs in the previous step, we performed the differential analysis of DRCLs based on TCGA-BRCA datasets. After confirming that DRCLs were differentially expressed between tumor and normal samples, miRNAs of targeting relationship with these 2 DRCLs were screened out via miRCode (http:// www.mircode.org/) and StarBase (https://starbase.sysu.edu. cn/) databases, respectively. Next, the predicted results from the two databases were intersected to obtain the miRNAs of targeting relationship with DRCLs. Before proceeding to the subsequent analysis, we verified the expression of these miRNAs via the dbDEMC database (https://www.biosino.org/dbDEMC/). According to the scientific hypothesis of ceRNA, key miRNAs that satisfy this hypothesis were identified. The target mRNAs of these key miRNAs were screened out via TargetScan (https://www. targetscan.org/) and miRDB (http://www.mirdb.org/) databases, respectively, and the intersection genes of the results of the two databases were made mRNA targets. The differential expression of these mRNAs was verified using the UALCAN (https://ualcan.path. uab.edu/) database, and mRNAs that met the scientific hypothesis of ceRNA were screened out. Finally, the ceRNA regulatory network was drawn by Cytoscape software.
Statistical Analysis
In this study, Pearson’s method was employed for correlation analysis. The log-rank test was used to assess the significance between Kaplan-Meier survival curves. All statistical analyses were performed with R (V 4.1.2) software. *** denoting p < 0.001, ** denoting p < 0.01 and * denoting p < 0.05. P < 0.05 was considered statistical significance.
Results
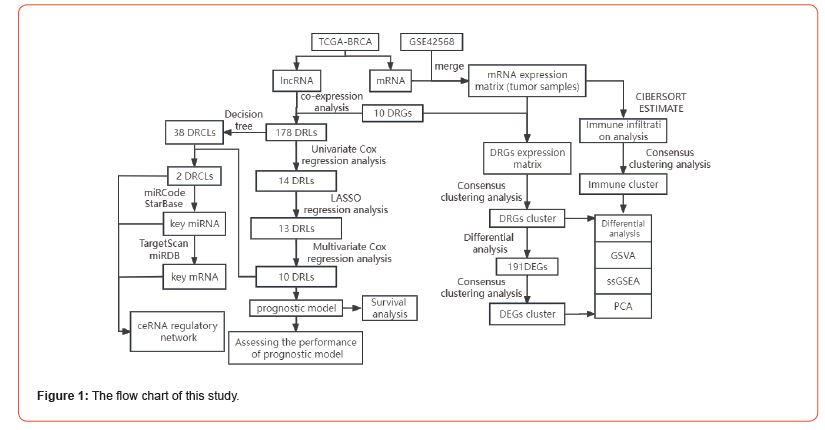
Notably, datasets in two databases, TCGA and GEO, in which the expression data of TCGA-BRCA were separated into mRNA and lncRNA expression profiles, were used in this study. Then, the expression matrix of DRGs was extracted in the merged matrix of TCGA-BRCA mRNA and GSE42568 for subsequent disulfidptosisrelated molecular typing studies. Through TCGA mRNA-lncRNA co-expression analysis, disulfidptosis-related lncRNAs (DRLs) were identified in the TCGA-BRCA lncRNA expression matrix for subsequent construction of disulfidptosis-related prognosis model and ceRNA network. The flow chart of the analysis of this study is shown in (Figure 1).
Identification of Two Subtypes of DRGs
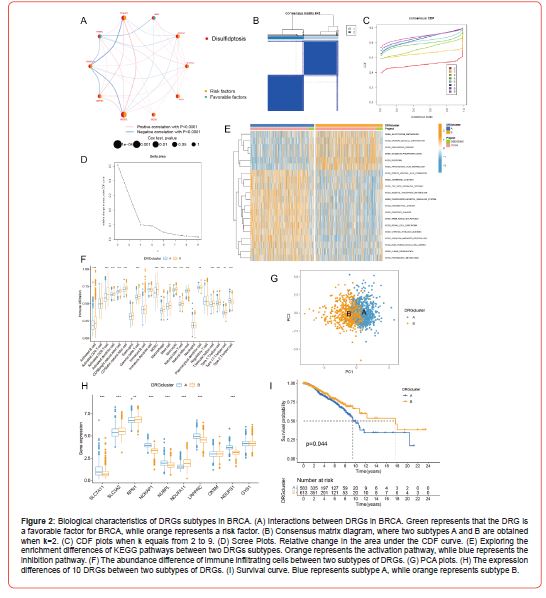
The network diagram (Figure 2A) demonstrates a strong correlation among the 10 DRGs and, in patients with breast cancer, all eight DRGs are risk factors, except NUBPL and RPN1 are favorable factors. All patients were clustered according to the expression profiles of the 10 DRGs by the consensus clustering method. The ideal number of subtypes was two, confirmed by the relative change in consensus matrix plots, cumulative distribution function (CDF) plots, and the area under the CDF curve (Figures 2B-2D). These two subtypes have the names A and B. Through GSVA analysis (Figure 2E), subtype A was markedly enriched in pathways like glutathione metabolism and arachidonic acid metabolism in the KEGG pathway. In contrast, subtype B was mainly enriched in pathways like ubiquitin-mediated proteolysis and inositol phosphate metabolism. Subtype A was enriched primarily on glutathione metabolism. This result suggested that subtype A might be a key subtype involved in the disulfidptosis process in the development of breast cancer.
The ssGSEA results (Figure 2F) revealed significant differences in the expression of most immune cells between subtypes A and B. Interestingly, among the immune cells with differential expression, with the exception of Type 2 T helper cell, which was downregulated in subtype B, other immune cells were significantly upregulated in subtype B. Results of PCA (Figure 2G) showed that different subtypes could be clearly distinguished via the expression levels of DRGs. We then assessed the differential expression of the 10 DRGs between subtypes A and B, and the results (Figure 2H) showed that five DRGs, including SLC7A11 and NCKAP1, were significantly downregulated in subtype B, whereas three DRGs, including SLC3A2 and RPN1, were significantly upregulated in subtype B. Finally, subtype B was found to have a higher probability of survival than subtype A by survival analysis, indicating that subtype B has a better prognosis (Figure 2I).
Consensus Clustering Analysis of DEGs in Different DRGs Subtypes
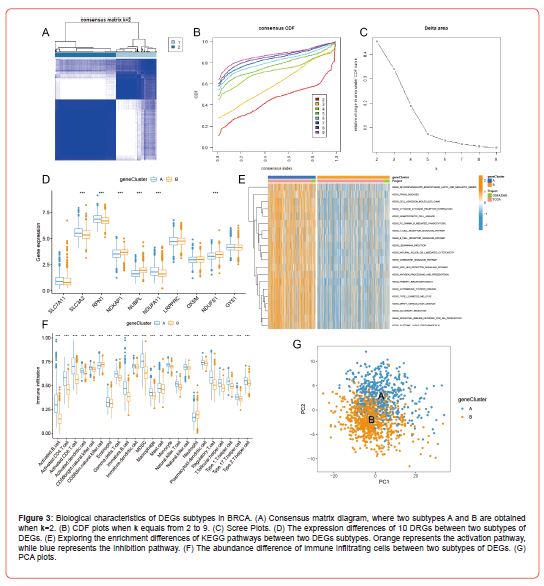
Of the two subtypes of DRGs derived above, we Determined 191 genes that were differentially expressed between the two subtypes via differential analysis. So, we next performed the consensus clustering analysis of these 191 DEGs according to the expression levels of DEGs, which finally resulted in two subtypes, A and B (Figures 3A-3C). We then explored the differential expression (Figure 3D) of the 10 DRGs between these two subtypes and found that SLC3A2, RPN1, and NDUFA11 were significantly upregulated in subtype A, whereas NCKAP1, NUBPL, and NDUFS1 were downregulated considerably in subtype A. Surprisingly, the results (Figure 3E) of GSVA showed that subtype A was highly enriched in the top 20 differentially enriched pathways relative to subtype B, which had multiple immune cell signaling pathways like T and B cell receptor signaling pathways. Looking at boxplots of the ssGSEA results (Figure 3F), we could see that all immune cells were significantly different in relative content between subtypes A and B, and more interestingly, only CD56dim natural killer cell and Neutrophil were less abundant in subtype A than in subtype B. All other immune cells were more abundant in subtype A than in subtype B. Finally, we evaluated the expression patterns of subtypes A and B using the PCA method, which showed good discrimination between subtypes A and B according to the expression levels of DEGs (Figure 3G).
Construction of a Prognosis Model Based on Drls
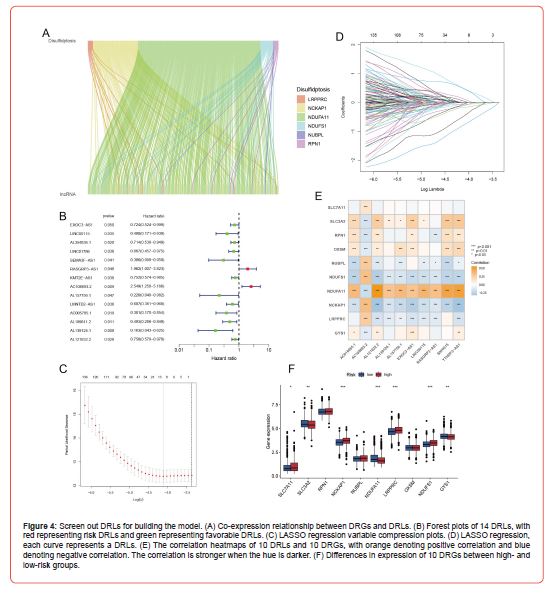
Through TCGA mRNA-lncRNA co-expression analysis, we obtained 178 DRLs (Figure 4A). We next merged the expression profiles of DRLs and patients’ survival information. After several trials that randomly divided these 178 DRLs into training and test sets, we found the optimal ratio of 4:1 for the training and test sets. Fourteen DRLs (Figure 4B) associated with the prognosis of BRCA were screened by univariate Cox regression analysis in the training set samples. We then used LASSO regression to compress the feature variables (Figures 4C&4D), and the best fit was achieved when lambda = 0.01634, and we obtained 13 DRLs with significant prognostic significance. Finally, the DRLs used to build the prognosis model were screened from the above 13 DRLs using multivariate Cox regression analysis, and as a result, 10 DRLs were selected, which were EXOC3-AS1, LINC00115, SNHG15, RASGRP3- Through TCGA mRNA-lncRNA co-expression analysis, we obtained 178 DRLs (Figure 4A). We next merged the expression profiles of DRLs and patients’ survival information. After several trials that randomly divided these 178 DRLs into training and test sets, we found the optimal ratio of 4:1 for the training and test sets. Fourteen DRLs (Figure 4B) associated with the prognosis of BRCA were screened by univariate Cox regression analysis in the training set samples. We then used LASSO regression to compress the feature variables (Figures 4C&4D), and the best fit was achieved when lambda = 0.01634, and we obtained 13 DRLs with significant prognostic significance. Finally, the DRLs used to build the prognosis model were screened from the above 13 DRLs using multivariate Cox regression analysis, and as a result, 10 DRLs were selected, which were EXOC3-AS1, LINC00115, SNHG15, RASGRP3-
Survival Analysis
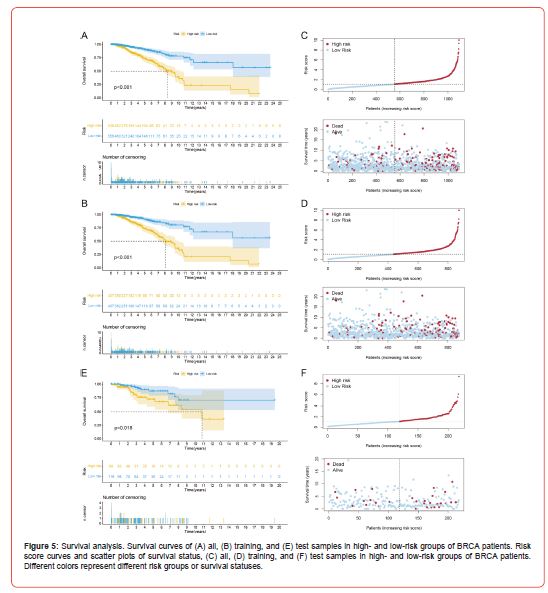
For the prognosis model constructed in the previous section, the expression of 10 DRLs of all breast cancer patients was next substituted into the risk score formula to obtain a risk score for each patient. A median risk score was calculated based on each breast cancer patient’s risk score, and using the median risk score as a cut-off, all BRCA patients were split into high- and low-risk groups. The result (Figure 4F) illustrates the expression differences of 10 DRGs between high- and low-risk patients, among which SLC7A11, NCKAP1, LRPPRC, and NDUFS1 were significantly upregulated in the high-risk group. At the same time, SLC3A2, NDUFA11, and GYS1 were significantly downregulated in the high-risk group. Through survival analysis, the overall survival (OS) curve was plotted to evaluate the survival difference between patients in high- and lowrisk groups. In both the whole sample and the training set samples (Figures 5A&5B), the results revealed that patients in the highrisk group had a considerably poorer prognosis than those in the low-risk group. As the risk score increases gradually, breast cancer patients’ survival time and survival status change accordingly. And they showed that the higher the risk score, the lower the average patient survival time and the greater the danger of death (Figures 5C&5D). We then used the test set samples to test the robustness of this prognosis model, and the evaluation method was consistent with the above. The survival curves (Figure 5E) showed that the high-risk patients in the test set had a significantly worse prognosis than the low-risk patients. The risk curve and scatter plot (Figure 5F) demonstrate that patients have shorter survival times and a higher risk of death as the risk score increases. From this, the test set’s outcomes matched those of the training set, demonstrating that the prognosis model constructed with 10 DRLs could well predict the prognosis of patients with BRCA (Figure 5).
Assessing the Performance of Prognosis Model
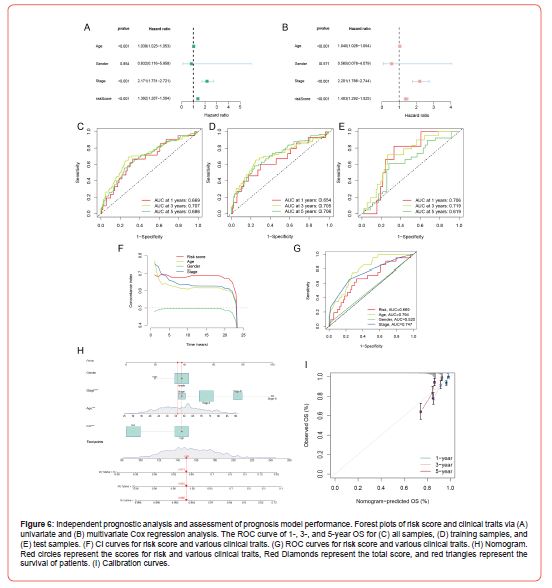
To evaluate the performance of our constructed prognosis model, whether the risk score could be made as an independent prognostic factor for BRCA was first examined by univariate and multivariate Cox regression analysis. Fortunately, the univariate and multivariate Cox regression analysis results (Figures 6A&6B) were consistent. Both indicated that the risk score could be a prognostic factor independent of other clinical traits, which illustrated that the risk score could be an independent prognostic factor for BRCA. Next, we evaluated whether this prognosis model could balance the specificity and sensitivity of breast cancer prognosis by ROC curves and calculated the area under the ROC curve (AUC). The results indicated that this prognosis model had high accuracy, and in all samples (Figure 6C), the AUC for predicting 1-, 3-, and 5-year OS were 0.669, 0.707, and 0.686, respectively. The AUC results for the training and test sets are shown in (Figure 6D) and (Figure 6E), respectively. In addition, compared with the clinical traits, the CI value (Figure 6F) of the prognosis model was the highest, and its AUC value (Figure 6G) was also relatively high, thereby demonstrating the superior prognosis performance of this prognosis model. Finally, we constructed a nomogram by combining partial clinical traits and risk scores, and the overall score was obtained by summing all the scores for each patient’s clinical traits and risk and then substituting them into the nomogram could predict patients’ survival. As shown in (Figure 6H), the total score of this patient was 149, and the probabilities of survival time greater than 1-, 3-, and 5-year were 0.988, 0.935, and 0.874, respectively. The calibration curve (Figure 6I) was utilized to assess the nomogram’s capacity for prediction. The results indicated a high fit of the predicted and actual observed values, thus demonstrating that the nomogram has some predictive power (Figure 6).
Identification of Breast Cancer Associated Sensitivity Drugs
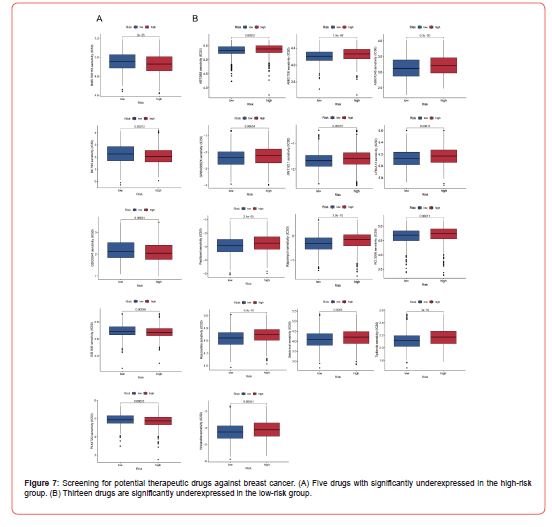
Through drug sensitivity analysis, we calculated the IC50 of some anti-BRCA drugs and explored the expression difference of drug sensitivity between patients in high- and low-risk groups of BRCA. The results (Figure 7A) indicated that BMS.708163, BX.795, GDC0941, OSI.906, and PLX4720 were significantly downregulated in patients in the high-risk group. Whereas 13 drugs (Figure 7B), including Vinblastine, Tipifarnib, and Salubrinal, were significantly upregulated in the high-risk group. The above results show five drugs, BMS.708163, BX.795, GDC0941, OSI.906, and PLX4720, with lower IC50 values in the high-risk group, might be potential therapeutic medications for high-risk patients. In contrast, the other 13 drugs could be appropriate for treating low-risk patients (Figure 7).
Correlation Analysis of Immune Cells and The Risk Score
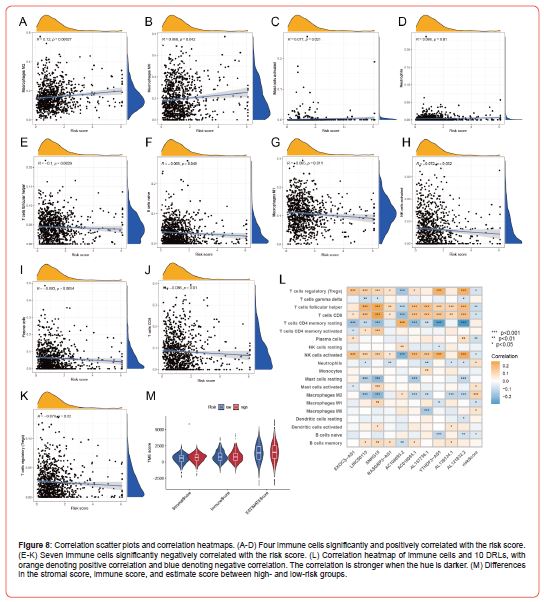
After completing the immune infiltration analysis, we explored the correlation between immune cells and the risk score. A total of four immune cells (Figures 8A-8D), i.e., Macrophages M2, Macrophages M0, Mast cells activated, and Neutrophils, were significantly positively correlated with the risk score. In comparison, seven immune cells (Figures 8E-8K), including T cells follicular helper and Macrophages M1, were significantly negatively correlated with the risk score. In addition, we also explored the correlation between immune cells and 10 DRLs used to construct the prognosis model, and the correlation heatmaps (Figure 8L) showed that all immune cells had some correlation with 10 DRLs. T cells CD8 and 10 DRLs were significantly correlated, except for this immune cell’s significant negative correlation with AC108693.2 and this immune cell’s significant positive correlation with the other nine DRLs. Finally, we evaluated the TME score of every sample via the ESTIMATE method. We explored the expression differences of the stromal, immune, and estimate scores between patients in highand low-risk groups via difference analysis. Unfortunately, only the stromal score showed a significant expression difference between high- and low-risk groups, but there was no discernible difference in the immune and estimate score (Figure 8M).
Immunophenotyping
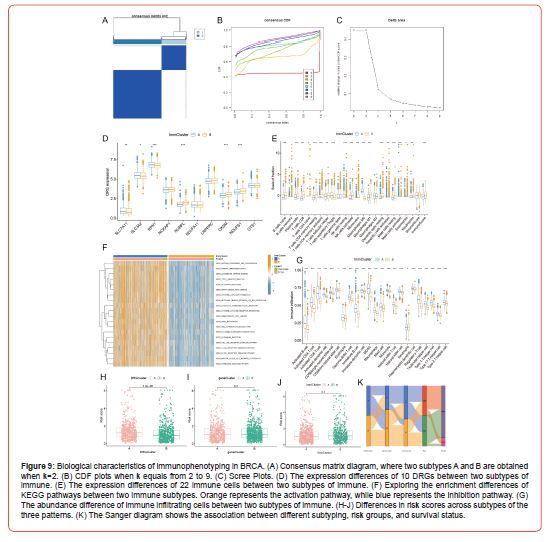
According to the outcomes of immune infiltration, we obtained two immune subtypes, A and B, using consensus clustering analysis (Figures 9A-9C). Through differential expression analysis (Figure 9D) of DRGs in these two subtypes, we found that SLC7A11, SLC3A2, and RPN1 were significantly upregulated in subtype A, whereas NUBPL, OXSM, and NDUFS1 were downregulated. We subsequently explored the differences in expression between the two subtypes and showed that four immune cells (Figure 9E), including NK cells resting and Macrophages M0, were significantly upregulated in subtype A, while 15 immune cells, including Plasma cells and T cells CD8, were significantly downregulated in subtype A. Furthermore, immune scores differed considerably between subtypes A and B, but stromal scores did not. Excitingly, the results of GSVA (Figure 9F) showed striking similarities with those of GSVA of DEGs subtypes, such as subtype A was also highly enriched in the top 20 pathways with enrichment differences compared with subtype B, which also had multiple immune cell signaling pathways like T and B cell receptor signaling pathway, indicating that this immune subtype A and the subtype A of DEGs were closely related.
The results of ssGSEA (Figure 9G) showed that all immune cells were significantly different in relative content between subtypes A and B and that only immune cell Neutrophil was more abundant in subtype B than in subtype A, and all other immune cells were less abundant in subtype B than in subtype A. As it happens, Neutrophil was also more abundant in subtype B than in subtype A in the ssGSEA results of the DEGs subtype. So subtype B of immune typing may closely correlate with the subtype B of DEGs typing. Finally, we assessed the risk score difference among the three subtyping modalities (Figures 9H-9J). And they have indicated that the risk score was significantly different only between the two subtypes of DRGs, but not among the DEGs subtypes and Immune subtypes. The patient typing, patient risk grouping, and patient survival status are presented in the Sanger diagram (Figure 9K).
Identification of DRCLs and Construction of a ceRNA Regulatory Network
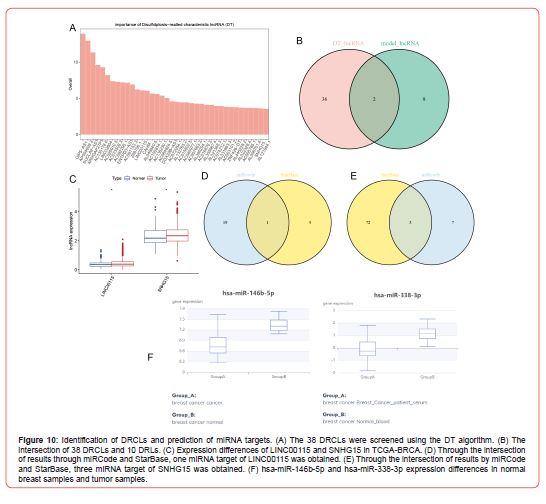
We screened 38 DRCLs (Figure 10A) using the feature selection of 178 DRLs derived from the result of co-expression analysis via the DT algorithm. Then the intersection of these 38 DRCLs and 10 DRLs in which the prognosis model was constructed, we got 2 DRCLs, i.e., LINC00115 and SNHG15 (Figure 10B). Next, we validated these two DRCLs’ expressions in TCGA-BRCA datasets and found that LINC00115 and SNHG15 were more highly expressed in tumor samples than in normal samples in TCGA-BRCA (Figure 10C). Twenty miRNAs with a target relationship with LINC00115 and ten miRNAs with a target relationship with SNHG15 were screened out using the miRCode database. Six miRNAs with a target relationship with LINC00115 were screened out using the Starbase database, and 75 miRNAs with a target relationship with SNHG15 were screened out. Then integrating the screening results from the two databases, we obtained one miRNA target (hsa-miR-146b-5p) of LINC00115 (Figure 10D) and three miRNA targets (hsa-miR-4735- 3p, hsa-miR-338-3p, and hsa-miR-490-3p) of SNHG15 (Figure 10E).
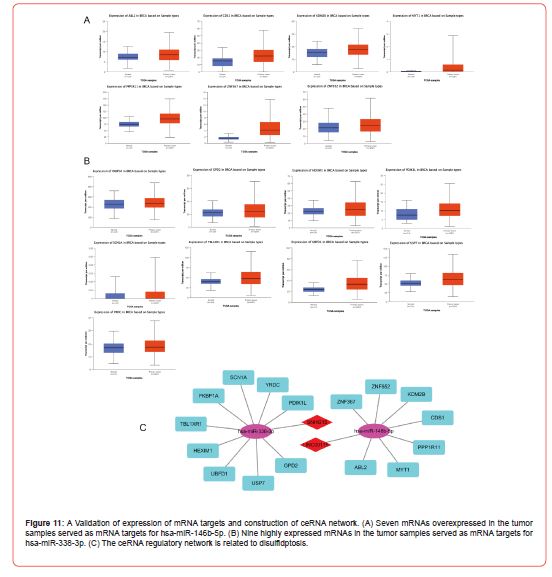
To meet the regulatory relationship between lncRNAs and miRNAs in the ceRNA scientific hypothesis, we validated the expression of these miRNAs using the dbDEMC database and showed that hsa-miR-146b-5p [17] and hsa-miR-338-3p [18] were significantly under expressed in cancer samples (Figure 10F), whereas hsa-miR-4735-3p and hsa-miR-490-3p were overexpressed considerably in cancer samples. According to the ceRNA scientific hypothesis, we should screen out miRNAs that are lowly expressed in tumor samples as miRNA targets for DRCLs, and thus identify hsa-miR-146b-5p and hsa-miR-338-3p as key miRNAs. We screened 17 target genes of hsa-miR-146b-5p and 40 target genes of hsa-miR-338-3p by comprehension of the result of TargetScan and miRDB databases. Then, the differential expression of these target genes was validated using the UALCAN database. According to the hypothesis of ceRNA science, we should screen out mRNAs overexpressed in tumor samples as the key target genes of key miRNAs. Finally, we got seven key target genes of hsa-miR- 146b-5p (Figure 11A) and nine key target genes of hsa-miR-338-3p (Figure 11B). Finally, we got two lncRNAs-miRNA-mRNA regulatory networks that conformed to the hypothesis of ceRNA science. The target relationship of the ceRNA regulatory network was visualized by Cystoscope software (Figure 11C).
Discussion
There are several challenges in BRCA prognosis and treatment. This challenge is caused by numerous factors, including the limited treatment options for some BRCA subtypes, the rise in tumor resistance, and the subpar performance of prognosis models, all resulting in unsatisfactory clinical outcomes [19]. Therefore, it is necessary to study new subtypes of BRCA, discover new sensitive drugs, and construct new prognosis models for improving the prognosis and immunotherapy of BRCA. Disulfidptosis is a new way of cell death. So far, to the best of the authors’ knowledge, no research has revealed the role of disulfidptosis in BRCA. Therefore, we discussed the biological characteristics of three patterns of disulfidptosis-related subtypes in breast cancer to improve the prognosis of BRCA. In addition, we also constructed a prognosis model based on 10 DRLs and a ceRNA regulatory network based on 2 DRCLs. First of all, we obtained the first disulfidptosis-related typing based on the expression of DRGs. Through GSVA, we found that glutathione metabolism was one of the activated pathways of subtype A, and glutathione metabolism was an essential substance in disulfidptosis, indicating that subtype A may have a close link with disulfidptosis.
A study [20] showed that buthionine sulfoximine inhibits glutathione production to specifically cause tumor regression in PI(3)K pathway mutant breast cancer cells. And study [21] into redox pathways in breast cancer and the startling discovery that glutathione peroxidase 2 is important in patient survival and oncogenic signaling. These two studies demonstrate a link between glutathione and breast cancer development. In the ssGSEA results, only Type 2 T helper cell has a higher abundance in subtype A than subtype B. Directly inhibiting spontaneous breast carcinogenesis, CD4+ T helper (Th2) cells cause the cancer cells to differentiate to their final state [22]. Therefore, under the mechanism of disulfidptosis, subtype A may play a significant role in the development of BRCA. We obtained the second disulfidptosisrelated typing according to the expression of DEGs. The result of GSVA showed that subtype A was highly enriched in multiple immune cell signaling pathways like T and B cell receptor signaling pathways.
A dominating gammadelta1 T cell population seen in lymphocytes infiltrating BRCA had a strong inhibitory influence on effector and dendritic cell development and function [23]. B lymphocytes that have infiltrated the tumor in cases of breast cancer group together and go through isotype switching, proliferation, and activation that are regulated by B-cell receptors [24]. It can be seen that subtype A may participate in activities such as breast cancer proliferation. After ssGSEA, we found a high abundance of CD56dim natural killer cell and Neutrophil in subtype B. Low levels of natural killer cell activity were seen in patients due to the targeted apoptosis of circulating CD56(dim) natural killer cells [25]. The primary factor contributing to breast cancer-related death is lung metastasis. The inflammatory microenvironment linked to neutrophils facilitates lung metastasis of tumor cells [26]. This suggests that subtype B may participate in the death process of BRCA cells. The third disulfidptosis-related typing was based on the immunization pattern.
Fortuitously, the immune subtypes shared strong similarities with the GSVA and ssGSEA results for the DEGs subtypes. Subtype A in both tapings was all significantly enriched in multiple immune cell signalings pathways like T and B cell receptor signaling pathways. In addition, Neutrophil in both typing’s was more abundant in subtype B. So the immune typing may have a close correlation with the DEGs typing. Then, we used univariate Cox, LASSO, and multivariate Cox regression analyses, which yielded 10 DRLs with predictive value, i.e., EXOC3-AS1, LINC00115, SNHG15, RASGRP3-AS1, AC108693.2, AC016065.1, AL157756.1, YTHDF3- AS1, AL139124.1, and AL121832.2. Study [27] identified seven m7G-related lncRNAs with predictive value, including LINC00115, and then built a BRCA prognosis model according to these seven lncRNAs. Through sponging miR-381, SNHG15 knockdown eliminated the cisplatin resistance of BRCA, offering a brand-new therapeutic target for the disease [28]. Apoptosis was increased in MCF7 cells, cell proliferation was reduced, and T-47D cells were made more vulnerable to the effects of tamoxifen and trastuzumab.
These effects were all caused by down-regulating RasGRP3 expression in BRCA [29]. Clinically, brain metastases in patients with BRCA are correlated with YTHDF3 overexpression [30]. Study [31] identified three m5C-related lncRNAs with predictive value, including AL121832.2, and a BRCA prognosis model was constructed based on these three lncRNAs. In previous reports, five of the 10 DRLs we screened have shown an association with breast cancer, while the other five have not been reported in any study. Of note, LINC00115 and AL121832.2 of the 10 DRLs were previously reported to be used to construct a prognosis model, which showed that our prognosis model built via the 10 DRLs had sure theoretical support. A risk score was reckoned for every patient based on the model formula, and the median risk score was used to classify patients into high- and low-risk groups. We next explored the expression differences of the 10 DRGs between highand low-risk groups. BRCA cells overexpress SLC7A11 to avoid cell death [32]. When NCKAP1 is silenced, the WASF3 complex becomes unstable, which reduces the ability of BRCA cells to invade [33]. Cell proliferation of SUM159 and MCF-7 cells was significantly enhanced by overexpression of NDUFS1 protein, promoting breast cancer progression [34].
These are consistent with our findings that SLC7A11, NCKAP1, and NDUFS1 are high-risk genes. The ROC curve could show the excellent predictive ability of the model. In all samples, the AUC for predicting 1-, 3-, and 5-year OS were 0.669, 0.707, and 0.686, respectively. In the training set sample, the AUC for predicting 1-, 3-, and 5-year OS were 0.654, 0.705, and 0.706, respectively. In the test set sample, the AUC for predicting 1-, 3-, and 5-year OS were 0.706, 0.719, and 0.619, respectively. It is worth mentioning that this is the first time a BRCA-related prognosis model has been constructed under a disulfidptosis mechanism. In addition, we screened for BRCA-related sensitivity drugs, in which BMS.708163, BX.795, GDC0941, OSI.906, and PLX4720 were determined as therapeutic drugs for high-risk breast cancer patients. Four inhibitors, such as OTSSP167 and BX.795, showed anti-neuroblastoma activity and anti-cancer properties [35]. Potently sensitized by GDC0941 to ABT-737 in BRCA, which increased ABT-737’s anti-cancer effectiveness [36]. Hormone-independent tumor development was more successfully controlled by the ER inhibitor, fulvestrant and OSI.906 when used together than when used separately [37].
However, BMS.708163 and PLX4720 have yet to be reported for the treatment of BRCA, indicating that they may be new drugs for treating BRCA. Finally, we identified 38 DRCLs using the DT algorithm and obtained 2 DRCLs by intersecting with the 10 DRLs used to construct the prognosis model. Two studies [38,39] reported that LINC00115 and SNHG15 were significantly up-regulated in BRCA. These are in line with the outcomes we validated in TCGABRCA. It was innovative to slow BRCA development by targeting the lncRNA SNHG15/miR-451/c-Myc signaling cascade [40]. Then we identified hsa-miR-146b-5p as the downstream miRNA target of LINC00115 and hsa-miR-338-3p as the downstream miRNA target of SNHG15. Both miRNAs were validated to be underexpressed in breast cancer through the dbDEMC database. We continued to screen the mRNA targets of these two key miRNAs, which ultimately resulted in seven targets of hsa-miR-146b-5p and nine targets of hsa-miR-338-3p. Therefore, we obtained two ceRNA regulatory networks that satisfied the scientific hypothesis of ceRNA. These two ceRNA networks have never been reported in previous studies.
This study is highly innovative in examining the role and biological characteristics of disulfidptosis in breast cancer. The present study has three significant contributions: First, three disulfidptosis-related typing based on three different patterns were obtained. Second, a disulfidptosis-related prognosis model was constructed based on 10 DRLs. Third, the DT algorithm was used to screen DRCLs, and two ceRNA regulatory networks were built, which conformed to the hypothesis of ceRNA science. Although the current study is based mainly on public databases, we supply new theoretical evidence for the mechanism of the treatment and prognosis of BRCA.
Conclusions
In summary, three different patterns of disulfidptosis-related typings were identified in BRCA, and the relationships between these typings and DRGs, KEGG pathways, as well as immune cells were explored. In addition, a disulfidptosis-related prognosis model was constructed, which exhibited excellent predictive performance. We then mined two new therapeutic agents for breast cancer. Finally, we built two disulfidptosis-related ceRNA regulatory networks. These have yet to be previously studied. Therefore, the findings of this study can provide a theoretical basis for improving the prognosis of breast cancer and provide new hope for reducing the mortality rate of breast cancer.
Acknowledgement
None.
Conflict of Interest
No Conflict of Interest.
References
- Angela N Giaquinto, Hyuna Sung, Kimberly D Miller, Joan L Kramer, Lisa A Newman, et al. (2022) Breast Cancer Statistics, 2022. CA Cancer J Clin 72(6): 524-541.
- Siegel RL, Miller KD, Fuchs HE, Jemal A (2022) Cancer statistics, 2022. CA Cancer J Clin 72(1): 7-33.
- Siegel RL, Miller KD, Wagle NS, Jemal A (2023) Cancer statistics, 2023. CA Cancer J Clin 73(1): 17-48.
- Liu X, Nie L, Zhang Y, Yan Y, Wang C, et al. (2023) Actin cytoskeleton vulnerability to disulfide stress mediates disulfidptosis. Nat Cell Biol 25(3): 404-414.
- Zheng P, Zhou C, Ding Y, Duan S (2023) Disulfidptosis: a new target for metabolic cancer therapy. J Exp Clin Cancer Res 42(1): 103.
- Alhammad R, Khunchai S, Tongmuang N, Limjindaporn T, Yenchitsomanus PT, et al. (2020) Protein disulfide isomerase A1 regulates breast cancer cell immunorecognition in a manner dependent on redox state. Oncol Rep 44(6): 2406-2418.
- Zhao Y, Onda K, Sugiyama K, Yuan B, Tanaka S, et al. (2019) Antitumor effects of arsenic disulfide on the viability, migratory ability, apoptosis and autophagy of breast cancer cells. Oncol Rep 41(1): 27-42.
- Zhang S, Guo N, Wan G, Zhang T, Li C, et al. (2019) pH and redox dual-responsive nanoparticles based on disulfide-containing poly(β-amino ester) for combining chemotherapy and COX-2 inhibitor to overcome drug resistance in breast cancer. J Nanobiotechnology 17(1): 109.
- Yeo SK, Guan JL (2017) Breast Cancer: Multiple Subtypes within a Tumor? Trends Cancer. 3(11): 753-760.
- Zhang S, Wang Y, Gu Y, Zhu J, Ci C, et al. (2018) Specific breast cancer prognosis-subtype distinctions based on DNA methylation patterns. Mol Oncol 12(7): 1047-1060.
- Xu Q, Chen S, Hu Y, Huang W (2021) Landscape of Immune Microenvironment Under Immune Cell Infiltration Pattern in Breast Cancer. Front Immunol 12: 711433.
- Peng WX, Koirala P, Mo YY (2017) LncRNA-mediated regulation of cell signaling in cancer. Oncogene 36(41): 5661-5667.
- Wang B, Chen H, Yang R, Xing L, Chen C, et al. (2022) LncRNA RP11-551L14.4 suppresses breast cancer development by inhibiting the expression of miR-4472. Peer J 10: e14482.
- Jiao Y, Li S, Wang X, Yi M, Wei H, et al. (2022) A genomic instability-related lncRNA model for predicting prognosis and immune checkpoint inhibitor efficacy in breast cancer. Front Immunol 13: 929846.
- Wang Q, Li G, Ma X, Liu L, Liu J, et al. (2023) LncRNA TINCR impairs the efficacy of immunotherapy against breast cancer by recruiting DNMT1 and downregulating MiR-199a-5p via the STAT1-TINCR-USP20-PD-L1 axis. Cell Death Dis 14(2): 76.
- Zhang Y, Dong X, Guo X, Li C, Fan Y, et al. (2023) LncRNA-BC069792 suppresses tumor progression by targeting KCNQ4 in breast cancer. Mol Cancer 22(1): 41.
- Tanic M, Yanowski K, Gómez-López G, Rodriguez-Pinilla MS, Marquez-Rodas I, et al. (2015) MicroRNA expression signatures for the prediction of BRCA1/2 mutation-associated hereditary breast cancer in paraffin-embedded formalin-fixed breast tumors. Int J Cancer 136(3): 593-602.
- Chan M, Liaw CS, Ji SM, Tan HH, Wong CY, et al. (2013) Identification of circulating microRNA signatures for breast cancer detection. Clin Cancer Res 19(16): 4477-4487.
- Sher G, Salman NA, Khan AQ, Prabhu KS, Raza A, et al. (2022) Epigenetic and breast cancer therapy: Promising diagnostic and therapeutic applications. Semin Cancer Biol 83: 152-165.
- Lien EC, Lyssiotis CA, Juvekar A, Hu H, Asara JM, et al. (2016) Glutathione biosynthesis is a metabolic vulnerability in PI(3)K/Akt-driven breast cancer. Nat Cell Biol 18(5): 572-578.
- Ren Z, Liang H, Galbo PM, Dharmaratne M, Kulkarni AS, et al. (2022) Redox signaling by glutathione peroxidase 2 links vascular modulation to metabolic plasticity of breast cancer. Proc Natl Acad Sci U S A 119(8): e2107266119.
- Boieri M, Malishkevich A, Guennoun R, Marchese E, Kroon S, et al. (2022) CD4+ T helper 2 cells suppress breast cancer by inducing terminal differentiation. J Exp Med 219(7): e20201963.
- Peng G, Wang HY, Peng W, Kiniwa Y, Seo KH, et al. (2007) Tumor-infiltrating gammadelta T cells suppress T and dendritic cell function via mechanisms controlled by a unique toll-like receptor signaling pathway. Immunity 27(2): 334-348.
- Harris RJ, Cheung A, Ng JCF, Laddach R, Chenoweth AM, et al. (2021) Tumor-Infiltrating B Lymphocyte Profiling Identifies IgG-Biased, Clonally Expanded Prognostic Phenotypes in Triple-Negative Breast Cancer. Cancer Res 81(16): 4290-4304.
- Bauernhofer T, Kuss I, Henderson B, Baum AS, Whiteside TL (2003) Preferential apoptosis of CD56dim natural killer cell subset in patients with cancer. Eur J Immunol 33(1): 119-124.
- Xiao Y, Cong M, Li J, He D, Wu Q, et al. (2021) Cathepsin C promotes breast cancer lung metastasis by modulating neutrophil infiltration and neutrophil extracellular trap formation. Cancer Cell 39(3): 423-437.e7.
- Huang Z, Lou K, Liu H (2022) A novel prognostic signature based on N7-methylguanosine-related long non-coding RNAs in breast cancer. Front Genet 13: 1030275.
- Mi H, Wang X, Wang F, Li L, Zhu M, et al. (2020) SNHG15 Contributes to Cisplatin Resistance in Breast Cancer Through Sponging miR-381. Onco Targets Ther 13: 657-666.
- Nagy Z, Kovács I, Török M, Tóth D, Vereb G, et al. (2014) Function of RasGRP3 in the formation and progression of human breast cancer. Mol Cancer 13: 96.
- Chang G, Shi L, Ye Y, Shi H, Zeng L, et al. (2020) YTHDF3 Induces the Translation of m6A-Enriched Gene Transcripts to Promote Breast Cancer Brain Metastasis. Cancer Cell 38(6): 857-871.e7.
- Huang Z, Li J, Chen J, Chen D (2021) Construction of Prognostic Risk Model of 5-Methylcytosine-Related Long Non-Coding RNAs and Evaluation of the Characteristics of Tumor-Infiltrating Immune Cells in Breast Cancer. Front Genet 12: 748279.
- Yadav P, Sharma P, Sundaram S, Venkatraman G, Bera AK, et al. (2021) SLC7A11/ xCT is a target of miR-5096 and its restoration partially rescues miR-5096-mediated ferroptosis and anti-tumor effects in human breast cancer cells. Cancer Lett 522: 211-224.
- Teng Y, Qin H, Bahassan A, Bendzunas NG, Kennedy EJ, et al. (2016) The WASF3-NCKAP1-CYFIP1 Complex Is Essential for Breast Cancer Metastasis. Cancer Res 76(17): 5133-5142.
- Kim SH, Singh SV (2022) The FoxQ1 transcription factor is a novel regulator of electron transport chain complex I subunits in human breast cancer cells. Mol Carcinog 61(3): 372-381.
- Naz F, Sami N, Naqvi AT, Islam A, Ahmad F, et al. (2017) Evaluation of human microtubule affinity-regulating kinase 4 inhibitors: fluorescence binding studies, enzyme, and cell assays. J Biomol Struct Dyn 35(14): 3194-3203.
- Zheng L, Yang W, Zhang C, Ding WJ, Zhu H, et al. (2011) GDC-0941 sensitizes breast cancer to ABT-737 in vitro and in vivo through promoting the degradation of Mcl-1. Cancer Lett 309(1): 27-36.
- Fox EM, Miller TW, Balko JM, Kuba MG, Sánchez V, et al. (2011) A kinome-wide screen identifies the insulin/IGF-I receptor pathway as a mechanism of escape from hormone dependence in breast cancer. Cancer Res 71(21): 6773-6784.
- Yuan C, Luo X, Duan S, Guo L (2020) Long noncoding RNA LINC00115 promotes breast cancer metastasis by inhibiting miR-7. FEBS Open Bio 10(7): 1230-1237.
- Kong Q, Qiu M (2018) Long noncoding RNA SNHG15 promotes human breast cancer proliferation, migration and invasion by sponging miR-211-3p. Biochem Biophys Res Commun 495(2): 1594-1600.
- Du J, Zhong H, Ma B (2021) Targeting a novel LncRNA SNHG15/miR-451/c-Myc signaling cascade is effective to hamper the pathogenesis of breast cancer (BC) in vitro and in vivo. Cancer Cell Int 21(1): 186.
-
Weibo Hong*. Identification of Disulfidptosis-Related Subtypes, Prognosis Model and Cerna Network in Breast Cancer. Arch Clin Case Stud. 4(3): 2024. ACCS.MS.ID.000586.
-
Disulfidptosis; breast cancer; subtypes; prognosis model; ceRNA; iris publishers; iris publisher’s group
-

This work is licensed under a Creative Commons Attribution-NonCommercial 4.0 International License.


